Transcription
Toluene-MCH as a Two-Way Carrier for HydrogenTransmission and StorageD.D. Papadias and R.K. AhluwaliaU.S. DOE Hydrogen and Fuel Cells Program2020 Annual Merit Review and Peer Evaluation MeetingWashington, D.C.30 May 2020Project ID: H2058This presentation does not contain any proprietary, confidential,or otherwise restricted information.
OverviewTimeline Project start date: Oct 2020 Project end date: Sep 2020% Complete: 100Budget FY20 Total Funding: 100 K FY20 DOE Funding: 50 KBarriers H2 Storage Barriers Addressed:– B: System Cost– C: Efficiency– K: Life-Cycle AssessmentsPartners/InteractionsIndustry & research collaborations Chiyoda Corporation2
RelevanceChlor-Alkali[1]NGL Cracking[2]Solar[3]Wind[4]Rail infrastructureTransmission by Rail[5-6]Ship unloading cargoat a JettyTransmission by Ship[7-8]- Objectives Investigate the performance, regulated/unregulatedgreenhouse gas (GHG) emissions and costadvantages of using a two-way toluenemethylcyclohexane (MCH) carrier for hydrogentransmission and storage MPDevelopandanalyze specificsupply,BPH2 CapacityProduction hydrogenDecompositionoooCCT, CT, oCDHwt% andg/L demandP, barP, bartransmissionscenariosthat rierAmmonia-78-33.417.6121150375Haber-Bosch ProcessFe Based CatalystProductiono250T,CP,51barCu/ZnO/Al2O3 CatalystMethanolMPBPoo-9864.7CCH2 17.64712110240150375Non-PGM CatalystHaber-BoschProcessFe Based CatalystMethanol-9864.718.7514951250Cu/ZnO/Al2O3 Catalyst2080030.6High-Temperature CrackingNi CatalystDecompositiono29016.6T,CDHP, 3barSteam ReformingkJ/mol-H2235068.32080030.6Pt/Al2O3 CatalystHigh-TemperatureCrackingNi Catalyst329016.6Steam Reforming3
Approach- Tasks and Approach Develop models for cost and performance of toluene hydrogenation anddehydrogenation plants of 50-650 TPD (Metric Tons Per Day H2 equivalent). H2 supply scenarios: S1 – byproduct H2 from chlor-alkali plants, S2 – byproduct H2from NGL steam cracking, S3 and S4 – renewable H2 from solar and wind,respectively Develop models and/or use existing tools1 and models for cost and performance ofH2 demand scenarios (D1 - FC LDV, D2 – FC HDV, D3 – Power GTCC) Develop models for transmission, infrastructure and storage of MCH and tolueneby rail or by ships (product tankers) For each case study, determine the performance (energy consumption, MJ/kg-H2),levelized cost ( /kg-H2), and greenhouse gas emissions (kg-CO2/kg-H2) All pathway costs evaluated by H2A2 guidelines and based on 2016 -year basis1Toolsand methods: Matlab, GC-Tool, H2A, HDSAM, HDRSAM, SAM, Cost models (Internal nergy.gov/h2a analysis.html4
Approach(S1) - Utilization of by-Product H2 from Chlor-Alkali plants1 An estimated 0.4 million metric tons of hydrogen is produced annually by the chlor-alkaliindustry in the U.S. Approximately 80% of the United States chlor-alkali capacity is in the Gulf region About 35% of by-product hydrogen is known to enter the merchant gas market. H2 iscombusted for steam generation or vented ( 10-15%)By-product hydrogen capacity, 1010 TPDChlor-Alkali hydrogen capacity in LA and TXLA1Lee,243TXD.Y. and Elgowainy, A., Dai Q. Life Cycle Greenhouse Gas Emissions of By-Product Hydrogenfrom Chlor Alkali Plants. ANL/ESD-17/275
Approach(S1) - Utilization of by-Product H2 from Chlor-Alkali Plants1 About two-thirds (68%) of total electricity consumed by the U.S. chlor-alkali industry isfrom the bulk electricity market (or the grid); The remainder (32%) is sourced from on-site power generation. Most of the CHP unitsare in the Gulf Coast region, which all are topping cycle systems Steam is needed in the chlor-alkali production e.g. for salt preparation andconcentration of caustic soda. NaOH after-treatment process accounts for the largestheat requirement (95%) By-product hydrogen can be exported or used for steam/electricity production Hydrogen used for hydrogenation needs to be substituted by NG to meet heat demandHeat DemandGrid: U.S. Mix(10.4 MJe/kg-Cl2)Electricity DemandHeat DemandElectricity DemandGrid: U.S. Mix(10.6 ysisCl2After-treatmentNaOH0.028 ling andPurificationBoiler(η 80%)5.25MJth/kg-Cl2Boiler(η 80%)0.8 MJth/kg-Cl2NG: 3.22 MJth/kg-Cl2Case: By-product H2 is used for energy productionAfter-treatmentCl2NaOHCompression(1.3-10 bar)HydrogenationMCH0.46 kg-MCH/kg-Cl2System BoundarySystem Boundary1Lee,Cl2H295%Cooling andPurificationH2: 3.34 MJth/kg-Cl2ElectrolysisNG: 5.59 MJth/kg-Cl2Substitution: By-product H2 is used for hydrogenationD.Y. and Elgowainy, A., Dai Q. Life Cycle Greenhouse Gas Emissions of By-Product Hydrogenfrom Chlor Alkali Plants. ANL/ESD-17/276
(S2) - Utilization of by-Product H2 - NGL Steam Cracking Plants1,2 An estimated 1.8 million metric tons per year (5,000 tpd) of by-product hydrogen is producedannually from NGL steam crackers in the U.S. Steam crackers in Texas and Louisiana makes up 88% of the total by-product hydrogen As of 2017, ethane makes up 67% of the steam cracker feedstock in the U.S. (H2/C2H4 7.6 wt.%)Lake Charles,LA, 1,200,000Plants constructed 2016-2017based on ethane as feedstock.Source. University of OxfordCedarBayou, TX,1,500,000Point Comfort,TX, 800,000Baytown, TX,1,500,000West Virginia,272,158Freeport, TX, Monaca, PA,1,500,0001,250,000By-product hydrogen by steam crackers in the U.S.1By-product H2, tpdEthylene production. Metric , TXTXWest Monaca, PA Freeport,CedarLakeVirginiaTXBayou, TX Charles, LASteam crackers based on natural gas liquids (NGLs)1,2Heat Demand: 17.7 eamSteamCrackerH2: 8.88 GJth/Tonne-C2H4CH4: 3.52 GJ tionation5.26 GJ/Tonne-C2H4NGD.Y. and Elgowainy, A. International journal of hydrogen energy 43 (2018) 20143-20160Lindgren Group, LLC, Production of Ethylene from Natural Gas, April 22, 2013Compression1.1-10 barPSA(80% Recovery)H2 export(MCH)7
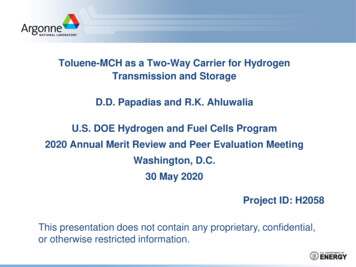
18Cost of Electricity, cents/kWhAccomplishmentS3 and S4 - Cost of Electricity by Wind and ty Factor, %4050Projected Electricity Costs Wind offers higher annual capacity factorthan solar. Wind capacity : TX 38.1% vs32.2% in CA Solar capacity factor near similar in TXand CA 21% Cost of solar cheaper than wind in allcases: CAPEX and OPEX of solar lessthan wind1WindStateTX (SW)CA (SE)ResourceWindWindTurbineGeneral Electric 3.6sl General Electric 3.6slRated Capacity (kW)3,6003,600Hub Height (m)8080CAPEX ( /kW)1,6951,695OPEX ( /MWh)18.118.1Analysis Period (years)2525IRR (%)1010Capacity Factor (%)38.132.2CAPEX (cents/kWh)4.985.89OPEX (cents/kWh)1.531.81Total LCOE (cents/kWh)6.517.71StateResourceArray TypeDirect normal (kWh/m2/day)Inverter Efficiency (%)CAPEX ( /kW)OPEX ( /MWh)Analysis Period (years)IRR (%)Capacity Factor (%)CAPEX (cents/kWh)OPEX (cents/kWh)Total LCOE (cents/kWh)TX (SW)Solar (PV)1 Axis Tracking5.23961,0404.8251021.15.510.496.00and solar techno-economics based on System Advisor Model (SAM). www.nrel.govCA (SE)Solar (PV)1 Axis Tracking5.23961,0404.8251021.45.440.485.928
ApproachUtilization by Wind – Example Profiles in TX160SEP35FEB50Power, MW3025201540Average yearly power302010105000481216Time of Day Average2024100Month90Renewable Power Intermittency80 Yearly, monthly and even hourly averagevalues are not very useful metrics foranalysis.70 Actual hourly profiles (e.g. wind) showsharp variability with 0-100% ratedcapacity and idling at hours. Using load following, the cost of hydrogenby electrolysis capital alone, will increaseby 2-2.5 /kg (at 38%-32% capacity factor)1ExamplePower, MWMonthly Averege, GWh40Average yearlypower60504030201000100 MW name-plate capacityCapacity Factor Annual energy produced/annual nameplate energy capacity20406080Hourly Profile Since JAN 11001209
AccomplishmentUtilization by Wind – Example Scenario OptionsBack to gridDaily production needRenewable Electricity, %PlantusageTo Grid:Excessat PeakDemand90From grid80 Excess electricity is sold back to the grid(all excess, or excess during peak demandhours 8 am – 8 pm) At times when wind power is less thanutilized for hydrogen production; importelectricity from the grid Cost of grid power: 5.74 /kWh, price ofelectricity sold: 2.5 /kWh Renewable power: Offset import to export80706060To Grid: None505040403030202030Capacity Factor, %400.2cents/kWhElectricity,of ofCost /kWhElectricity,Cost Utilize a fraction of the rated power of theplant for hydrogen production907010Renewable Power Intermittency100To Grid: All ExcessUsable Peak Power for Plant, %100To Grid - All Excess0.175To Grid - Excess at PeakDemand0.15To Grid - None0.1250.10.0750.0510Grid power assumes fossil based power and should not be confused with actual GHG emissions2030Capacity Factor, %4010
Reactor operated at 240 C and 10 atm for nearly complete conversion. Conversion iskinetically limited. No side-reactions are considered. Allowing for 0.5 atm pressure drop, 98.5% of MCH condenses at 9.5 atm and 45 C Excess H2 and MCH vapor recycled (H2/Toluene ratio 4/1) Toluene makeup 0.22% (due to dehydrogenation akeupTolueneRecycle H2/MCHStorage 2Cooling22%54%StorageMiscStorage 1MCH TankToluene TankC7H14(l)C7H14 /H2HeatRejectionH2C7H8(l)240 CFrom DehydrogenationPlant54H2C7H8(g)220 C180 CAccomplishmentCapital Cost of Toluene Hydrogenation PlantHeatRejection(High Grade)H2/TOL 3200 CH2CoolingHydrogenationSystem BoundaryT 250 CH2H2 (1.1 atm)Lindfors, L.P. et. al. (1993). Kinetics of Toluene Hydrogenation on Ni/Al2O3 Catalyst. Chem. Eng. Sci., 48, 381311
AccomplishmentCapital Cost of Methylcyclohexane Dehydrogenation Plant Reactor operated at 350 C and 2 atm. Conversion is 98% with 99.9% tolueneselectivity. No side-reactions considered. Allowing for 0.5 atm pressure, 80% of toluene condenses at 1.5 atm and 40 C,remaining during the compression cycle (4 stages) and chiller H2 separation by PSA at 20 atm, 90% recovery (ISO/SAE H2 quality)H2 Purification & 1.5 atm40 CH2ISO/SAE StandardTailgas (1.3 atm)20.8.atm4 stages/Intercooled20 atmTo StorageDehydrogenationFeedstock/Utilities CompressionSeparationStorage NG: 0.22 kWhth/KWhth-H2MiscTo BurnerArea 400Storage 1Storage 2Area 300Toluene TankMCH Tank Electricity: 0.04 kWhe/KWth-H240 CTOL ( 100%)70 CMCH ( 100%)6%C7H14 (g)250 CC7H14(l)Area 102Area 10142% 3H22 atm256 kWthPSA Tailgas255 CDehydrogenation30%16%T 300 CArea 200NG0.12 mol/s6%T 350 C350 CHigh gradewaste heatLosses Toluene MCH: 0.84% Hydrogen: 10% Heat: 0.36 kWhth/kWhth-H2System BoundaryDehydrogenationSeparationMiscOkada, Y. et. al. (2006). Development of Dehydrogenation Catalyst for Hydrogen Generation in Organic Chemical Hydride 6%Method.6%Int. J. Hydrogen Energy, 31, 1348.CompressionStorage12
Accomplishment(T1) - Transmission by RailScenario: Hydrogen by-product from chlor-alkali and steam cracker plants Hydrogenation of toluene: 50, 130, 260 and 650 TPD Location: Hydrogenation in Gulf of Mexico. 80% H2 capacity (5,200 TPD) Transmission: Unit train or ships to dehydrogenation facility in northern California Distribution: H2 distribution to LDV market by GH2 trucks to a mid-size city (3 M)MCH Storage9MCH Production10H2MCHToluene Storage9FreshToluene100 kmTolueneLiquid MCH/Toluene CarrierDistribution 14MCHUtilities5Toluene9TolueneMCH Decomposition11H2 Purification PSA12GH2 Terminal13H2MCH Storage9MCHMCHTolueneNGH2 Toluene, MCHByproduct H2 from Gulf CoastH2 Demand FC Vehicle Chlor Alkali Steam Cracker Train Frequency StorageRailcarsMarket 0461122602034.35.9241126504985.814.81314011Short ton (ton) 0.907 Metric ton (Tonne)Utilities 0.04/Ton-mile1Fuel: 380 Ton-mile/galwww.stb.gov: sample of carload waybills for all U.S. rail traffic submitted bythose rail carriers terminating 4,500 or more revenue carloads annually.13
Approach(T2) – Transmission by Product TankerECAECATanker Specifications50 TPD 130 TPD260 TPD650 TPDTanker Size (DWT)35,000 92,61592,615115,000Number of Ships per RouteTanker MCH Capacity (Tonnes)Tanker H2 Capacity (Tonnes)1124,400 63,3551,500 ker Length (m)Tanker Width (m)Tanker draught (m)Storage (Days)18330932239381332Tanker size limited by LR2 size, not Neopanamax canal dimensionsPanamax locks: Length of up to 294 m (965 ), beam of up to32.31 m (106 ), draught of up to 12.04 m (39.5 ).Neopanamax locks: Length of up to 427 m (1,401 ), beam of upto 52 m (170 ), draught of up to 18.3 m (60 ).MCH/Toluene tanker limited in capacity to 115 kDWT based on largest LR2 product tanker Round-trip time: 30 days (15 knots at sail; 8 h to pass Panama Canal, 20 h to unload and load shipment) From 2020, IMO regulations will cut sulfur dioxide emissions by 86%, reducingworldwide sulfur content in fuel from 3.5% (IFO) to 0.5% (MGO). Ships that operate in Emissions Control Areas (ECA) must limit sulfur content in fuelto 0.1% as in low-sulfur marine gas oil (LSMGO). Tanker will spend 27% of it’s time in ECA zones (sail & at berth) Panama canal fees varies on ship length, width and laden conditions14
Tanker (T2) Transmission Cost Relative to Rail (T1)2.5InfrastructureRail - FuelRail - Other2.01.641.581.53Tanker Transmissio Costs, 0.500.170.110.060.0550 TPD130 TPD260 TPD650 TPD2.01.5InfrastructureTanker - CAPEXTanker - FuelTanker - O&M Economy of scale favorslarge tankers (single shipper route) Tankers more favorable fortransmission than rail 50TPD GHG Emissions lowest forTanker 50 TPD 10.220.220.1150 TPD130 TPD260 TPD0.00.700.240.200.07650 TPD3.5Service Life, yr [30 25 18]-1.5%CAPEX [-20% 0 20%]-7.2% 2.8% 7.2% 18.2%Fuel Cost, /T [380 650 1000] 25.7%-4.3%0.5Tanker specific costs 92,600 DWT32.940.60.70.80.9Transmission Cost, /kg-H23.062.521.721.5-14.3%IRR [8% 10% 20%]GHG Emissions, kg-CO2/kg-H2Rail Transmission Cost, /kg-H22.51.5210.50RailShipShipShip(35 kDWT) (92.6 kDWT) (115 kDWT)15
Pathway Costs and Green-House Gas EmissionsResidual oil0.5%0.1%0.0%Natural gas29.8%45.5%41.3%Coal32.7%28.9%6.3%Nuclear power20.6%11.5%9.7%0.1%0.0%0.5%16.3%14.0%42.2%U.S. MixCA Mix4.06126.53325.560.000.000.00TRE (TX) 5.815Mass 00%BiomassRenewableElectricity Source (g-GHG/kWh)Residual oilNatural gasCoalNuclear powerBiomassRenewableTotal (g/kWh)Total (g/MJ)Chlor-AlkaliCo-products (kg/kg H2)Market Values ( /kg)Mass shareMarket value neBenzeneTolueneHydrogenTotalChlor-Alkali AllocationCl235.090.2646.33%32.62%Ethane Crackers - 6)(C7H8)(H2)0.24175.6362.890.000.000.00160GHG emissions, g-CO2/MJCA Mix141.03140120100806089.2964.0369.8140200Natural Electricity Electricity DieselGas(TX)(CA)Emissions and Energy Emissions and energy use include well topoint of use metrics according to latestGREET model 2019AllocationTRE (TX) MixElectricity Production MixGREET 2019U.S. MixElectricity Source (%) Electricity emissions used for TRE region(TX) and CA with a mix of energy sources H2 by-product emissions will be compared onsubstitution (NG consumption) as well as onmass-allocation basis (CO2 emissions spliton all co-products) For brevity, costs are compared for a largedemand case (650 TPD). All cost breakdowns are available in separate spreadsheet.16
Dehydrogenation cost by Bio-Methane (BM) (not shown)increases by 0.18/kg7.990.660.700.300.30 5.0 4.0 3.0 2.0 1.0 0.02.780.661.881.600.660.700.300.22S₁/T₂ (NG)0.300.22S₁/T₁ 45.8420S₃/S₄/T₁ (NG) S₃/S₄/T₂ (NG) By-product H2 incurs the lowest cost amongthe pathways analyzed. Using ships astransmission mode, the cost couldpotentially be below 2/kg1 By-product H2 could reduce GHG by 5771% relative to SMR if emissions are massallocated to all co-products and if biomethane is available for dehydrogenation.NG (Feedstock)NG (Fuel)ElectricityTransmission byLR2 Product 1.801.520.651.662.171.520.65SMRS₁ (S NG) S₁ (A NG) S₁ (A BM) S₃/S₄ (NG) S₃/S₄ (BM)(Reference)2.00 Producing renewable H2 in TX fordehydrogenation in CA will be at best costcompetitive ( 7.26/kg in CA) but incurhigher emissions.This is the lowest cost reflected by hydrogen substituted by NG forheat demand, and not assigning a “market” value for 00.760.600.400.200.000.080.070.290.221.60160.76 6.07.0918S Substitution, A Mass-Allocation,NG Natural Gas, BM Biomethane1.47 7.0Hydrogen 0.66Total GHG Emissions, kg-CO2/kg-H2 8.0Upstream Energy Use, MJ/MJ-H2Hydrogen Pathways Cost, /kg AccomplishmentCost, Up-stream Energy Use and Emissions: Summary0.270.1417
2.01.8Distribution Cost, /kg-H2Accomplishment(D1) - GH2 Terminal and Distribution 40.36130 TPD260 TPD650 TPD0.050 TPDLDV GH2 Refueling InfrastructureCalifornia City Case Size Population (Million)3333Station Utilization (%)80808080Station Dispensing Capacity (kg/day)4006008001000H2 Demand (TPD)50130260650H2 LDV Market Penetration (%)4101949H2 LDV Fleet87,700 219,000 416,000 1,075,000# of H2 Stations in City168280400822Distance Between Stations (km)3.362.62.181.52H2 Stations displacing Gas Stations (%)11182653# of TrucksRequired Per Day3280151388# 540 bar Trailers187310441907Tube trailers/H2 Daily demand (#/TPD)3.72.41.71.4Cost of Electricity - CA ( /kWh)0.1250.1250.1250.125GH2 Terminal Cost: 1.14/kg-H2Distribution costs are affected by thestation capacity (dispensing rate)13%Distribution (400 vs 1000 kg/day) Lower cost as number of tube trailers arereduced per daily demand- Gaseous H2 terminal Cost not affected by market penetrationrate. Buffer storage accounts for 36% ofthe cost (required to fill 540 bar/1,040 kgH2 within 10 hours)21%CAPEX - CompressorCAPEX - StorageElectricity30%O&M36%18
Accomplishment(D1) - GH2 Total Dispensing Costs and Emissions4.03.0CAPEX - CompressorCAPEX - DispenserCAPEX - RestO&M3.030.922.01.00.232.830.83CAPEX - StorageCAPEX - 0.160.230.160.310.690.680.660.5850 TPD130 TPD260 TPD650 TPD0.08.0Total GH2 Dispensing Cost, /kg-H2Dispensing Cost, /kg-H25.0Gaseous H₂ 1.161.151.1450 TPD130 TPD260 TPD650 TPD1.00.0Total Dispensing Cost (400 vs 1000 kg/day) Cost reduction by 1.23/kg as stationcapacity increases due to lowertransmission and dispensing costs- Emissions A total of 2.56 kg-CO2/kg-H2 for GH2refueling pathway. GH2 terminal account for50% of GHG emissions.GHG Emissions: 2.56 kg-CO2/kg-H2GH₂ Terminal31%50%DistributionDispensing19%19
Summary and ConclusionsThe performance, regulated/unregulated greenhouse gas (GHG) emissions and costadvantages of using a two-way toluene-methylcyclohexane (MCH) carrier forhydrogen transmission and end use was analyzed for different scenarios By-product H2 incurs the lowest cost among the pathways analyzed. Using ships astransmission mode, the cost, reflected by NG substitution only, could potentially bebelow 2/kg ( 1.88/kg S1/T2) By-product H2 pathway could reduce GHG by 58% relativ
1Wind and solar techno-economics based on System Advisor Model (SAM). www.nrel.gov Projected Electricity Costs Wind offers higher annual capacity factor than solar. Wind capacity : TX 38.1% vs 32.2% in CA Solar capacity factor near similar in TX and CA 21% Cost of solar cheaper than wind in all cases