Transcription
Icarus 230 (2014) 180–190Contents lists available at ScienceDirectIcarusjournal homepage: www.elsevier.com/locate/icarusImplications of dune pattern analysis for Titan’s surface historyChristopher J. Savage a, Jani Radebaugh a, , Eric H Christiansen a, Ralph D. Lorenz babDepartment of Geological Sciences, Brigham Young University, Provo, UT 84602, USAJHU Applied Physics Laboratory, 11100 Johns Hopkins Road, Laurel, MD 20723, USAa r t i c l ei n f oArticle history:Available online 13 September 2013Keywords:Titan, surfaceAtmospheres, dynamicsGeological processesRadar observationsSatellites, surfacesa b s t r a c tAnalysis of large-scale morphological parameters can reveal the reaction of dunes to changes in atmospheric and sedimentary conditions. Over 7000 dune width and 7000 dune spacing measurements wereobtained for linear dunes in regions across Saturn’s moon Titan from images T21, T23, T28, T44 and T48collected by the Synthetic Aperture RADAR (SAR) aboard the Cassini spacecraft in order to reconstruct theaeolian surface history of Titan. Dunes in the five study areas are all linear in form, with a mean width of1.3 km and mean crest spacing of 2.7 km, similar to dunes in the African Saharan and Namib deserts onEarth. At the resolution of Cassini SAR, the dunes have the morphology of large linear dunes, and they lackevidence for features of compound or complex dunes. The large size, spacing and uniform morphologyare all indicators that Titan’s dunes are mature features, in that they have grown toward a steady statefor a long period of time. Dune width decreases to the north, perhaps from increased sediment stabilization caused by a net transport of moisture from south to north, or from increased maturity in dunes to thesouth. Cumulative probability plots of dune parameters measured at different locations across Titan indicate there is a single population of intermediate-to-large-sized dunes on Titan. This suggests that, unlikeanalogous dunes in the Namib and Agneitir Sand Seas, dune-forming conditions that generated the current set of dunes were stable and active long enough to erase any evidence of past conditions.Ó 2013 Elsevier Inc. All rights reserved.1. IntroductionLinear dunes are the most abundant type of dune by area on Earthand Saturn’s moon Titan (Bullard et al., 1995; Lorenz et al., 2006;Radebaugh et al., 2008; Le Gall et al., 2011). They form a major partof the sediment transport system, represent the results of atmospheric and surface processes, and are sensitive to changes in both(Lancaster, 1995; Warren and Allison, 1998). A detailed geomorphologic study of these features can reveal important relationships andprocesses and illuminate the evolutionary history of the surface.Here we analyze dune width and crest spacing in select regionsacross Titan to identify variations with location and to reveal detailsof dune-forming processes on Titan on regional and global scales.1.1. Dunes on Titan from Cassini SARThe Cassini–Huygens mission has revealed Titan to have a variedand complex surface. Among other Earth-like features such as riverchannels (Lorenz et al., 2008), lakes (Stofan et al., 2007) and mountains (Radebaugh et al., 2007), the surface of Titan is covered by vastfields of sand dunes (Lorenz et al., 2006; Radebaugh et al., 2008).Dune sands on Titan are organic in composition and fine in size.Photochemical reactions in Titan’s atmosphere produce complex Corresponding author. Fax: 1 (801) 422 0267.E-mail address: janirad@byu.edu (J. Radebaugh).0019-1035/ - see front matter Ó 2013 Elsevier Inc. All rights 8.009organics that fall out of the atmosphere and accumulate on thewater ice-rich crust (Soderblom et al., 2007). The materials arethen perhaps solidified into a sedimentary layer, then eroded bymethane rainfall and surface flow into particles of varying sizes,including sand-sized (Lorenz et al., 2006). Eventually, the particlesare worked by near-surface winds, with velocities 1 m/s to saltatesuch particles in Titan’s conditions (Lorenz et al., 2006), into largefields of sand dunes (Lorenz et al., 2006; Barnes et al., 2008;Radebaugh et al., 2008). Thick sands are dark to the SyntheticAperture RADAR instrument (SAR) on the Cassini spacecraft, indicating they are smooth or absorbing at the Cassini SAR wavelength(2.17 cm), and are dark in the visible and near-infrared spectrum,as seen by the Cassini Visual and Infrared Mapping Spectrometer(VIMS) and Imaging Science Subsystems (ISS) instruments (Barneset al., 2008).Dunes are abundant on Titan’s surface, covering close to 13%of the total surface area, based on SAR observations (350 m resolution, about 35% global coverage to date) and VIMS and ISSanalyses (global coverage but lower resolution) (Le Gall et al.,2011; Rodriguez et al., 2014), and found within a belt 30 latitude of the equator (Lorenz et al., 2006; Radebaugh et al.,2008; Lorenz and Radebaugh et al., 2009; Le Gall et al., 2011).No permanent lakes or seas or large topographic obstacles (withthe exception of the Xanadu landmass) are present to disruptglobal wind patterns or dune formation (Lorenz and Radebaugh,2009).
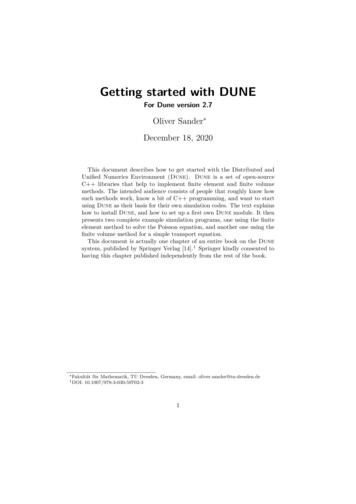
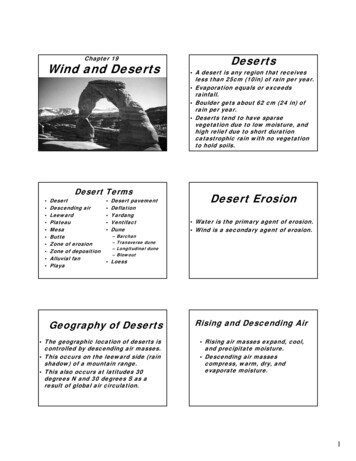
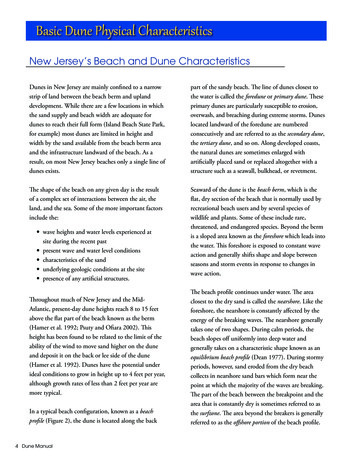
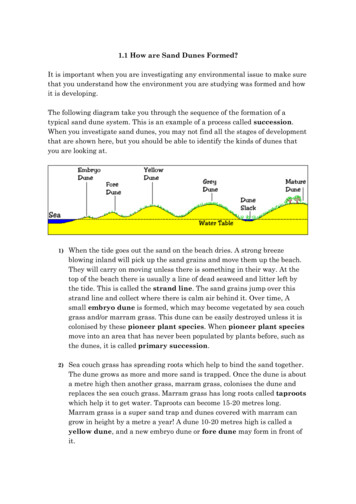
C.J. Savage et al. / Icarus 230 (2014) 180–190181may have blown or flowed, by mass wasting, into the interduneareas by active winds (Barnes et al., 2008).Despite the differences in gravity, atmospheric density and sandgrain composition on Titan and Earth, the size, morphology, andbehavior of Titan’s dunes around obstacles are similar to large linear dunes on Earth. Therefore, processes attributed to the evolutionof terrestrial linear dunes are applied to dunes on Titan (Lorenzet al., 2006; Radebaugh et al., 2008, 2010; Le Gall et al., 2011).2. Parametric analysis of Titan dune width and spacing2.1. Dune morphometric studyFig. 1. Example of Titan’s linear dunes from Cassini SAR swath T21 centered atabout 10.4 N, 279 W. Like similar terrestrial linear dunes, Titan’s dunes are slightlysinuous and generally parallel but do not appear to host superimposed or flankingdunes.The vast majority of Titan’s dunes are linear in form and oriented nearly parallel to the equator (Barnes et al., 2008; Lorenzand Radebaugh, 2009). They are up to several km in width andspacing, are up to 180 m high (Barnes et al., 2008; Neish et al.,2010) and can be more than 100 km long (Fig. 1; Lancaster,2006; Lorenz et al., 2006; Radebaugh et al., 2008). Titan’s duneshave been active in the recent geological past, as evidenced bythe fact that few, if any, other morphological features overlie dunesat Cassini SAR resolutions. In addition, the interdune area in manyof the dune fields is clearly distinguishable by VIMS. This meansthe substrate is exposed and kept clear of any dune sediments thatTitan’s dune widths and crest spacings were measured in fiveCassini SAR swath images, T21, T23, T28, T44, and T48 (Fig. 2).These image regions were chosen because they all span a rangeof latitudes and cross the equator, enabling changes with latitudeto be readily observed, they have easily identified dunes andinterdunes (unlike the more challenging T8 Belet region, for example) and they are located across many different Titan longitudes.Measurements were made using the USGS ISIS program at regular5 km intervals along dune long axes. Since most dunes on Titan aremany times longer than 5 km, this spacing provides an adequatesampling to capture significant variations along each dune. Testsusing smaller measurement intervals of 1.8 and 0.8 km did notyield significantly different results than those obtained using the5 km interval. Dune widths were measured perpendicular to thelong axis and taken to be the width of the SAR-dark streaks, whichare interpreted as dunes (Fig. 3). Interdune spacing was obtained insimilar fashion except the widths of the SAR-light areas betweenthe dark streaks were measured. Since dune crests are not commonly visible in the SAR images the crest-to-crest spacing, a common measurement in terrestrial dune analysis (Breed and Grow,1979; Lancaster, 1989, 1995; Ewing et al., 2006) was approximated. This was accomplished by pairing the average dune widthFig. 2. The approximate location of each measurement made in this study (in proportionately large symbols, and thus overlapping) is marked in red on a global mosaic of 36of Cassini’s SAR swaths, shown as grayscale strips, on a Cassini VIMS/ISS basemap. The five swaths sampled for this study are labeled, as are the major sand seas on Titan. Thered points roughly outline the dune fields observed in these swaths. Swaths vary in width from 150 km to nearly 400 km. SAR coverage across Titan’s equatorial latitudes atthe time of writing is approximately 35%.
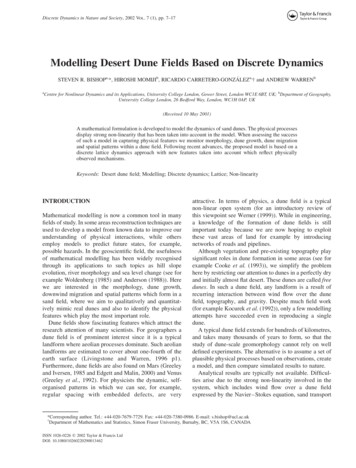
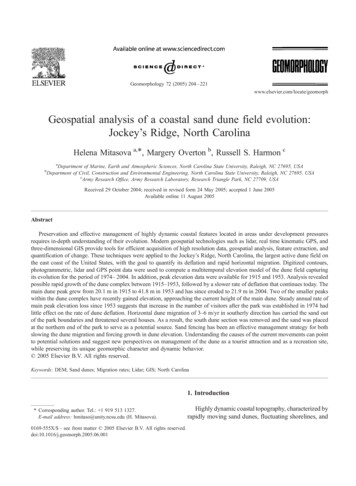
182C.J. Savage et al. / Icarus 230 (2014) 180–190Fig. 3. (a) Section of Cassini SAR swath T23 showing dunes (dark streaks) andinterdune areas (lighter areas). Measurements were taken approximately every5 km across the dune long axis, from one light/dark boundary to the next across thedark dune. Interdune spacing is measured from one light/dark boundary to the nextacross the light area between dunes. Crest spacing was not directly measured, butapproximated by adding the average interdune spacing per degree latitude/longitude to dune width in the same degree latitude/longitude. (b) (inset) Cartoondepicting dune pattern parameters and their measurements. Average dune widthand interdune spacing were added to obtain average crest spacing for a givenregion.Fig. 4. (a) SIR-C X-band (3 cm) image of linear dunes in the Great Sand Sea ofwestern Egypt. Small, flanking features, small offshoot linear dunes and crestlinesare clearly visible in the high-resolution image. (b) The same SIR-C image as in (a)but resampled to 350 m/pixel similar to Cassini SAR image resolution at the centerof the swaths. Some small features, such as crestlines and offshoot dunes are stillvisible. (c) The same SIR-C image as in (a) but resampled to 700 m/pixel, similar toCassini SAR resolutions near swath ends. Many small features are lost in this image,but a small flanking dune with maximum width 1000 m and minimum width200 m (white arrow) is still visible. SIR-C/X-SAR image courtesy of NASA/JPL,pr16158 9 16160 1 Lhh flip, in west-central Egypt, at 25 160 N, 26 500 E.with the average interdune width for each degree of latitude. Sincecrest locations would have been approximated, this method, andthe resulting ‘‘crest-to-crest average’’ spacing, was found to bemore accurate. In all, 14,050 individual dune width and interdunewidth data points were collected.The distribution of dune morphologies across the five studyswaths appears to be broadly homogeneous. All of the dunes observed and measured for this study are linear in form as observedat Cassini SAR resolutions of 350 m. Linear dunes on Titan are generally slightly sinuous, yet parallel, like many linear dunes onEarth. Unlike terrestrial dunes of similar size, however, such asthose found in the Namib Sand Sea in southern Africa, they donot appear to have intermediate-sized, superimposed flankingdunes that would be visible to Cassini SAR. Rather, there appearsto be a clean distinction between dunes and interdunes, in somecases with very high contrast, and in other cases with low contrast,but lacking variability at the dune/interdune boundary that mightindicate large, flanking features are running into the interdunes.This is supported by a SAR image of terrestrial linear sand dunesin the Great Sand Sea of western Egypt (Fig. 4a) that has been degraded to 350 m/pixel (Fig. 4b), similar to the effective resolutionat the center of Cassini SAR swaths. In this region, there is highcontrast between dunes and substrate, similar to many Cassinidune areas. While details become lost with progressive degradation, many features are still visible, such as small flanking or offshoot dunes, sometimes visible at subpixel widths becauseaveraging retains their signature. Cassini SAR images become moredegraded in resolution toward the far ends of the image swaths(e.g. see West et al., 2009), and the 350 m resolution images areplagued by noise (see also Neish et al., 2010, for a detailed resolution discussion), so we further degraded this image to 700 m for aFig. 5. (a) C-band SAR image of dunes in the Namib Sand Sea, Namibia. Radar-facingdune surfaces are bright in this image and smooth interdunes are dark, which is thereverse of the X-band-SAR-absorbing dunes in Egypt (Fig. 4) and Cassini SAR imagesof Titan dunes. Some dark bands parallel to dunes are shadows from SARillumination (Neish et al., 2010). Many superposed forms, flanking features andmultiple crests can be observed on these dunes. (b) Top image is resampled to350 m/pixel, similar to Cassini SAR image resolution at the center of the swaths.Small flanking and superposed features have been lost, but many intermediatefeatures in the interdunes and multiple crestlines are still retained. SIR-C/X-SARimage courtesy of NASA/JPL, pr44422, in the Namib Sand Sea, 24 30 S, 15 460 E.
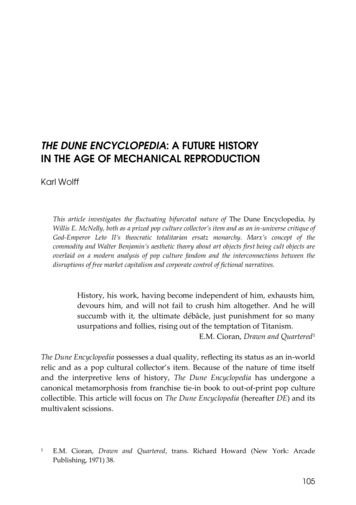
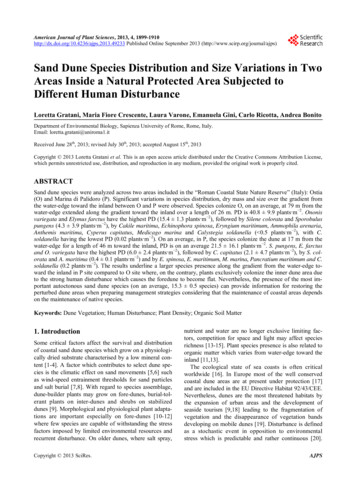
C.J. Savage et al. / Icarus 230 (2014) 180–190more conservative example (Fig. 4c). Crestlines completely disappear in this image, as well as most fine features, yet some flanking/offshoot dunes are still visible, including one feature (arrows)that is 300 m at the widest and 150 m at the narrowest. Theseimages demonstrate that high-contrast linear features are visibledown to 350 m, and in select cases smaller than this. Thus, we conclude that many intermediate-sized (350 m) flanking featuresshould be visible on Titan’s dunes, particularly in the high-contrastareas selected for this study, yet they are not observed.A C-band SAR image of dunes in the Namib Sand Sea (Fig. 5a)shows an area of compound/complex linear dunes, compound because they have multiple crestlines, up to five per dune in somecases, and complex because they have many intermediate flanking and superposed features (Lancaster, 1995). The image showsdune faces as bright, directly reflecting the SAR signal, whileinterdunes are smooth and dark to C-band SAR. Degradation to350 m per pixel (Fig. 5b) demonstrates that while many fine features are lost, intermediate flanking features and multiple crestlines are retained. Moreover, the general morphology of theselarge, compound/complex linear dunes, the product of manyoverlapping generations of dune forms, is vastly different fromthe general morphology of Titan’s much straighter, more uniformdunes (Fig. 1).1832.2. Width and spacing trendsTitan’s linear dunes measure from 0.4 km to about 3.6 km inwidth with a mean width of 1.3 km (Fig. 6a). Dune spacing rangesfrom 1.4 km to almost 5.3 km with a mean spacing of 2.6 km(Fig. 6b). Dune width and crest spacing averages for each individual study swath are all within one standard deviation (0.4 kmand 0.5 km respectively) of the global Titan mean. Titan dunesare slightly larger on average than linear dunes in the Namib SandSea, whose mean width is 0.9 km and mean spacing is 2.2 km (Lancaster, 1995).Dune width decreases toward higher northern latitudes, acrossTitan and in individual regions (Fig. 7a–c; Table 1). Dune spacingmay generally decrease toward higher northern latitudes in severallocations, but the overall average spacing does not show a significant trend with latitude (Fig. 7a and c). Le Gall et al. (2011) established a latitudinal dependence in the microwave electromagneticsignatures of the dune fields. The dune terrains are less emissiveand brighter toward the north, likely because the interdune fraction (ratio of interdune width to dune width) increases towardthe north.Exceptions to the trend of decreasing width with increasinglatitude can be attributed to local factors. For example, the dunesFig. 6. (a) Titan dune widths for all measured locations (Fig. 2). Mean width is 1300 m. (b) Titan dune spacing for all measured locations, mean spacing is 2600 m.
184C.J. Savage et al. / Icarus 230 (2014) 180–190Fig. 7. (a) Mean dune width and crest spacing per degree latitude for all dune measurements across Titan. Dune width decreases to the north while dune spacing shows nosignificant correlation with latitude. Error bars are 1-sigma, in most cases smaller than the symbols used. (b) Mean dune widths per degree latitude for each study swath. Notethat the trend of decreasing width with increasing latitude is visible in most of the study swaths. (c) Mean dune crest spacing per degree latitude for each of the study swaths.Note that the trend of decreasing dune crest spacing with increasing latitude may be present in a few of the swaths.
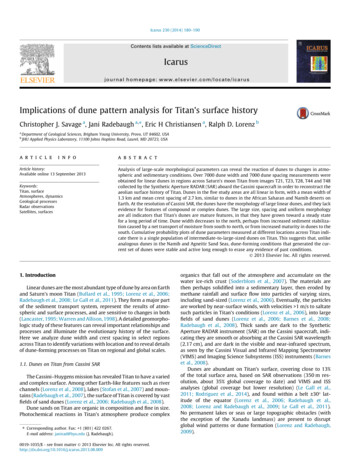
185C.J. Savage et al. / Icarus 230 (2014) 180–190Table 1Average width and spacing for all measured dunes across Titan for each degree of latitude. SD is standard deviation, SE is SD/n1/2, n is number of measurements, Ave. ID is averageinterdune width. All measurements are in meters.Lat.Ave. widthSDSEMin.Max.nAve. IDSDSEMin.Max.nAve. spacingSDSEMin.Max.n 12 11 10 9 8 7 6 5 4 3 2 1 d in the northern Fensal Sand Sea (swath T28) above 15 latitude all reside in small, isolated fields. This also is the case fordunes in the southern Senkyo Sand Sea (swath T23) between 11 and 12 latitude. In these smaller, isolated dune fields,dunes tend to be wider and more widely spaced than dunesfound in larger dune fields, such as those in the middle of theFensal/Aztlan Sand Sea (T28) between 7 and 13 and those inthe central Senkyo Sand Sea (swath T23) between 3 and 13 .The dunes in large fields are more closely spaced and have widthsthat generally decrease toward higher northern latitudes. In thenorthern Shangri-La Sand Sea (swath T44), there are outliers beyond this trend, but unlike those already mentioned the outlyingdunes in T44 between 15 and 19 latitude are not members ofsmall, isolated dune fields. In this region, it is difficult to accurately differentiate dunes from interdune areas because both areSAR-dark. This region is near the edge of the swath where resolution tapers off and gives way to sandy interdunes, leading to reduced contrast. Measurements here are thus more challenging.Some areas, however, such as the western margin of the BeletSand Sea (T21), have high contrast between the interdune anddune. If high-latitude dune field parameters are removed fromthe global averages, the R2 fit improves from 0.54 to 0.79 forthe trend of decreasing dune width toward higher latitudes, butdoes not improve for dune spacing.Overall, dune spacing is more variable than dune width becauseof the variation of interdune widths, likely related to the sinuosityof the individual dunes.2.3. Population identificationTerrestrial studies of dune parameters have yielded importantresults concerning dune field maturity, spatial variations andchanges over time. We apply the parametric analysis methods utilized by Ewing et al. (2006) in a study of White Sands and the Namib and Agneitir Sand Seas. The study assumes sample sizes arelarge enough that the distribution of sample means can be approximated by a normal distribution (according to the Central LimitTheorem; Triola, 2004). If this is true, cumulative probability plotsof the data can reveal separate populations of dunes if they existwithin the total sampled dune field or sand sea. These smaller populations are distinct and display their own log-normal distributions that plot as a single line on a log-normal plot of cumulativeprobability if the data are the result of a single mechanism ordune-building event (e.g., their White Sands plots). If the dataare the result of multiple mechanisms, then multiple lines willbe present, separated by breaks or inflection points (Fig. 8). Eachpopulation on the plot represents a significant change in conditions, such as wind direction, sediment availability or sedimentmobility, and can be identified and separated from other populations to further investigate the formative conditions at specificpoints in time.Cumulative probability plots of dune spacing in the Namib SandSea and the Agneitir Sand Sea (Fig. 8) show that each contains atleast three populations of dunes represented by distinct lines separated by inflection points. The trends in Fig. 8 imply two significant shifts in dune-forming conditions in each location and thusare evidence for three separate dune-forming periods.The main challenge in applying this method to Titan’s dunes isthe Cassini SAR image resolution of 350 m, as discussed above.Linear features with high SAR contrast, such as dunes, however,can be detected at subpixel size. Many of the flanking dunes inthe Namib and Agneitir Sand Seas are a couple of hundred metersapart (Breed and Grow, 1979; Lancaster, 1989, 1995; Ewing et al.,2006) and in many place they reach well into the interdune areaand would thus be apparent on Cassini SAR imagery (Figs. 4 and5). Smaller features, such as dunes superimposed on the crestline,which are the third-tier population in the Agneitir (Pop A inFig. 8b), would not be visible to Cassini SAR.Cumulative probability plots of dune widths and spacings(Fig. 9) of dunes across all five study swaths on Titan form a single
186C.J. Savage et al. / Icarus 230 (2014) 180–1903. Parametric and morphometric constraints on Titan dune typeA proxy for linear dune type (simple, compound, complex)may exist in the ratio of dune width to crest spacing. Breedand Grow (1979) note that there appears to be a linear arithmeticrelationship between mean widths and spacings across all lineardune types. This trend is particularly strong (R2 0.9) for data taken from linear dune fields on Earth (e.g. Lancaster, 1995, 2006;see Table 2 for locations). There is a similar relationship betweenwidths and spacings of all dunes measured per degree latitude onTitan, and dunes on Titan fit on the plot of Earth dunes wherelarge linear dunes are found (Fig. 12). The correlation of widthto spacing for dunes on Titan alone is weaker (R2 0.37) whenvalues for dunes are averaged per degree latitude, likely becauseall dunes studied are large and therefore plot close together, andbecause there is variation in width with latitude. The width andspacing relationship for all dunes on Earth and Titan, similar tothat plotted for limited Titan data by Lancaster (2006), has a correlation R2 0.89, when using average values per swath and perterrestrial dune area (Fig. 12). That such a relationship can becorrelated across Earth and Titan is further evidence that terrestrial dunes can be used as analogues for understanding Titan’sdunes (Radebaugh et al., 2010) and that the essential, dune-forming processes are the same. Breed and Grow (1979) also showedthat spacing tends to be about twice the mean width of lineardunes regardless of size (Table 2), a trend also found in Titan’sdunes.Because Titan’s dunes do not appear to have multiple crestlinesor host intermediate-sized superimposed or flanking dunes, theyare different from typical terrestrial compound or complex dunes(Breed and Grow, 1979; Lancaster, 1995; Bourke et al., 2010). Terrestrial dunes of comparable size to Titan’s dunes in the NamibSand Sea and Agneitir Sand Sea nearly all have large, superimposeddunes or multiple crestlines. Titan’s dunes are thus more similar tothe large linear dunes of the southern Great Sand Sea (in west-central Egypt) and the southern Rub’ al Khali, in Yemen, that are largebut do not have many intermediate-sized superimposed or flanking dunes. Such dunes, however, do have small superposed features that would not be visible to Cassini SAR resolutions. Thus,we suggest Titan’s dunes have the morphology of large lineardunes, and they lack any evidence for being compound or complexat the resolution of Cassini SAR.Fig. 8. Cumulative probability plots of dune spacing from (a) the Namib Sand Seaand (b) the Agneitir Sand Sea (from Ewing et al., 2006). Two inflection pointsseparate three different populations in each location. The smallest population (A)would not be visible to Cassini SAR, but at least some of population B and all ofpopulation C would be.curve and suggest the dunes measured are from a single population. Given that swaths are 150 km wide at the narrowest, thedatasets for each image swath include at least several dozen dunes.Plots of individual swaths also show single populations (Fig. 10),except dune spacing in the southern Senkyo Sand Sea (T23) has akink in the curve that may be evidence of more than one population. The slopes of the curves below and above the kink, however,are the same, unlike in the Namib and Agneitir, where differentpopulations have different slopes. A large dune region within theT23 swath (at 2 N and 350 W) shows overlapping dune forms,generally linear forms that have crossing orientations. These dunesappear downwind of a large, SAR-bright obstacle that has likelydisrupted winds and caused the dunes in the lee of the obstacleto have different orientations This is seen in a few other regionson Titan (Lorenz, 2014), and may be the explanation for the kinkin the population curve (Fig. 11).4. Linear dune maturity and wind regime stabilityDune size and morphological variety on Earth and Mars are largely functions of dune field maturity, or the length of time a dunefield is exposed to a given set of formative conditions (Warren andAllison, 1998; Ewing et al., 2006, 2010). Maturity is expressed byincreasing dune similarity (uniform morphology), increased complexity, increased size and crest spacing, and decreased defect density (Kocurek and Ewing, 2005; Ewing et al., 2006). Starting fromany number of initial conditions or dune forms, holding wind regimes steady forces sand into dunes that evolve through smaller,less complex morphological stages until they reach the largest,most complex and best ordered form allowed by their environment (Breed and Grow, 1979; Hersen et al., 2002; Ewing et al.,2006, 2010; Andreotti et al., 2009; Kocurek et al., 2010; Lorenzet al., 2010). Thus, dune morphology, size and spacing are all indicators of dune field maturity.Small dunes form in short periods of time while large dunesform under long-term, consistent wind conditions (Warren andAllison, 1998). Changes in wind patterns eventually lead todestruction of dunes and reconstitution of new dune forms(Warren and Allison, 1998). Thus, large dunes can be interpreted
C.J. Savage et al. / Icarus 230 (2014) 180–190187Fig. 9. Cumulative probability of (a) all widths and (b) all crest spacings measured for Titan’s dunes in this study. The lack of inflection points or breaks in the data suggeststhat all the dunes measured are from a single population.Fig. 10. (a) Cumulative probability of dune width for each of the study swaths. Each plot shows that the dunes measured for each swath belong to single populations. (b)Cumulative probability of dune crest spacing for each of the study swaths. Each plot shows that the dunes measured for each swath belong to single populations with thepossible exception of T23.
188C.J. Savage et al. / Icarus 230 (2014) 180–190Fig. 11. Dunes in the T23 region have overlapping, or interfering, forms. These maybe caused by wind disruption around the SAR-bright obstacle upwind, to the west.The deviated forms may have resulted in the kink seen in dune spacing in Fig. 10 forT23. Dune field at 2 N and 350 W.Table 2Mean width and spacing for various terrestrial dune fields (from Breed and Grow,1979; Lancaster, 1995).TypeLocationSpacing(m)Width(m)SimpleGreat Sandy Desert (Australia)Kalahari Desert (southern Africa)Navajo Reservation (northernArizona)NE Rub’ al Khali (Saudi Arabia)Simpson Desert (Australia)Simpson Desert (Australia)SW Kalahari (southern ompoundNamib (SW Africa)S Sahara (Niger)SW Rub’ al Khali (Saudi Arabia)SW Sahara (Mauritania – Agneitir)172419002180193065010601210940ComplexN Sahara (Algeria)Namib (SW Africa)Namib (SW Africa)Rub’ al Khali (Saudi Arabia)S Sahara (Niger)W Rub’ al Khali (Saudi 480as being older or having been present in the wind regime underwhich they grew for a longer period of time than smaller dunes(Warren and Allison, 1998; Bristow et al., 2007). Large, lineardunes can have construction times of several thousand to tens ofthousands of years (Lancaster, 1988; Warren and Allison, 1998).Dunes wi
Implications of dune pattern analysis for Titan's surface history Christopher J. Savagea, Jani Radebaugha, , Eric H Christiansena, Ralph D. Lorenzb a Department of Geological Sciences, Brigham Young University, Provo, UT 84602, USA bJHU Applied Physics Laboratory, 11100 Johns Hopkins Road, Laurel, MD 20723, USA article info Article history: Available online 13 September 2013