Transcription
Mindfulness (2021) 1704-7ORIGINAL PAPERA Network Analysis of the Five Facets Mindfulness Questionnaire(FFMQ)Oscar Lecuona1,2 · Carlos García‑Rubio2 · Sara de Rivas1Rosa Marta Meda‑Lara3 · Raquel Rodríguez‑Carvajal2· Jennifer E. Moreno‑Jiménez2·Accepted: 11 July 2021 The Author(s) 2021AbstractObjectives The Five Facet Mindfulness Questionnaire (FFMQ) is a popular self-report instrument for mindfulness assessment. However, several studies report mixed evidence regarding its reliability and validity. While recent replication studieshave shown several issues regarding its latent structure, first-order facets seemed to replicate successfully. This study proposesan exploratory approach to these facets on an item level in one sample, with cross-validation in another sample.Methods Using a snowball sampling, 1008 participants were recruited in the first sample. Psychometric networks wereapplied to explore relations between items and item clusters. We compared these exploratory latent variable proposals withprevious literature. A second sample of 1210 participants was collected from an FFMQ validation study, and confirmatoryfactor analyses were applied to cross-validate findings on the first sample.Results The FFMQ showed a positively correlated network. Exploratory analyses suggested the 5-facet structure as stablewith alternatives of 4-facet (merging Observe and Non-Judging) and 6-facet (splitting Acting with Awareness in two) solutions. However, the CFAs in the second sample did not provide clear support to any solution.Conclusions The FFMQ showed unclear evidence on its latent structure. We propose researchers and users of the FFMQ touse the most fitting solution between the 5 and 6-facet solutions in their data, since the 4-facet solution is difficult to interpret.We also propose cautionary notes and guidelines for researchers and applied users of the FFMQ and regarding this instrument. We conclude that more research is needed in mindfulness assessment to provide robust measurements.Keywords Mindfulness; FFMQ; Network analysis; Psychometric networks; Exploratory graph analysis; Confirmatoryfactor analysisMindfulness research has experimented a rapid growth ininterest and production (American Mindfulness ResearchAssociation, 2021). This interest has drawn even politicalattention (The Mindfulness All-Party Parliamentary Group,2015), and great importance in academia exploring its positive effects (for a review, see Creswell, 2016). Thus, reliable and valid measurement models and instruments are* Raquel ty of Health Sciences, King Juan Carlos University,Móstoles, Spain2Department of Biological & Health Psychology, Facultyof Psychology, Autonomous University of Madrid, IvanPavlov St., 6, 28049 Madrid, Spain3Health Science University Centre, University of Guadalajara,Guadalajara, Mexiconecessary to validate and expand this demand for evidencebased mindfulness research (for a review, see Bergomiet al., 2013b). The Five Facet Mindfulness Questionnaire(FFMQ; Baer et al., 2008) is a well-known and used selfreport instrument to measure mindfulness, since a large bodyof literature using it.FFMQ items measure mindfulness as an overall psychological construct with five main facets, named: “Observe,”as the tendency to observe stimuli (e.g., sensations of thewind in the body); “Describe,” as the tendency to verballydescribe those stimuli; “Acting with Awareness” or “Actaware,” as the tendency to attend to one’s activities in thepresent moment (in contrast with behaving mechanically, ordriven by “automatic pilot”); “Non-Judging of Inner Experience” or “Non-Judging,” as the tendency to not judge aparticular inner experience as good or bad; “Non-Reactingto Inner Experience” or “Non-Reacting,” as the tendency13Vol.:(0123456789)
2282to not immediately react to a particular inner experienceand “take a step back” to gain perspective. The popularityof the FFMQ is somehow due to a high number of international validations of the questionnaire (Lecuona et al., 2020).Nevertheless, scientific literature has drawn some criticismstoward the FFMQ. For example, evidence suggests thatmindfulness facets seem to be stable and valid while theoverall mindfulness factor seems unstable. At the same time,the external validity of the instrument remains robust exceptfor the Observe facet in the general population (i.e., nonmeditators). Structuring these comments, criticisms providechallenging evidence on (1) construct, (2) external, and (3)content validity.As regards (1) construct validity, a recent review and replication study reported several issues (Lecuona et al., 2020).First, most validation studies of the FFMQ cast concernsregarding their data analysis, which questions the apparentrobustness of the FFMQ in the literature. Second, the latentstructure could not be reproduced as a whole, requiring theinclusion of method factors and the removal of the Observefacet. Therefore, the replication concluded that the FFMQseems to have an unstable overall mindfulness factor in thegeneral population. However, mindfulness facets (first-levellatent factors) seem to replicate successfully.As regards (2) external validity, a recent meta-analysis(Carpenter et al., 2019) suggests similar conclusions as forconstruct validity (i.e., facets behaving psychometricallycorrect except for the Observe facet) and expands them.Concretely, it points out that although the FFMQ seems to beinversely related to negative affect and psychopathologicalsymptoms, the Observe facet is not meaningfully correlatedin the same way within general population (i.e., majority ofnon-meditators). Therefore, the Observe facet seems to notfit well to contribute to the overall mindfulness score, as wellas to the external validity of the instrument.Finally, as regards (3) content validity, a study providedevidence on how Buddhist expert meditators have littleagreement on the dimensions of FFMQ as mindfulnesscomponents, and also had a consistent disagreement withthe Observe facet (Belzer et al., 2013). Furthermore, anotherstudy showed that the FFMQ failed to show discriminantvalidity between a mindfulness-based intervention (MBI)and active controls (Goldberg et al., 2015).Therefore, it appears that the FFMQ has mixed evidencein the scientific literature. This state-of-the-art can produceundesirable consequences for the field. Skeptics could oversimplify or exaggerate this criticism (e.g., arguing MBIshold null effects due to the FFMQ issues). It is also predictable for a large force of applied users to ignore criticismsand use the standard (and apparently not robust) model ofthe FFMQ. This dissonance between technical and appliedresearch has taken place in other fields, like Cronbach’s αmisuse (Mcneish, 2017). Therefore, while research develops13Mindfulness (2021) 12:2281–2294new scalable instruments to measure mindfulness, an indepth exploration of its properties seems necessary to (1)acknowledge which components of the FFMQ are valid,and (2) offer an intermediate solution for both applied andresearch uses.It can be argued that although the FFMQ can be usedto assess mindfulness facets, the structure of said facetsneeds more evidence to be considered solid, especiallyregarding the Observe facet. The reason is that most of theFFMQ validation studies assessed the hierarchical model(assuming a second-order overall mindfulness factor). Incontrast, previous studies did not prioritize the correlated5-facet model. Due to this, inter-facet correlations, crossloadings, or correlations between items of different facetswere not explored in depth. In this regard, the field requiresmore exploratory techniques than CFA. Exploratory FactorAnalysis (EFA) and Exploratory Structural Equation Models(ESEM) are examples of these techniques. However, a recenttechnique can explore more freely how items relate to eachother, namely the psychometric network models (Epskampet al., 2018). Also known as Regularized Partial Correlation Networks (RPCNs), they have been recently introducedin psychological research (e.g., transdiagnostic models inpsychopathology).RPCNs allow to freely estimate correlations between psychological variables without being caused by an unobservedlatent entity. In addition, they provide more unbiased estimations with a three-step approach: First, they compute the correlation matrix (in the case for Likert variables, polychoriccorrelations); second, they partialize all correlations for theeffect of all other correlations; and third, they regularizethem (i.e., forcing all small correlations to zero), assumingthem to be non-meaningful and aiming for a parsimonioussolution (further reading in Epskamp et al., 2018). Thus,RPCNs stand out as a more flexible technique to explorecomplex interactions between observed variables. Moreover,RPCNs can be used to estimate stable groups of variablesvia Exploratory Graph Analysis (EGA, Golino & Epskamp,2017). These groups can be interpreted as emergent phenomena that arise from the networks, which is compatiblewith latent variables. Given EGA’s performance has shownto be as precise as standard EFA techniques like parallelanalysis (Golino et al., 2020), it seems suitable as an interesting option to explore the FFMQ at a first-order level.However, since RPCNs and EGA are novel techniques, across-validation technique should benefit the study. In thissense, confirmatory factor analysis (CFA) seems like theoptimal technique since it provides testing for specific solutions, like the outputs produced by the EGA.The FFMQ seems to provide stable facets (except forObserve in some contexts), but literature has not exploredthem deeply. Thus, this study explores the FFMQ at afacet level via psychometric networks. More concretely, it
2282Mindfulness (2021) 12:2281–2294Methodor issue that they had to the researcher in charge of the datacollection, and they could withdraw from the questionnaireat their convenience. The participants did not receive anycompensation for their participation. Finally, the secondsample was collected by contacting the researchers in chargeof the sample and agreeing on providing the dataset (detailsare provided in Meda et al., 2015).ParticipantsMeasuresWe collected two samples for this study, for exploratory andconfirmatory analyses, respectively. The first sample wasa snowball sample of 1008 participants. We recruited participants for the first sample using a three-step approach.First, we contacted university students from the Faculties ofPsychology of the Autonomous University of Madrid andthe King Juan Carlos University Madrid asking for participation. Second, we contacted a mindfulness institute to recruitparticipants before starting mindfulness-based interventions.Third, we posted on our social media profiles (i.e., Facebook, Twitter, Whatsapp, and Telegram) a call for participants. In all steps, all participants were asked to post on theirsocial media profiles our call for participants and contacttheir relatives to ask for participation. We conducted a poweranalysis for the estimated networks extracting three indices:True-estimated network correlation, sensitivity (true positives rate), and specificity (true negatives rate) (Epskamp& Fried, 2018). For our overall sample, we obtained a highcorrelation ( 0.95) and specificity values (around 88%),while sensitivity (around 68%) provided more modest values. However, figures of the power analysis (available athttps:// osf. io/ 65abr) show how sensitivity values are closeto asymptotic. Since RPCNs are designed to prefer higherspecificity than sensitivity, these results are expectable.Participants identified predominantly as women (75.89%),young (M 35.84 years, SD 13.31), with college studiesor above (60.90%), and had practiced meditation on at leasttwo occasions (72.59%).The second sample was collected by Meda et al. (2015)as an incidental student sample of 1210 participants. Participants identified predominantly as women (67.62%), young(M 20.10 years, SD 5.15), with college studies or above(90.10%). Meditation experience was not collected.The Five Facets of Mindfulness Questionnaireexplores the facet solutions that may underlie the FFMQ viaRPCNs and EGA. We expect the five-facet theoretical modelto be reproduced in our data, and therefore replicate the facetstructure of the FFMQ.ProcedureAll recruited participants signed an informed consent ofparticipation, which informed them about the privacy, anonymity, and confidentiality of the treatment of their data, following the Helsinki protocol. Then, we administered a copyof the FFMQ along with demographic items. All data werecollected in Spanish. We explained the rules of respondingto the questionnaire. The participants could ask any questionThe FFMQ consists of 39 self-reported items with a Likert response format from 1 (totally disagree) to 5 (totallyagree) (Baer et al., 2008; validated to Spanish population byCebolla et al., 2012). As discussed, it has a proposed latentstructure of five facets and a hierarchical or bifactor overallfacet with potential method factors, with an alternative structure of six facets (Karl et al., 2020; Lecuona et al., 2020).Data AnalysesDescriptive statistics were obtained for all variables andplots were examined. We applied RPCNs (Epskamp et al.,2018) to explore relations among items without assumingany structure or model. RPCNs import the network analysis framework to relations between psychological variables.Thus, network nodes (the basic components of the network)represent variables, and edges (links between nodes) represent partial regularized correlations. Mathematically,RPCNs take a correlation matrix (in this case, the polychoriccorrelation matrix since all items were ordinal) as an inputto partialize all correlations for all the other present correlations in the matrix. Then, it regularizes the false positiverate of the network forcing near-zero correlations to zero,assuming them to be essentially uncorrelated. We chosethe Expected Bayesian Inference Criteria (EBIC) estimation with the graphical Least Absolute Shrinkage Optimization (gLASSO) regularization as the network estimationmethod since it provides the most adaptable estimations forordinal, approximately normal data. Besides, a proportionof explained variance for each node by the network can beobtained with an R2 statistic. The final product of this process is a partial regularized correlation matrix, named as“weight matrix.”Following Mullarkey et al. (2018), we examined itemstandard deviations with an exclusion criterion of below2.5 SDs of standard deviations since small-variance itemscan influence the final estimates of the network. No itemsdisplayed standard deviations below the criterion. Also,conceptually or empirically overlapping items can biasnetwork estimations since they could measure latenttraits without relevant, unique content. Therefore, we13
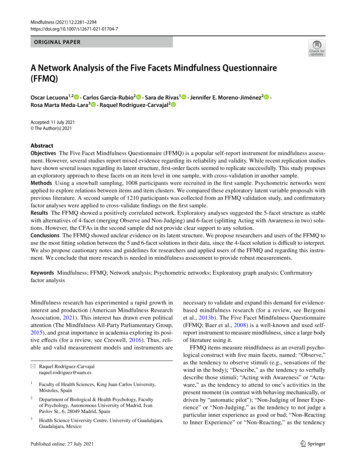
2282searched for empirically overlapped items with a threestep approach: (1) we selected pairs of items with potentialconceptual overlap and estimated their correlations, (2)obtained their mean and SD to form a criterion of 1 SD asempirically overlapping items, and (3) created compositescores for each resulting pair, reducing the network. Twopair of items met our criteria. Once the final network wasreduced and estimated, we applied bootstrap techniques tothe network to assess replicability of the network. Amongothers, we implemented the correlation stability coefficient(CS) to assess stability of edges, with values above 0.25 asminimum, and values above 0.5 as ideal (Epskamp et al.,2018). Once the replicability of the network is assessed,we proceeded to represent the network graphically (seeFig. 1 for an example). We chose the Fruchterman-Reingold algorithm since it provides visually clear and intuitive displays (all data are available at the Open ScienceFramework-OSF, in Supplementary Materials: https:// osf. io/ 65abr/).Fig. 1 Estimated network ofthe FFMQ with the 5-facetsolution—Fruchterman-Reingold method. Note: Items arerounded in circles, with piesrepresenting the explained variance (R2) of each item. Linesconnecting items representcorrelations, blue positivecorrelation, red negativecorrelation. Highly correlateditems tend to be closer, whilenon-correlated nodes tend to befarther13Mindfulness (2021) 12:2281–2294Once the network is estimated, it is relevant to assess therelative importance of each node. Two analytic concepts canbe provided: centrality and clustering. Centrality involvesthe intensity, closeness and inter-connectivity of each node.Clustering involves how much a node is closely connectedto a closed group of other nodes (e.g. items clustered due toa latent variable). Centrality measures will not be consideredin this study due to bias and interpretation issues when latentvariables are involved (Bringmann et al., 2019).Nevertheless, clustering was assessed with a five-stepapproach: First, we marked nodes with colors corresponding to theoretical facets to assess if current networks reproduced the model. Second, since Fruchterman-Reingoldplots do not provide interpretable distances between nodes,we implemented multi-dimensional scaling plots (see OSFSupplementary Materials) for better assessment of clusters.Third, we performed an Exploratory Graph Analysis (EGA,Golino & Epskamp, 2017) to explore latent variables in thenetwork. This technique has shown comparable performance
2282Mindfulness (2021) 12:2281–2294to traditional latent variable extraction methods, such as Parallel Analysis (Golino et al., 2020). Fourth, we also implemented a community analysis (mathematically equivalent toEGA) comparing other algorithms than the EGA’s default(i.e., walktrap and Louvain), like spinglass and multilevel.Model fit was assessed with entropy indices (Golino et al.,2019). More concretely, the Entropy Index (EFI) with Shannon entropy, the EFI with Von Neumann entropy (EFIvn),and the Total EFIvn (TEFIvn). In all cases, lower valuesindicate a better fit. TEFIvn was prioritized since it showshigher accuracy in over factored solutions. Fifth, we bootstrapped the EGAs to assess its replicability. We implemented two network estimation methods (gLASSO andTriangular Maximally Filtered Graph, or TMFG) crossedwith walktrap and Louvain algorithms. Dimension stabilitywas assessed with the median of proportions of proposedsolutions with a confidence interval, while item stability wasassessed with the median of replicated item correspondencesfollowing a certain solution.Finally, we implemented an Exploratory Factor Analysisfor this sample as a comparison to RPCNs and EGA estimates with a more standard technique (see OSF Supplementary Materials for technical details and outputs).To cross-validate our exploratory results, we implementedconfirmatory factor analysis (CFAs) to the second samplewith the structures proposed by EGA. As we mentionedbefore, all our items were Likert-type so we implementedpolychoric correlations, except for composite scores of overlapping items. The chosen estimation method was weightedleast squares mean-and-variance adjusted (WLSMV) sinceit provides better performance to other methods, like maximum likelihood robust (MLR) or unweighted least squares(ULS) (Li, 2016). Fit measures were the chi-square statistic(reported but not interpreted), the Comparative Fit Index(CFI) and Tucker-Lewis Index (TLI), both with values 0.90as a good fit, the root mean square error approximation(RMSEA), with values 0.07 as a good fit, and the standardized root mean square residual (SRMR), with values 0.08as good fit (following Hair et al., 2014, p. 584). If a CFAmodel did not meet the fit criteria, we implemented modification indices that provided a theoretical and empiricalimprovement of the model. A maximum of three modification indices were allowed. We compared CFA models withformal tests as Δχ2 (optimized for robust measures), anddirect differences between CFI, TLI, RMSEA, and SRMR.As a general assessment, we interpret increases in CFI andTLI and decreases of RMSEA and SRMR as indicative ofbetter fit.All analyses were computed using the R environment (RDevelopment Core Team, 2020). Descriptive statistics werecomputed using psych (Rewelle, 2014), while the networkanalyses were computed using bootnet (Epskamp et al.,2018), mgm (Haslbeck & Waldorp, 2015), and networktools(Jones, 2020). The EGAs were computed using EGAnet(Golino & Christensen, 2019), and the CFAs were computedusing lavaan (Rosseel, 2012). Data is available at https://o sf. io/ 65abr/ along with scripts and supplementary materials.ResultsFor both samples, item descriptive statistics did not showrelevant skewness except for item 23 in sample 2, althoughthey were prone to platykurtic distributions (Table 1). Therefore, we selected the mean and standard deviation (SD) astheir central tendency and dispersion estimators. All itemshad means around 3 (the central category) and SDs around1. No items showed informativeness issues (none had SDsrelevantly below the rest).Overlapping item analysis proposed two pairs of items asempirically overlapping: Items 5 and 13 (“When I do something, my mind wanders and I get easily distracted,” and “Iget easily distracted,” respectively), and items 25 and 30 (“Itell myself I shouldn’t be thinking the way I’m thinking” and“I think some of my emotions are bad or inappropriate andI shouldn’t feel them,” respectively). Therefore, we mergedboth pairs into two composite scores. Regarding networkanalyses, the FFMQ items showed a positively correlatednetwork (Fig. 1) with moderate-to-high predictability (meanof R2 0.444, SD 0.126), with only one item showing anR2 lower than 0.25 (item 11, R2 0.142). Bootstrap analysisrevealed a generally stable network (see OSF SupplementaryMaterials), with a correlation stability coefficient of 0.75,which is interpreted as stable. Based on visual inspection,theoretical facets show a good preliminary correspondencewithin the network, with all items belonging to a certainfacet being close to each other and little or no edges connecting between groups.Multi-dimensional scaling plots (Fig. 2) show a similarbehavior, with items belonging to each theoretical facetbeing close and connected with each other. However, twocautionary patterns arise: First, the Observe and NonReacting facets seem more disperse than the rest of thefacets, with some interconnections between them. Thiscould be due to these facets being merged in this sample,although they struggle to find a theoretical meaning following their content. Second, the Acting with Awarenessitems appears to split into two subgroups, with low correlations between each other. While proximate betweenthem, the first half of items of the Actaware are highlyconnected between them, while only one weak connection for each item with other Actaware items. The itemsof each subgroup are the first half of the Actaware facet(5 and 13 composite, 8, and 18) and the second half (23,28, 34, and 38). Attending to the content of the items, aplausible interpretation can be made. While both measure13
Mindfulness (2021) 12:2281–22942282Table 1 Descriptive statistics ofthe FFMQSample 1Sample 2ItemsMeanSDSkewness(SE 0.07)Kurtosis(SE 0.15)MeanSDSkewness(SE 0.07)Kurtosis(SE 80.14 0.300.11 0.010.160.03 0.45 0.270.150.010.02 0.590.10 0.35 0.31 0.540.13 0.20 0.10 0.14 0.10 0.62 0.170.32 0.32 0.46 0.25 0.110.15 0.32 0.45 0.340.090 0.10 0.11 0.52 0.200.00 0.130.14 0.56 0.70 0.97 0.46 0.74 0.95 0.41 0.57 0.38 0.90 1.04 0.28 0.78 0.84 0.76 0.35 0.79 0.55 0.63 0.74 0.560.02 0.73 0.65 0.72 0.50 0.72 0.48 0.39 0.82 0.62 0.60 0.50 0.55 0.82 0.25 0.63 0.65 0.92 70.931.201.111.131.021.22 0.34 0.06 0.14 0.06 0.08 0.39 0.28 0.29 0.68 0.30 0.270.19 0.41 0.52 0.79 0.37 0.460.41 0.81 0.35 0.31 0.15 0.66 1.27 0.19 0.38 0.78 0.20 0.770.07 0.62 0.480.050.48 0.89 0.11 0.530.06 0.80 0.22 0.51 0.80 0.82 1.04 0.29 0.61 1.00 0.70 0.25 0.51 0.89 1.17 0.65 0.51 0.20 0.95 0.50 0.620.18 0.59 0.88 0.61 0.031.27 0.70 0.61 0.14 0.720.38 0.69 0.45 0.79 0.71 0.700.40 0.91 0.42 0.800.12 0.87Note. SD, statistical deviation; SE, standard erroraMedian since skewness is 1 components of mindlessness or “automatic pilot,” the firstsubgroup seem to be more related to distractibility (e.g.,item 13: “I am easily distracted”), and the second subgroup to mindless actions (e.g., item 38: “I find myselfdoing things without paying attention”). Item distribution13with this proposed split is displayed in Table 2. Finally,connections between theoretical facets are few and low,except for item 2.Attending the rest of the network, the Describe and NonJudging items could display a behavior like Actaware but
2282Mindfulness (2021) 12:2281–2294Fig. 2 Estimated network ofthe FFMQ with the 5-facetsolution—multi-dimensionalscaling method. Note: Itemsare rounded in circles, withpies representing the explainedvariance (R2) of each item. Itemsize is reduced to make easierinterpretations. Lines connecting items represent correlations,blue positive correlation,red negative correlation.Highly correlated items tend tobe closer, while non-correlatednodes tend to be fartherTable 2 Contents of the Acting with Awareness items with a proposed interpretationActing with Awareness itemsContentsProposed interpretation5. When I do things, my mind wanders off and I’m easily distracted8. I don’t pay attention to what I’m doing because I’m daydreaming, worrying,or otherwise distracted13. I am easily distracted18. I find it difficult to stay focused on what’s happening in the present23. It seems I am “running on automatic” without much awareness of what I’mdoing28. I rush through activities without being really attentive to them34. I do jobs or tasks automatically without being aware of what I’m doing38. I find myself doing things without paying attentionDistraction, actions, mind-wandering DistractibilityDistraction, inattentiveness, actions,mind-wanderingDistractionInattentiveness, present momentActions, automatic pilotMindless actionsActions, inattentivenessActions, automatic pilotActions, inattentiveness13
2282were not regarded in this way due to more connectionsbetween items. Therefore, we conclude that the theoreticalfive facets seem to hold, but two alternative models ariseas potentially meaningful: A 4-facet model with Observeand Non-Reacting merged into a single facet (Fig. 3), and a6-facet model with Actaware split in two (Fig. 4).Exploratory Graph AnalysisThe default EGA supported the 5-facet model for the FFMQ.Different number of steps in the walktrap algorithm threwthe same solution except for 8 and 9 steps, proposing the4-facet solution. Regarding the spinglass algorithm, a different outlook was displayed. While the default algorithmproposed the 5-facet model, most variations of spins (from25 to 500 spins by steps of 50 stems) proposed the 6-facetmodel. Finally, the multilevel algorithm proposed the 5-facetmodel without variations.Entropy indices were convergent with the walktrap proposal, getting the best fit for the 5-facet model (Table 3). Thebootstrap analysis proposed in all cases the 5-facet solutionFig. 3 Networks of the FFMQwith 4-facet solution. Note:Items are rounded in circles,with pies representing theexplained variance (R2) ofeach item. Lines connectingitems represent correlations,blue positive correlation,red negative correlation.Highly correlated items tend tobe closer, while non-correlatednodes tend to be farther13Mindfulness (2021) 12:2281–2294with confidence intervals not reaching values below 4 orabove 6 (see OSF Supplementary Materials). The 4 and6-facet models received very little support. Dimension anditem stability analysis reported high stability for almost allfacets in all cases. The only exception was Non-Reacting,due to low or medium recovery rates for item 4, with the restof the items displaying acceptable or good recovery rates.Therefore, EGA proposes the 5-facet structure as the mostfitting and stable solution for the FFMQ.Finally, regarding the Exploratory Factor Analysis, noclear support was provided for the 4, 5 or 6-facet model (seeOSF Supplementary Materials). Nevertheless, the 5-facetmodel is perhaps the most fitting model due to partial support of Parallel Analysis and factor loadings following asimple structure with theoretical meaning.Confirmatory Factor AnalysisAs mentioned before, we imported the three resulting solutions from EGA and applied CFAs to cross-validate itsresults in the second sample. Fit measures are displayed in
2282Mindfulness (2021) 12:2281–2294Fig. 4 Networks of the FFMQwith 6-facet facet solution.Note: Items are rounded incircles, with pies representingthe explained variance (R2) ofeach item. Lines connectingitems represent correlations,blue positive correlation,red negative correlation.Highly correlated items tend tobe closer, while non-correlatednodes tend to be fartherTable 3 Entropy fit indices for three different facet solutions of theFFMQNumber of facetsEFIEFIvnTEFIvn4 facets (O and NR fused)5 facets6 fa
tions. However, the CFAs in the second sample did not provide clear support to any solution. Conclusions The FFMQ showed unclear evidence on its latent structure. We propose researchers and users of the FFMQ to use the most tting solution between the 5 and 6-facet solutions in their data, since the 4-facet solution is dicult to interpret.