Transcription
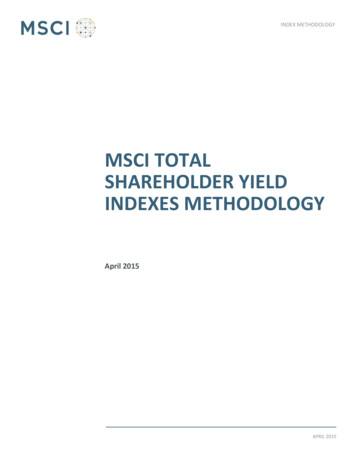
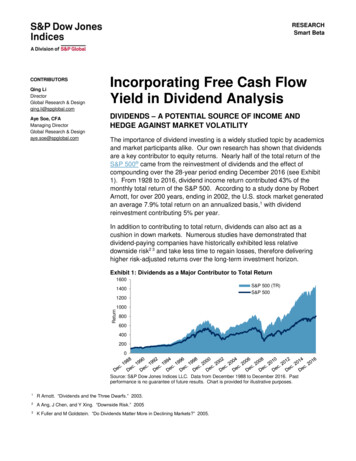
RESEARCHSmart BetaCONTRIBUTORSQing LiDirectorGlobal Research & Designqing.li@spglobal.comAye Soe, CFAManaging DirectorGlobal Research & Designaye.soe@spglobal.comIncorporating Free Cash FlowYield in Dividend AnalysisDIVIDENDS – A POTENTIAL SOURCE OF INCOME ANDHEDGE AGAINST MARKET VOLATILITYThe importance of dividend investing is a widely studied topic by academicsand market participants alike. Our own research has shown that dividendsare a key contributor to equity returns. Nearly half of the total return of theS&P 500 came from the reinvestment of dividends and the effect ofcompounding over the 28-year period ending December 2016 (see Exhibit1). From 1928 to 2016, dividend income return contributed 43% of themonthly total return of the S&P 500. According to a study done by RobertArnott, for over 200 years, ending in 2002, the U.S. stock market generatedan average 7.9% total return on an annualized basis,1 with dividendreinvestment contributing 5% per year.In addition to contributing to total return, dividends can also act as acushion in down markets. Numerous studies have demonstrated thatdividend-paying companies have historically exhibited less relativedownside risk2 3 and take less time to regain losses, therefore deliveringhigher risk-adjusted returns over the long-term investment horizon.Exhibit 1: Dividends as a Major Contributor to Total Return16001400S&P 500 (TR)S&P 5001200Return10008006004002000Source: S&P Dow Jones Indices LLC. Data from December 1988 to December 2016. Pastperformance is no guarantee of future results. Chart is provided for illustrative purposes.1R Arnott. “Dividends and the Three Dwarfs.” 2003.2A Ang, J Chen, and Y Xing. “Downside Risk.” 20053K Fuller and M Goldstein. “Do Dividends Matter More in Declining Markets?” 2005.
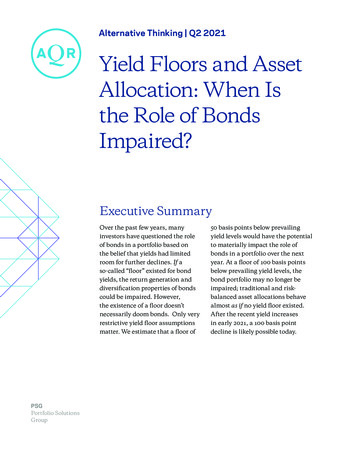
Incorporating Free Cash Flow Yield in Dividend AnalysisNovember 2017Our own research confirms that equity markets tend to reward dividendpayers over non-dividend payers, with the former outperforming the latteron average. Between December 1990 and June 2017, dividend payersgenerated higher risk-adjusted return than non-payers and the market (seeExhibit 2).4 Over a longer time horizon, the outperformance is even morepronounced. In a study of a 90-year return history of dividend payers andnon-dividend payers, dividend-paying stocks accumulated over three timesthe terminal wealth when compared with non-dividend payers5.Exhibit 2: Dividend Payers Offered Higher Risk-Adjusted Returns Than NonDividend Payers0.70.6Sharpe Ratio0.50.40.30.2High-dividend-yieldingstocks generatedhigher returns than theirlow-dividend-yieldingpeers.0.10.0Dividend PayersNon-Dividend PayersS&P 500Dividend payers and non-dividend payers are hypothetical portfolios.Source: S&P Dow Jones Indices LLC, FactSet. Data from December 1990 to June 2017. Pastperformance is no guarantee of future results. Chart is provided for illustrative purposes.Higher-Dividend-Yielding Stocks Generate Higher ReturnsOver the one-year period ending June 2017, S&P 500 member companiespaid out USD 430 billion in dividends, representing 44% of their totalearnings. The size of dividend payments alone should not be used todetermine the value of dividends. The figure ignores the size of thecompanies, the price market participants pay to receive that income, andthe sustainability of the payout figure. Dividend yield, measured asdividends divided by current share price, shows how much dividends arepaid out relative to share price without indicating the quality of dividends. Ina study6 conducted by Professor J. Siegel, the top 20% of the highestdividend-yielding stocks in the S&P 500 produced an annualized return of4We created two portfolios based on stocks’ dividend distribution policy. Taking from S&P 500 member stocks, one portfolio wasconstructed with only dividend payers and the other was formed with non-dividend paying stocks. The portfolios were reconstituted everysix months and stocks were equal weighted.5Ploutos. “Do Dividend Stocks Outperform?” 2016.6J. Siegel. “The Future for Investors: Why the Tried and the True Triumph Over the Bold and the New” 2005, pp. 127.RESEARCH Smart Beta2
Incorporating Free Cash Flow Yield in Dividend AnalysisNovember 201714.27% between 1957 and 2002, higher than the return of 11.19% from theS&P 500. Our own research also shows that high-dividend-yielding stocksgenerated higher returns than their low-dividend-yielding peers. The topquintile, which represents the top 20% of the highest-dividend-yield stocks,provided higher returns with lower volatility than the bottom-quintile stocksfrom December 1990 to June 2017 (see Exhibit 3). However, as other S&PDow Jones Indices studies have shown78, the top quintile stocks do notalways have the highest Sharpe ratio among all the quintiles after takingvolatility into consideration.Exhibit 3: Quintiles by Dividend YieldFACTORQUINTILE 1 QUINTILE 2 QUINTILE 3 QUINTILE 4 QUINTILE 5 S&P 500Annual Return (%)12.4712.4912.2011.4811.2610.07Annual Volatility (%)15.9713.7514.8414.2316.3514.17Sharpe Ratio0.610.700.640.610.52Top and bottom quintiles are hypothetical portfolios.Source: S&P Dow Jones Indices LLC, FactSet. Data from December 1990 to June 2017. Pastperformance is no guarantee of future results. Table is provided for illustrative purposes.Companies withsufficient cash havebetter opportunities tomaintain and expandtheir business whilepaying out persistent orgrowing dividends.0.52FREE CASH FLOW – A BETTER ASSESSMENT FOR ACOMPANY’S STRENGTH IN CASHIt is evident that dividend payers can produce attractive returns in the longrun. However, a company bearing high dividend yield may not necessarilybe in a financial condition to pay dividends for a number of reasons. First,a high dividend yield could be the result of decreasing stock price. Second,profitability is an accrual accounting concept, and does not carry the samestrength as cash flow in terms of a company’s solvency and liquidity. Acompany can be profitable but have little cash available. As dividends arepaid in cash, it is important to evaluate the source and sustainability of thedividends. Companies with sufficient cash have better opportunities tomaintain and expand their business while paying out persistent or growingdividends.To determine the level of potential dividend sustainability, we need toevaluate if dividends are covered by the cash generated from thecompany’s operating activities and how much cash is available, which isthe concept of free cash flow. Free cash flow can be defined as cash flowfrom operating activities minus capital expenditures, which is the amountthat a company spends on purchasing properties, plants, and equipment(PP&E) for business needs. A company can use excess cash to distributedividends, pay off debt, buy back stocks, or expand the business. Positiveor growing free cash flows often indicates sustainable or growing profits.7P. Luk. “The Beauty of Simplicity: The S&P 500 Low Volatility High Dividend Index” S&P Dow Jones Indices, 2015.8L. Zeng and P. Luk. “How Smart Beta Strategies Work in the Hong Kong Market” S&P Dow Jones Indices, 2017.RESEARCH Smart Beta3
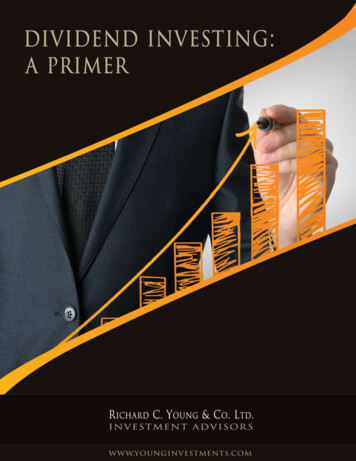
Incorporating Free Cash Flow Yield in Dividend AnalysisNovember 2017On the other hand, negative or decreasing free cash flows could mean thata company does not have adequate cash to support its operational growth.Stocks With a Higher Free Cash Flow Yield Provide Higher ReturnsWith high free cash flow possibly indicating a strong, healthy balance sheet,we tested to see if free cash flow yield, defined here as annual free cashflow per share divided by stock price, contains any meaningful returninformation. Our investment thesis is that all else being equal, a companywith a higher free cash flow yield will deliver higher free cash income foreach U.S. dollar invested and is preferable to one with a lower free cashflow yield.Exhibit 4: Annualized Returns by Free Cash Flow Yield in ized ReturnThe top-quintile stocksby free cash flow yieldgenerated anannualized return of15.7% from December1990 to June 2017,exceeding the rest ofthe quintiles andoutperforming theoverall market by anaverage of 3.6%.We divided the S&P 500 universe into quintiles based on free cash flowyield. As shown in Exhibit 4, the top-quintile stocks generated anannualized return of 15.7% from December 1990 to June 2017, exceedingthe rest of the quintiles and outperforming the overall market by an averageof 3.6%. Although the bottom two quintiles demonstrated soundperformance, with average annualized returns of 11.0% and 8.6%,respectively, they both fell short when compared with the overall equitymarket, as shown in Exhibit 5.12.0%10.0%11.0%8.6%8.0%6.0%4.0%2.0%0.0%Quintile 1Quintile 2Quintile 3Quintile 4Quintile 5S&P 500Quintiles 1-5 are hypothetical portfolios.Source: S&P Dow Jones Indices LLC, FactSet. Data from December 1990 to June 2017. Pastperformance is no guarantee of future results. Chart is provided for illustrative purposes.RESEARCH Smart Beta4
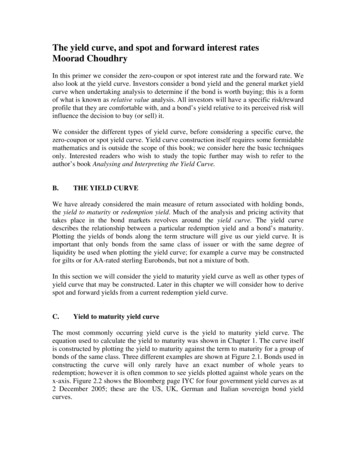
Incorporating Free Cash Flow Yield in Dividend AnalysisNovember 2017Exhibit 5: Excess Return by Free Cash Flow in QuintilesQuintile 1Quintile 2Quintile 3Quintile 4Quintile 5-4.0%-3.0%-2.0%-1.0%0.0%1.0%Excess Return2.0%3.0%4.0%Quintiles 1-5 are hypothetical portfolios.Source: S&P Dow Jones Indices LLC, FactSet. Data from December 1990 to June 2017. Pastperformance is no guarantee of future results. Chart is provided for illustrative purposes.The risk/return tradeoffis clearly seen in thetop three quintiles, ashigher returns areassociated with higherrisk taken by theportfolios.The risk/return tradeoff is clearly seen in the top three quintiles, as higherreturns are associated with higher risk taken by the portfolios. However,accepting more risk did not bring in better return for the bottom two quintileportfolios.Exhibit 6: Annualized Volatility by Free Cash Flow Yield in Quintiles18%16%Annualized Volatility14%12%10%8%6%4%2%0%Quintile 1Quintile 2Quintile 3Quintile 4Quintile 5Quintiles 1-5 are hypothetical portfolios.Source: S&P Dow Jones Indices LLC, FactSet. Data from December 1990 to June 2017. Pastperformance is no guarantee of future results. Chart is provided for illustrative purposes.The top-quintile portfolio, which comprises the securities with the highestfree cash flow yield, outperformed the underlying universe nearly 75% ofthe time, displaying the highest hit rate among all of the quintile portfolios(see Exhibit 7). Securities in Quintile 1 also had the highest hit rate duringbull markets. During down markets, we saw less favorable performancefrom the Quintile 1 portfolio; the portfolio only outperformed the market 50%of the time.RESEARCH Smart Beta5
Incorporating Free Cash Flow Yield in Dividend AnalysisNovember 2017Exhibit 7: Hit Rate of Quintiles by Free Cash Flow Yield in Up and Down Markets% OF TIME PORTFOLIO OUTPERFORMED THE S&P 500PORTFOLIOALL MARKETSUP MARKETSDOWN MARKETSQuintile 1727850Quintile 2626167Quintile 36859100Quintile 4423275Quintile 5383258Quintiles 1-5 are hypothetical portfolios.Source: S&P Dow Jones Indices LLC, FactSet. Data from December 1990 to June 2017. Pastperformance is no guarantee of future results. Table is provided for illustrative purposes.INCORPORATING FREE CASH FLOW WITH DIVIDEND YIELDThe negativecorrelation betweenfactor returns indicatesthat combining dividendyield and free cash flowyield in a multifactorframework canpotentially offerdiversification benefits.As we previously noted, stocks with high dividend yield have historicallyexhibited higher average returns, and stocks with high free cash flow yieldhad similar desirable performance behavior over the long term. Since eachyield metric contains return information, we further explored the relationshipbetween the two factors.Using the same period, we examined the return correlation betweendividend yield and free cash flow yield—calculated as the correlationcoefficient of the return from the top-quintile portfolio minus the return fromthe bottom-quintile portfolio. The negative correlation between factorreturns indicates that combining dividend yield and free cash flow yield in amultifactor framework can potentially offer diversification benefits (seeExhibit 8).Exhibit 8: Return Correlation Between Dividend Yield and Free Cash Flow YieldFACTORDIVIDEND YIELDFREE CASH FLOW YIELDDIVIDEND YIELDFREE CASH FLOW YIELD1.00-0.12-0.121.00Note: Quintiles 1-5 and the Dividend and Free Cash Flow Yield portfolio are hypothetical portfolios.Source: S&P Dow Jones Indices LLC, FactSet. Data from December 1990 to June 2017. Pastperformance is no guarantee of future results. Table is provided for illustrative purposes.We constructed a hypothetical large-cap portfolio, which incorporateddividend yield and free cash flow yield, to explore whether a combinedportfolio offers more desirable risk/return characteristics than the puredividend yield and cash flow yield portfolios.To form the multifactor portfolio, we first standardized the dividend yield andfree cash flow yield data for each security in the universe by calculating thez-score. To reduce outlier impact, the data was winsorized.9 The z-scoresof the dividend yield and free cash flow yield for each stock were thentransformed to cumulative normal distribution from 0 to 1 to form the final9For a stock with fundamental data positioning outside of the top or bottom 2.5 percentile ranks, its value is replaced with the value at the topor bottom 2.5 percentile ranks.RESEARCH Smart Beta6
Incorporating Free Cash Flow Yield in Dividend AnalysisNovember 2017dividend yield score and free cash flow yield score. The product of the twoscores gave us an integrated multifactor value to form security selection.Exhibit 9 shows the returns of ranked quintile portfolios by multifactor value.We can see that returns predicted by the integrated value are consistentwith the performance indicated by dividend yield and free cash flow yieldwhen used separately. It comes as no surprise that the combined Quintile1 portfolio, which also had the highest excess returns, outperformed thebroader market by an average of 6.03% per year, compared withannualized excess returns of 0.10% and 3.57% from the first quintileportfolios ranked by pure dividend yield and free cash flow yield,respectively.Exhibit 9: Annualized Excess Return Over S&P 500 by QuintileThe combined Quintile1 portfolio, which alsohad the highest excessreturns, outperformedthe broader market byan average of 6.03%per year.COMBINEDFACTORS (%)PURE DIVIDENDYIELD (%)PURE FREE CASHFLOW YIELD (%)Quintile 16.030.103.57Quintile 25.13-0.031.72Quintile 30.04-0.051.46Quintile 4-12.05-0.76-1.32Quintile 5-13.51-0.64-3.37PORTFOLIOQuintiles 1-5 are hypothetical portfolios.Source: S&P Dow Jones Indices LLC, FactSet. Data from December 1990 to June 2017. Pastperformance is no guarantee of future results. Table is provided for illustrative purposes.Incorporating cash flow yield into dividend portfolios does not result in loweryield. The Quintile1 portfolio also had the highest dividend yield (seeExhibit 10), with an average annual yield of 3.8% during the period. Thishigh dividend yield is supported by an average free cash flow yield of12.9% for the quintile, compared with the overall universe average freecash flow yield of 7.1%.Exhibit 10: High Dividend Yield Is Supported by Adequate Cash314Dividend YieldFree Cash Flow YieldAverage Free Cash Flow Yield121028614Free Cash Flow Yield (%)Dividend Yield (%)402Quintile 1Quintile 2Quintile 3Quintile 4Quintile 5Quintiles 1-5 are hypothetical portfolios.Source: S&P Dow Jones Indices LLC, FactSet. Data from December 1990 to December 2016. Pastperformance is no guarantee of future results. Chart is provided for illustrative purposes.The Quintile 1 portfolio, which consists of the highest multifactor value, hasdemonstrated the most significant outperformance over the universe.Hence, a strategy can be formed to invest in only the Quintile 1 securities.By conducting contribution analysis, we further explored the investmentRESEARCH Smart Beta7
Incorporating Free Cash Flow Yield in Dividend AnalysisNovember 2017value of this strategy. Exhibit 11 shows that the financials, utilities, andindustrials sectors were the top three contributors to return, all with around0.2% for a monthly average over the period. However, a heavy sectorconcentration is observed. On average, stocks from the financials sectordominated 23.35% of the Quintile 1 stocks, followed by utilities (17.33%)and consumer discretionary (13.57%). While defensive sectors such asutilities tend to have a more stable performance through economic cycles,sectors such as financials are more sensitive to economic cycles and tendto fluctuate more in up and down markets.While defensive sectorssuch as utilities tend tohave a more stableperformance througheconomic cycles,sectors such asfinancials are moresensitive to economiccycles and tend tofluctuate more in upand down markets.Exhibit 11: Financials Sector Dominates the Top QuintileMONTHLYAVERAGEWEIGHT (%)MONTHLYAVERAGE TOTALRETURN (%)MONTHLY AVERAGECONTRIBUTION TORETURN (%)13.571.290.14Consumer 2.970.620.03SECTORConsumer DiscretionaryFinancialsHealth CareIndustrials11.361.340.17Information Technology3.280.860.06Materials7.541.510.11Real Estate2.520.670.03Telecommunication ties[Unassigned]Quintile 1 is a hypothetical portfolio.Source: S&P Dow Jones Indices LLC, FactSet. Data from December 1990 to June 2017. Pastperformance is no guarantee of future results. Table is provided for illustrative purposes. Shaded rowsrepresent the sectors that had the highest concentration and monthly average contribution to return.Empirical studies10 11 12 have suggested that sector diversification can helpreduce volatility and positively influence risk-adjusted return. To achievediversified sector exposure, we selected the top five stocks in each sectorbased on their integrated value, and weighted equally. As shown in Exhibit12, the modified sector allocation led to an improvement in risk-adjustedreturn. The sector-diversified portfolio (shown in dark blue) had better riskadjusted return than all the quintile multifactor portfolios.10R Weiss. “Global Sector Rotation: New Look at an Old Idea.” 1998.11S Baca, B Garbe, and R Weiss. “The Rise of Sector Effects in Major Equity Markets.” 2000.12M Brière and A Szafare. “Factors and Sectors in Asset Allocation: Strong Together?” 2017.RESEARCH Smart Beta8
Incorporating Free Cash Flow Yield in Dividend AnalysisNovember 2017Exhibit 12: Sector Diversification Improves Risk-Adjusted ReturnCATEGORYReturn (%)Risk (%)SECTORQUINTILE QUINTILE QUINTILE QUINTILE .7110.2715.5717.2613.2013.2513.9015.7015.35S&P 5009.9014.291Sharpe Ratio0.90.80.70.60.50.40.30.20.10On a rolling 12-monthbasis, the portfoliooutperformed 74% ofthe time through allmarket conditions.Quintiles 1-5 and the sector-diversified portfolio are hypothetical portfolios.Source: S&P Dow Jones Indices LLC, FactSet. Data from December 1990 to December 2016. Pastperformance is no guarantee of future results. Chart is provided for illustrative purposes.The sector-diversified portfolio outperformed the S&P 500 over the shortand long-term investment horizons (see Exhibit 13). On a rolling 12-monthbasis, the portfolio outperformed 74% of the time, through all marketconditions. The multifactor portfolio had better returns in market downturns,outperforming during all the downside markets on a rolling 5- and 10-yearbasis.Exhibit 13: Sector-Diversified Portfolio Versus the S&P 500Outperformed S&P 500100%All Months90%Up Months80%Down Months70%60%50%40%30%20%10%0%Rolling 1-YearRolling 3-YearRolling 5-YearRolling 10-YearThe sector-diversified portfolio is a hypothetical portfolio.Source: S&P Dow Jones Indices LLC, FactSet. Data from December 1990 to June 2017. Pastperformance is no guarantee of future results. Chart is provided for illustrative purposes.RESEARCH Smart Beta9
Incorporating Free Cash Flow Yield in Dividend AnalysisNovember 2017The sector-diversified portfolio, on average, displayed higher dividend yieldthan the market (3.71% versus 1.96%), showing the benefit of sectordiversification. In addition, the portfolio demonstrated a strong tilt towardthe value factor, with lower average multiples than the benchmark (seeExhibit 14).Exhibit 14: Hypothetical Portfolio Shows Strong Value Tilt and High Dividend YieldSECTORUNCONSTRAINEDMULTIFACTORPORTFOLIO (%)SECTOR-DIVERSIFIEDPORTFOLIO (%)S&P 500 (%)Dividend Yield4.043.711.96Price/Earnings13.9815.0118.88P/E Using FY1 Estimation12.1012.6616.27P/E Using FY2 EstimationFACTORWe found that aportfolio of companieswith high free cash flowyield outperformed theoverall market andcompanies with lowfree cash flow yield.11.1711.7014.50Estimated 3-5 Year EPSGrowth7.797.5912.31Price/Cash .790.741.4013.3915.5718.99ROEThe sector-diversified portfolio is a hypothetical portfolio.Source: S&P Dow Jones Indices LLC, FactSet. Data from December 1990 to December 2016. Pastperformance is no guarantee of future results. Table is provided for illustrative purposes.CONCLUSIONDividend investing is an important part of total return generation over thelong-term investment horizon. Our research shows that dividend-payingstocks have historically outperformed non-dividend payers. Moreover, thetop-quintile portfolio ranked by dividend yield had higher risk-adjustedreturns than the bottom-quintile portfolio. When choosing high-dividendyield stocks, the sustainability and quality of dividends should not beoverlooked. We found that a portfolio of companies with high free cash flowyield outperformed the overall market and companies with low free cashflow yield. For market participants seeking solid and durable dividendincome, combining free cash flow yield with dividend strategies can serveas a starting point. Our study showed that a hypothetical portfolioconstructed by incorporating free cash flow yield and dividend yield metricshistorically displayed higher risk-adjusted returns than pure dividend yieldor free cash flow yield portfolios, without sacrificing income.RESEARCH Smart Beta10
Incorporating Free Cash Flow Yield in Dividend AnalysisNovember 2017GLOSSARYSmart BetaIt is also called factor investing, strategic beta or alternative beta. Smart beta strategy seeks to captureand exploit particular investment factors, and access the return that comes from exposure to nonmarket risk factors, as opposed to the return stemming from risk associated with the broad market.S&P 500 S&P 500 is an equity index that tracks the large-cap stocks in the U.S. stock market. The indexincludes 500 leading companies and captures approximately 80% coverage of available marketcapitalization.Sharpe RatioSharpe ratio, named after William F. Sharpe, is a measure of risk-adjust return. It is calculatedas the excess return of a portfolio over the risk-free rate relative to the portfolio’s standarddeviation. Typically, the 3-Month Treasury Bill Rate is used as proxy for risk-free rate.SR (Rp-Rf)/σpwhere:Rp portfolio returnRf risk- free rateσp standard deviation of the portfolioUSDAbbreviation of U.S.dollarDividend YieldDividend yield is a stock’s annual dividend relative to the stock priceFree Cash Flow YieldFree cash flow yield is a stock’s free cash flow per share relative to the stock price.Free cash flow is the excess cash that a business has after paying all of the operations andcapital expenditures.RESEARCH Smart Beta11
Incorporating Free Cash Flow Yield in Dividend AnalysisNovember 2017Correlation CoefficientCorrelation Coefficient is a statistical term. It measures the linear relationship between themovements of two variables. The value of the correlation coefficient is between -1 and 1, with -1being a perfect negative correlation, and 1 indicating a perfect positive correlation.Z-scoreComputing a z-score is a widely adopted method of standardizing a variable in order to combineit with other variables that may have a different scale or unit of measurement.After winsorizing dividend yield and free cash flow yield, the z-score for each of the two ratiosfor each security is calculated using the mean and standard deviation of the relevant variablewithin each of the index universes.The z-score is calculated as follows:𝑧𝛼 (𝑥𝛼 𝜇𝛼) /𝜎𝛼where:𝑧𝛼 Z-score for a given security.𝑥𝛼 Winsorized variable for a given security.𝜇𝛼 Arithmetic mean of the winsorized variable in the selection universe, excluding any missingvalues.𝜎𝛼 Standard deviation of the winsorized variable in the selection universe.Price/EarningsPrice/Earnings ratio is a stock valuation measure. It is calculated as stock price relative to itsearnings per share.P/E using FY1 EstimationPrice to Earnings Using FY1 Estimation is calculated as Pi/EPSFY1,iwhere:Pi Price for security i as of the report dateEPSFY1,i Mean EPS estimate of security i for the next unreported fiscal year as of thereport date. FY1 is defined as the next unreported fiscal year as of the report date.RESEARCH Smart Beta12
Incorporating Free Cash Flow Yield in Dividend AnalysisNovember 2017P/E using FY2 EstimationPrice to Earnings Using FY2 Estimation is calculated as Pi/EPSFY2,iwhere:Pi Price for security i as of the report dateEPSFY2,i Mean EPS estimate of security i for FY2 as of the report date. FY2 is defined asthe unreported fiscal year following FY1.Estimated 3-5 Year EPS GrowthThis is the estimated 3-5 year earnings per share (EPS) growth rate as of the report date. Thedata uses pre-calculated mean long-term EPS growth rate estimate from FactSet, First Call,I/B/E/S Consensus, and Reuters, which is calculated using each individual broker’smethodology.Price/Cash FlowPrice/Cash Flow ratio is a stock valuation measure. It is calculated as a stock’s price relative toits cash flow per share.Price/BookPrice/Book ratio is a stock valuation measure. It is calculated as a stock’s price relative to itsbook value per share.Price/SalesPrice/Sales ratio is a stock valuation measure. It is calculated as a stock’s price relative to itssales per share.ROEReturn on Equity (ROE) is calculated as net income divided by shareholder’s equity. It is aprofitability ratio and measures how much profit a company returns to the investment from theshareholders.RESEARCH Smart Beta13
Incorporating Free Cash Flow Yield in Dividend AnalysisNovember 2017S&P DJI RESEARCH CONTRIBUTORSCharles MountsGlobal Headcharles.mounts@spglobal.comJake VukelicBusiness Managerjake.vukelic@spglobal.comGLOBAL RESEARCH & DESIGNAMERICASAye M. Soe, CFAAmericas Headaye.soe@spglobal.comDennis BadlyansAssociate Directordennis.badlyans@spglobal.comPhillip Brzenk, CFADirectorphillip.brzenk@spglobal.comSmita hel DuSenior Analystrachel.du@spglobal.comBill HaoDirectorwenli.hao@spglobal.comQing LiDirectorqing.li@spglobal.comBerlinda Liu, CFADirectorberlinda.liu@spglobal.comRyan Poirier, FRMSenior Analystryan.poirier@spglobal.comMaria SanchezAssociate Directormaria.sanchez@spglobal.comKelly Tang, CFADirectorkelly.tang@spglobal.comPeter TsuiDirectorpeter.tsui@spglobal.comHong Xie, CFADirectorhong.xie@spglobal.comPriscilla LukAPAC Headpriscilla.luk@spglobal.comUtkarsh Agrawal, CFAAssociate Directorutkarsh.agrawal@spglobal.comLiyu Zeng, CFADirectorliyu.zeng@spglobal.comAkash JainAssociate Directorakash.jain@spglobal.comSunjiv Mainie, CFA, CQFEMEA Headsunjiv.mainie@spglobal.comLeonardo Cabrer, PhDSenior Analystleonardo.cabrer@spglobal.comAndrew InnesSenior Analystandrew.innes@spglobal.comAPACEMEAINDEX INVESTMENT STRATEGYCraig J. Lazzara, CFAGlobal Headcraig.lazzara@spglobal.comFei Mei ChanDirectorfeimei.chan@spglobal.comTim Edwards, PhDSenior Directortim.edwards@spglobal.comAnu R. Ganti, CFADirectoranu.ganti@spglobal.comHamish PrestonSenior Associatehamish.preston@spglobal.comHoward SilverblattSenior ARCH Smart Beta14
Incorporating Free Cash Flow Yield in Dividend AnalysisNovember 2017GENERAL DISCLAIMERCopyright 2017 by S&P Dow Jones Indices LLC, a part of S&P Global. All rights reserved. Standard & Poor’s , S&P 500 and S&P areregistered trademarks of Standard & Poor’s Financial Services LLC (“S&P”), a subsidiary of S&P Global. Dow Jones is a registeredtrademark of Dow Jones Trademark Holdings LLC (“Dow Jones”). Trademarks have been licensed to S&P Dow Jones Indices LLC.Redistribution, reproduction and/or photocopying in whole or in part are prohibited without written permission. This document does notconstitute an offer of services in jurisdictions where S&P Dow Jones Indices LLC, Dow Jones, S&P or their respective affiliates (collectively“S&P Dow Jones Indices”) do not have the necessary licenses. All information provided by S&P Dow Jones Indices is impersonal and nottailored to the needs of any person, entity or group of persons. S&P Dow Jones Indices receives compensation in connection with licensing itsindices to third parties. Past performance of an index is not a guarantee of future results.It is not possible to invest directly in an index. Exposure to an asset class represented by an index is available through investable instrumentsbased on that index. S&P Dow Jones Indices does not sponsor, endorse, sell, promote or manage any investment fund or other investmentvehicle that is offered by third parties and that seeks to provide an investment return based on the performance of any index. S&P Dow JonesIndices makes no assurance that investment products based on the index will accurately track index performance or provide positiveinvestment returns. S&P Dow Jones Indices LLC is not an investment advisor, and S&P Dow Jones Indices makes no representatio
The top-quintile portfolio, which comprises the securities with the highest free cash flow yield, outperformed the underlying universe nearly 75% of the time, displaying the highest hit rate among all of the quintile portfolios (see Exhibit 7). Securities in Quintile 1 also had the highest hit rate during bull markets.