Transcription
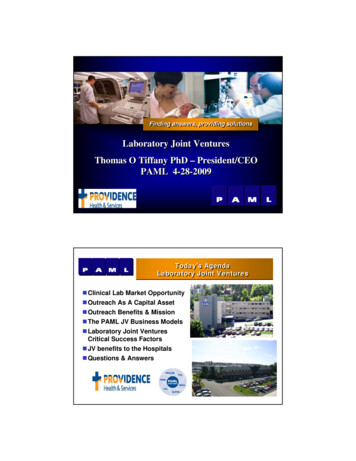
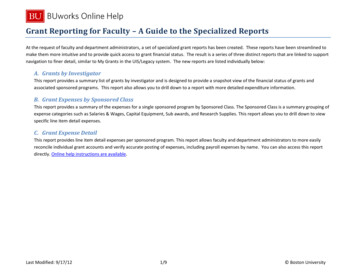
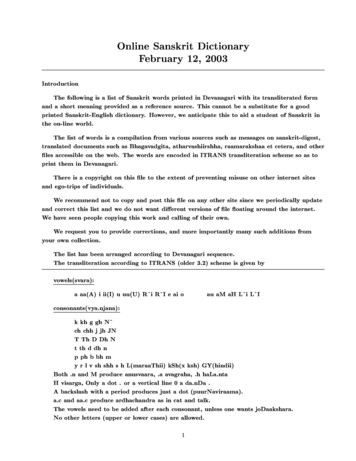
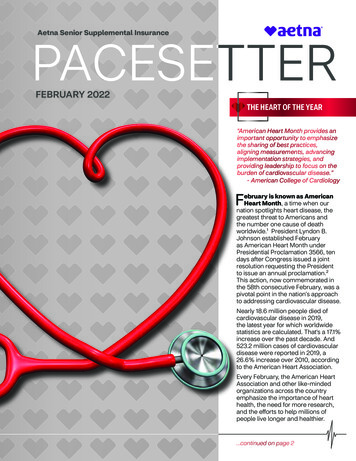
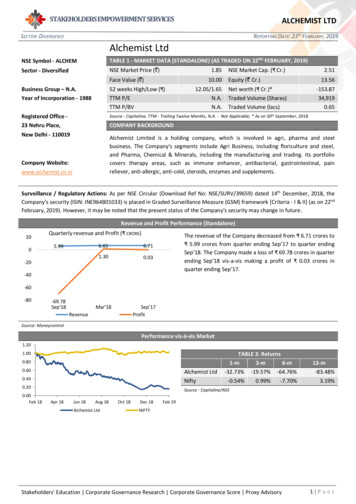
STAKEHOLDERS EMPOWERMENT SERVICESALCHEMIST LTDSECTOR: DIVERSIFIEDREPORTING DATE: 23RD FEBRUARY, 2019Alchemist LtdNSE Symbol - ALCHEMTABLE 1 - MARKET DATA (STANDALONE) (AS TRADED ON 22ND FEBRUARY, 2019)Sector - DiversifiedNSE Market Price ( )1.85Face Value ( )10.0012.05/1.65N.A.N.A.NSE Market Cap. ( Cr.)2.51Equity ( Cr.)Business Group – N.A.Year of Incorporation - 198852 weeks High/Low ( )TTM P/ETTM P/BVNet worth ( Cr.)*Traded Volume (Shares)Traded Volume (lacs)Registered Office 23 Nehru Place,Source - Capitaline, TTM - Trailing Twelve Months, N.A. - Not Applicable, * As on 30th September, 201813.56-153.8734,9190.65COMPANY BACKGROUNDNew Delhi - 110019Alchemist Limited is a holding company, which is involved in agri, pharma and steelbusiness. The Company's segments include Agri Business, including floriculture and steel,and Pharma, Chemical & Minerals, including the manufacturing and trading. Its portfoliocovers therapy areas, such as immune enhancer, antibacterial, gastrointestinal, painreliever, anti-allergic, anti-cold, steroids, enzymes and supplements.Company Website:www.alchemist.co.inSurveillance / Regulatory Actions: As per NSE Circular (Download Ref No: NSE/SURV/39659) dated 14th December, 2018, theCompany’s security (ISIN: INE964B01033) is placed in Graded Surveillance Measure (GSM) framework [Criteria - I & II] (as on 22ndFebruary, 2019). However, it may be noted that the present status of the Company’s security may change in future.Revenue and Profit Performance (Standalone)200Quarterly revenue and Profit ( CRORE)5.996.656.711.300.03-20The revenue of the Company decreased from 6.71 crores to 5.99 crores from quarter ending Sep’17 to quarter endingSep’18. The Company made a loss of 69.78 crores in quarterending Sep’18 vis-a-vis making a profit of 0.03 crores inquarter ending venueSource: MoneycontrolPerformance vis-à-vis Market1.201.000.800.60Alchemist LtdNifty0.400.200.00Feb 18TABLE 2- Returns1-m3-m6-m-32.73% -19.57% -64.76%-0.54%0.99%-7.70%12-m-83.48%3.19%Source - Capitaline/NSEApr 18Jun 18Aug 18Alchemist LtdOct 18Dec 18Feb 19NIFTYStakeholders’ Education Corporate Governance Research Corporate Governance Score Proxy Advisory1 PAGE
STAKEHOLDERS EMPOWERMENT SERVICESALCHEMIST LTDSECTOR: DIVERSIFIEDTABLE 3 – QUATERLY FINANCIALS (STANDALONE)( Cr.)Net WorthCurrent AssetsNon-Current AssetsTotal AssetsInvestmentsFinance CostLong Term LiabilitiesSep’18REPORTING DATE: 23RD FEBRUARY, 2019Mar’18Sep’17% ChangeSep ’18 vs Mar’18Mar’18 vs 5%-0.89%4,233.33%4,700.00%Current LiabilitiesTurnoverProfit After TaxEPS ( )Source - Money Control/Stock exchange filingAUDIT QUALIFICATIONSAudit Qualifications in last 3 years: The Statutory Auditors have made qualifications in their Report for FY 2015-16, FY 2016-17,FY 2017-18.Qualifications for FY 2017-18:STANDALONEBasis for Qualified Opinion: “Attention is invited to note no. 48 to the standalone financial statements which states that ‘TheCompany extends credit from time to time as per market practices. In respect of export receivables amounting to Rs 46,442.79lakhs, credit was extended for export sales in the normal course of the business, however it apparently got stuck. The Companyhas initiated legal recourse against the defaulting customers and is regularly following up on the same. The management isconfident of recovering all such dues and hence no provision is considered necessary against these receivables.Such export receivables are outstanding for more than three years as at the year end date, however, no provision is made againstsuch doubtful trade receivables.The loss to that extent is under stated and similarly the receivables, the effect however could not be quantified.”Qualified Opinion: “In our opinion and to the best of our information and according to the explanations given to us, except forthe effects of the matter described in the Basis for Qualified Opinion paragraph above, the aforesaid standalone financialstatements give the information required by the Act in the manner so required and give a true and fair view in conformity withthe accounting principles generally accepted in India, of the state of affairs of the Company as at 31st March, 2018, and its loss,total comprehensive income, changes in equity and its cash flows for the year ended on that date.”CONSOLIDATED: Similar qualifications were made for consolidated financial statements for FY 2017-18.Management Response: “The Company has extended credit from time to time as per the market practice for export receivablesand regular follow up is being done to recover the same and the management is confident to recover the same in the FY 2018-19.Hence, no estimate/provision made by management. The Company has initiated legal recourse against the defaulting customersand is regularly following up on the same.ResponseFrequency of Qualifications in last 3 years?CommentYesQualifications in last three financial years.Have the auditors made any adverse remark in last 3 years?NoHowever, the Auditors have mentioned thatthe matters described in the Basis for QualifiedOpinion paragraph may have an adverse effecton the functioning of the Company.Are the material accounts audited by the Principal Auditors?Yes-Do the financial statements include material unaudited financialstatements?No-Stakeholders’ Education Corporate Governance Research Corporate Governance Score Proxy Advisory2 PAGE
STAKEHOLDERS EMPOWERMENT SERVICESALCHEMIST LTDSECTOR: DIVERSIFIEDREPORTING DATE: 23RD FEBRUARY, 2019TABLE 4: BOARD PROFILE (AS PER ANNUAL REPORT - FY 2017-18)Regulatory Norms50%At least 1-% of Independent Directors on the Board% of Promoter Directors on the BoardNumber of Women Directors on the BoardClassification of Chairman of the BoardIs the post of Chairman and MD/CEO held by the same person?Average attendance of Directors in the Board meetings (%)Company50%0%2Executive Director*No95.83%Note: Board Composition is as on 31st March, 2018* The Company has not disclosed the name of the Chairman in the Annual Report, however, the Company in its CorporateGovernance Report for quarter ending 31st March, 2018 (Source: NSE Website) has disclosed that the Chairman of the Companyis "Mr. Bikram Bhattacharya as Chairperson & Executive Director"Composition of Board: As per Regulation 17(1)(b) of the SEBI (Listing Obligations and Disclosure Requirements) Regulations,2015, the Company should have at least 50% Independent Directors as the Company has Executive Chairman on the Board. TheCompany has 50% of Independent Directors.Board Diversity: The Company has 4 directors out of which 2 are Women Directors.Attendance at Board Meetings: During the FY 2017-18, the average attendance of Directors in the Board meetings was 95.83%.TABLE 5 - FINANCIAL RATIOS (STANDALONE)TradingRatiosSolvency RatiosLiquidityRatiosReturn RatiosTurnoverRatiosRatiosSep’18Inventory TurnoverDebtors TurnoverFixed asset TurnoverCurrent Asset TurnoverTotal Sales to Total Assets RatioOperating Profit MarginNet Profit MarginReturn on Assets (ROA)Return on Equity (ROE)Return on Capital Employed (ROCE)Current RatioQuick RatioCash RatioWorking Capital Turnover ratioDebt to Equity RatioTotal Liabilities to Totals Asset RatioRetained Earnings to Totals Assets Ratio*Long Term Debt to Total Asset RatioInterest Coverage RatioMarket Cap / SalesMarket Cap/ Net WorthMarket Cap/PATMarket .11N.A.0.89N.A.2.24N.A.501.67N.A.% ChangeSep ’18 vsMar’18 .A.N.A.N.A.-98.22%N.A.N.A.Source - Money Control/Stock exchange filing *Retained Earnings information is not available in quarterly financial resultsStakeholders’ Education Corporate Governance Research Corporate Governance Score Proxy Advisory3 PAGE
STAKEHOLDERS EMPOWERMENT SERVICESALCHEMIST LTDSECTOR: DIVERSIFIEDTABLE 6 - TRADING VOLUMEREPORTING DATE: 23RD FEBRUARY, 2019ParticularsSep'18Trading Volume (shares) (avg. of 1 qtr)Trading Volume (shares) (high in 1 qtr)Trading Volume (shares) (low in 1 qtr)Ratio - High/low trading volumeRatio - High/average trading ,61389056.874.6816,7581,04,5162,91435.876.24% ChangeSep ’18 vs Mar’18 Mar'18 vs 46%58.55%57.13%-24.89%Source - CapitalineShareholding (%)TABLE 7 (A): OWNERSHIP & MANAGEMENT RISKSDec' 18 Jun' 18 Dec' 17CommentsPromotershareholding34.9534.9534.95 No new equity shares were issued during the period from 1stJan 18 to 31st Dec 18.Public - Institutionalshareholding5.9812.2312.74 There was no change in the promoter shareholding during thesaid period.Public - Othersshareholding59.0752.8251.46Non Promoter NonPublic Shareholding0.000.000.85 The shareholding of public institution decreased from 12.74%to 5.98% and that of public others increased from 51.46% to59.07% during the same period. The promoters have not pledged any shares.Source - NSEMAJOR SHAREHOLDERS (AS ON 31st DECEMBER 2018)S. No.1PromotersKDS Corporation Pvt LtdShareholding22.56%S. No.Public ShareholdersShareholding1Torus Infra Development Pvt. Ltd.4.42%2Kanwar Deep Singh9.27%2Davos International Fund3.50%3Ravinder Singh1.63%3Sunil Talwar2.76%4Karan Deep Singh0.87%4Basics Softsolutions Pvt. Ltd.2.46%5Toubro Investments Limited0.44%5The New India Assurance Company Ltd.1.47%Source - NSETABLE 7 (B): OWNERSHIP & MANAGEMENT RISKSMarket Activity of Promoters*Preferential issue to promotersPreferential issue to othersGDRs issued by the CompanyIssue of ESOPs/Issue of sharesother than Preferential allotmentThe promoter shareholding decreased by 0.03% during FY 2017-18.No preferential issue of shares was made to the promoters during FY 2017-18.No preferential issue of shares was made to other shareholders during FY 2017-18.The Company did not issue any GDRs during FY 2017-18.The Company did not issue any shares to the employees under its ESOP Scheme during FY2017-18.Source - Annual Report FY 2017-18 * Source: As per Form MGT-9 forming part of the Annual Report FY 2017-18.TABLE 8: PRINCIPAL BUSINESS ACTIVITIES OF THE COMPANYSr. No.Name and Description of main products / services1.2.Pharma, Chemical and MineralsAgri Business% to Total turnover of the Company71.38%28.62%Source - Annual Report FY 2017-18Stakeholders’ Education Corporate Governance Research Corporate Governance Score Proxy Advisory4 PAGE
STAKEHOLDERS EMPOWERMENT SERVICESALCHEMIST LTDSECTOR: DIVERSIFIEDREPORTING DATE: 23RD FEBRUARY, 2019GlossaryEquity: The equity shares capital of the CompanyNet Worth: The amount by which the Assets exceeds the liabilities excluding shareholders’ funds of the CompanyTurnover: The revenue earned from the operations of the CompanyEPS: Earning Per Share is net profit earned by the Company per share𝐸𝑃𝑆 Profit After TaxNumber of outstanding sharesP/E ratio: It is the ratio of the Company’s share price to earnings per share of the Company𝑃/𝐸 𝑟𝑎𝑡𝑖𝑜 Price of each shareEarnings per shareCurrent Assets: Cash and other assets that are expected to be converted to cash in one yearFixed Assets: assets which are purchased for long-term use and are not likely to be converted quickly into cash, such as land,buildings, and equipmentTotal Assets: Current Assets Fixed AssetsInvestments: An investment is an asset or item that is purchased with the hope that it will generate income or appreciate inthe future.Finance Cost: The Financing Cost (FC), also known as the Cost of Finances (COF), is the cost and interest and other chargesincurred during the year in relation to borrowed money.Long Term Liabilities: Long-term liabilities are liabilities with a maturity period of over one year.Current Liabilities: A company's debts or obligations that are due within one year.Inventory Turnover ratio: Inventory Turnover is a ratio showing how many times a company's inventory is sold and replacedover a period.𝐼𝑛𝑣𝑒𝑛𝑡𝑜𝑟𝑦 𝑇𝑢𝑟𝑛𝑜𝑣𝑒𝑟 𝑟𝑎𝑡𝑖𝑜 Sales TurnoverInventoryDebtors Turnover: Accounts receivable turnover is an efficiency ratio or activity ratio that measures how many times a businesscan turn its accounts receivable into cash during a period𝐷𝑒𝑏𝑡𝑜𝑟𝑠 𝑇𝑢𝑟𝑛𝑜𝑣𝑒𝑟 𝑟𝑎𝑡𝑖𝑜 Sales TurnoverAccounts recievablesFixed Asset Turnover: The fixed-asset turnover ratio is a financial ratio of net sales to fixed assets𝐹𝑖𝑥𝑒𝑑 𝐴𝑠𝑠𝑒𝑡 𝑇𝑢𝑟𝑛𝑜𝑣𝑒𝑟 𝑟𝑎𝑡𝑖𝑜 Sales TurnoverFixed AssetsCurrent Asset Turnover: The current-asset turnover ratio is a financial ratio of net sales to fixed assets𝐶𝑢𝑟𝑟𝑒𝑛𝑡 𝐴𝑠𝑠𝑒𝑡 𝑇𝑢𝑟𝑛𝑜𝑣𝑒𝑟 𝑟𝑎𝑡𝑖𝑜 Sales TurnoverCurrent AssetsOperating Profit Margin: Operating margin is a measurement of what proportion of a Company’s revenue is left over afterpaying for variable costs of production such as wages, raw materials etc. It can be calculated by dividing a Company’s operatingincome (also known as “operating profit”) during a given period by its sales during the same period.𝑂𝑝𝑒𝑟𝑎𝑡𝑖𝑛𝑔 𝑃𝑟𝑜𝑓𝑖𝑡 𝑀𝑎𝑟𝑔𝑖𝑛 Operating profitSales TurnoverNet Profit Margin: Net profit margin is the percentage of revenue left after all expenses have been deducted from sales𝑁𝑒𝑡 𝑃𝑟𝑜𝑓𝑖𝑡 𝑀𝑎𝑟𝑔𝑖𝑛 Net profitSales TurnoverStakeholders’ Education Corporate Governance Research Corporate Governance Score Proxy Advisory5 PAGE
STAKEHOLDERS EMPOWERMENT SERVICESALCHEMIST LTDSECTOR: DIVERSIFIEDREPORTING DATE: 23RD FEBRUARY, 2019Total Sales to Total Assets Ratio: The total sales to total assets ratio measures the ability of a business to generate sales onassets.𝑇𝑜𝑡𝑎𝑙 𝑆𝑎𝑙𝑒𝑠 𝑡𝑜 𝑇𝑜𝑡𝑎𝑙 𝐴𝑠𝑠𝑒𝑡𝑠 𝑅𝑎𝑡𝑖𝑜 Sales TurnoverTotal AssetsReturn on Assets: ROA tells you what earnings were generated from invested capital (assets)𝑅𝑒𝑡𝑢𝑟𝑛 𝑜𝑛 𝐴𝑠𝑠𝑒𝑡𝑠 Net profitTotal AssetsReturn on equity/net worth: return on equity (ROE) is the amount of net income returned as a percentage of shareholders’equity.𝑅𝑒𝑡𝑢𝑟𝑛 𝑜𝑛 𝐸𝑞𝑢𝑖𝑡𝑦 Net profitNet worthReturn on Capital Employed: Return on capital employed (ROCE) is a financial ratio that measures a company's profitabilityand the efficiency with which its capital is employed.𝑅𝑒𝑡𝑢𝑟𝑛 𝑜𝑛 𝐶𝑎𝑝𝑖𝑡𝑎𝑙 𝐸𝑚𝑝𝑙𝑜𝑦𝑒𝑑 Net profitTotal Debt Equity share capitalCurrent ratio: The current ratio is a financial ratio that measures whether or not a firm has enough resources to pay its debtsover the next 12 months. It compares a firm's current assets to its current liabilities.𝐶𝑢𝑟𝑟𝑒𝑛𝑡 𝑟𝑎𝑡𝑖𝑜 Current AssetsCurrent LiabilitiesQuick ratio: The quick ratio is a measure of how well a Company can meet its short term financial liabilities.𝑄𝑢𝑖𝑐𝑘 𝑟𝑎𝑡𝑖𝑜 Current Assets InventoriesCurrent LiabilitiesCash ratio: The ratio of the liquid assets of a Company to its current liabilities.𝐶𝑎𝑠ℎ 𝑟𝑎𝑡𝑖𝑜 Current Assets Inventories Account RecievablesCurrent LiabilitiesWorking Capital Turnover ratio: The working capital turnover ratio is also referred to as net sales to working capital. It indicatesa Company's effectiveness in using its working capital.𝑊𝑜𝑟𝑘𝑖𝑛𝑔 𝐶𝑎𝑝𝑖𝑡𝑎𝑙 𝑇𝑢𝑟𝑛𝑜𝑣𝑒𝑟 𝑟𝑎𝑡𝑖𝑜 𝑆𝑎𝑙𝑒𝑠 𝑇𝑢𝑟𝑛𝑜𝑣𝑒𝑟Current Assets Current LiabilitiesDebt to Equity ratio: The debt-to-equity ratio (D/E) is a financial ratio indicating the relative proportion ofshareholders' equity and debt used to finance a company's assets.𝐷𝑒𝑏𝑡 𝑡𝑜 𝐸𝑞𝑢𝑖𝑡𝑦 𝑟𝑎𝑡𝑖𝑜 𝑆ℎ𝑜𝑟𝑡 𝑇𝑒𝑟𝑚 𝐷𝑒𝑏𝑡 𝐿𝑜𝑛𝑔 𝑇𝑒𝑟𝑚 𝐷𝑒𝑏𝑡𝑁𝑒𝑡 𝑊𝑜𝑟𝑡ℎInterest Coverage ratio: The Interest coverage ratio is a debt ratio and profitability ratio used to determine how easily aCompany can pay interest on outstanding debt.𝐼𝑛𝑡𝑒𝑟𝑒𝑠𝑡 𝐶𝑜𝑣𝑒𝑟𝑎𝑔𝑒 𝑅𝑎𝑡𝑖𝑜 𝐸𝑎𝑟𝑛𝑖𝑛𝑔 𝐵𝑒𝑓𝑜𝑟𝑒 𝐼𝑛𝑡𝑒𝑟𝑒𝑠𝑡 𝑎𝑛𝑑 𝑇𝑎𝑥𝐹𝑖𝑛𝑎𝑛𝑐𝑒 𝐶𝑜𝑠𝑡Long Term Debt to Total Assets Ratio: The long-term debt to total assets ratio is a measurement representing the percentageof a corporation's assets financed with loans or other debt obligations lasting more than one year.𝐿𝑜𝑛𝑔 𝑇𝑒𝑟𝑚 𝐷𝑒𝑏𝑡 𝑡𝑜 𝑇𝑜𝑡𝑎𝑙 𝐴𝑠𝑠𝑒𝑡 𝑅𝑎𝑡𝑖𝑜 𝐿𝑜𝑛𝑔 𝑇𝑒𝑟𝑚 𝐷𝑒𝑏𝑡𝑇𝑜𝑡𝑎𝑙 𝐴𝑠𝑠𝑒𝑡𝑠Retained Earnings to Total Assets Ratio: The ratio of retained earnings to total assets helps measure the extent to which acompany relies on debt, or leverage.𝑅𝑒𝑡𝑎𝑖𝑛𝑒𝑑 𝐸𝑎𝑟𝑛𝑖𝑛𝑔𝑠 𝑡𝑜 𝑇𝑜𝑡𝑎𝑙 𝐴𝑠𝑠𝑒𝑡𝑠 𝑅𝑎𝑡𝑖𝑜 𝑅𝑒𝑡𝑎𝑖𝑛𝑒𝑑 �� 𝐴𝑠𝑠𝑒𝑡𝑠Stakeholders’ Education Corporate Governance Research Corporate Governance Score Proxy Advisory6 PAGE
STAKEHOLDERS EMPOWERMENT SERVICESALCHEMIST LTDSECTOR: DIVERSIFIEDREPORTING DATE: 23RD FEBRUARY, 2019Total Liabilities to Total Assets Ratio: The liabilities to total assets ratio is a solvency ratio that examines how much of acompany's assets are made of liabilities.𝑇𝑜𝑡𝑎𝑙 𝐿𝑖𝑎𝑏𝑖𝑙𝑖𝑡𝑖𝑒𝑠 𝑡𝑜 𝑇𝑜𝑡𝑎𝑙 𝐴𝑠𝑠𝑒𝑡𝑠 𝑅𝑎𝑡𝑖𝑜 𝑇𝑜𝑡𝑎𝑙 ��𝑡𝑎𝑙 𝐴𝑠𝑠𝑒𝑡𝑠Market Cap/Sales ratio: Market Cap/sales ratio, Price–sales ratio, P/S ratio, or PSR, is a valuation metric for stocks. It iscalculated by dividing the company's market cap by the revenue in the most recent year; or, equivalently, divide the pershare stock price by the per-share revenue.𝑀𝑎𝑟𝑘𝑒𝑡 𝐶𝑎𝑝/𝑆𝑎𝑙𝑒𝑠 𝑟𝑎𝑡𝑖𝑜 𝑀𝑎𝑟𝑘𝑒𝑡 𝐶𝑎𝑝𝑆𝑎𝑙𝑒𝑠 𝑇𝑢𝑟𝑛𝑜𝑣𝑒𝑟Market Cap/ Net Worth ratio: It is a valuation ratio calculated by dividing Company’s market cap to net worth.𝑀𝑎𝑟𝑘𝑒𝑡 𝐶𝑎𝑝/𝑁𝑒𝑡𝑤𝑜𝑟𝑡ℎ 𝑟𝑎𝑡𝑖𝑜 𝑀𝑎𝑟𝑘𝑒𝑡 𝐶𝑎𝑝𝑁𝑒𝑡𝑤𝑜𝑟𝑡ℎMarket Cap/ PAT ratio: It is a valuation ratio calculated by dividing Company’s market cap to net profit.𝑀𝑎𝑟𝑘𝑒𝑡 𝐶𝑎𝑝/𝑃𝐴𝑇 𝑟𝑎𝑡𝑖𝑜 𝑀𝑎𝑟𝑘𝑒𝑡 𝐶𝑎𝑝𝑛𝑒𝑡 𝑝𝑟𝑜𝑓𝑖𝑡Market Cap/ EBITDA ratio: It is a valuation ratio calculated by dividing Company’s market cap to EBITDA.𝑀𝑎𝑟𝑘𝑒𝑡 𝐶𝑎𝑝/𝐸𝐵𝐼𝑇𝐷𝐴 𝑟𝑎𝑡𝑖𝑜 𝑀𝑎𝑟𝑘𝑒𝑡 𝐶𝑎𝑝𝐸𝐵𝐼𝑇𝐷𝐴Trading Volume (shares) (avg. of 1 year): Average number of shares/day traded in 1 yearTrading volume (shares) (high in 1 year): Highest number of shares/day traded in 1 yearTrading volume (shares) (minimum in 1 year): Lowest number of shares traded on any one day in 1 yearStakeholders’ Education Corporate Governance Research Corporate Governance Score Proxy Advisory7 PAGE
STAKEHOLDERS EMPOWERMENT SERVICESSECTOR: DIVERSIFIEDALCHEMIST LTDREPORTING DATE: 23RD FEBRUARY, 2019DISCLAIMERSourcesOnly publicly available data has been used while making the factsheet. Ourdata sources include: NSE, SEBI, Capitaline, Moneycontrol, Businessweek,Reuters, Annual Reports, IPO Documents and Company Website.Company InformationAnalyst CertificationThe analysts involved in development of this factsheet certify that no part ofany of the research analyst’s compensation was, is, or will be directly orindirectly related to the contents of this factsheet.DisclaimerThis Report has been made by SES as a paid service for which consideration hasbeen paid by NSE.While SES has made every effort and has exercised due skill, care and diligencein compiling this factsheet based on publicly available information, it neitherguarantees its accuracy, completeness or usefulness, nor assumes any liabilitywhatsoever for any consequence from its use. This factsheet does not haveany approval, express or implied, from any authority, nor is it required to havesuch approval. The users are strongly advised to exercise due diligence whileusing this factsheet.This factsheet in no manner constitutes an offer, solicitation or advice to buy orsell securities, nor solicits votes or proxies on behalf of any party. SES, which isa not-for-profit Initiative or its staff, has no financial interest in the companiescovered in this factsheet except what is disclosed on its website. The factsheetis released in India and SES has ensured that it is in accordance with Indianlaws. Person resident outside India shall ensure that laws in their country arenot violated while using this factsheet; SES shall not be responsible for anysuch violation.SEBI Reg. No. INH000000016This factsheet or any portion hereof may notbe reprinted, sold, reproduced orredistributed without the written consent ofStakeholders Empowerment ServicesContact InformationStakeholders Empowerment ServicesA 202, Muktangan,Upper Govind Nagar,Malad East,Mumbai – 400 097Tel 91 22 4022 omwww.sesgovernance.comResearch Analyst: Pallavi GawkarAll disputes subject to jurisdiction of High Court of Bombay, Mumbai.Stakeholders’ Education Corporate Governance Research Corporate Governance Score Proxy Advisory8 PAGE
Alchemist Limited is a holding company, which is involved in agri, pharma and steel business. The Company's segments include Agri Business, including floriculture and steel, and Pharma, Chemical & Minerals, including the manufacturing and trading. Its portfolio covers therapy areas, such as immune enhancer, antibacterial, gastrointestinal, pain .