Transcription
SubSurface Surveys& Associates, Inc.An Applied Geophysical Company2075 Corte Del Nogal, Suite WCarlsbad, California 92011Office: (760) 476-0492Fax: (760) 476-0493Geophysical Methods & ApplicationsSubSurface Surveys & Associates, Inc., established in 1988, specializes in nearsurface geophysics and utility locating services and is dedicated to establishingstrong client relationships. SubSurface Survey’s extensive education and experiencein implementing state-of-the-art techniques allows for a more comprehensiveapproach to solving complex problems through cost-effective means.Subsurface Surveys & Associates, s.com
Subsurface Surveys, an applied geophysics company, uses a variety of geophysical methods to solveengineering, geological, environmental and forensic problems. The methods and instruments we use arechosen to meet the specific needs of our clients and accommodate the existing field conditions.Geophysical Areas Covered Range of Projects Seismic RefractionSeismic ReflectionSeismic Downhole and Crosshole SurveysMicroearthquakesGravityMagneticsGround Penetrating Radar (GPR)DC Resistivity Depth Sounding & ProfilingElectromagnetic Induction (EM)Very Low Frequency (VLF)Spontaneous Potential (SP)Tellurics, Dipole-Dipole & other ElectricalMethodsGround Motion MonitoringSeismic Resonance ProfilingResource ExplorationWater Projects & Well SitingLandfill ImagingTank & Utility Location & IdentificationWell LoggingConstruction SitingFault and Geologic Hazards InvestigationsArcheological Field StudiesForensic InvestigationsLegal ApplicationsMaterials Properties & Site Response SpectraAbandoned Well LocatingSpill and Plume MappingVoid DetectionPlanning and ReviewDownhole SurveysGround Motion MonitoringBackground: SubSurface Surveys & Associates, Inc., an applied geophysical firm, was established inDecember of 2004 through the acquisition of SubSurface Surveys. SubSurface Surveys was founded in 1988,by Dr. Gary Crosby, PhD, GP, and RG, who still continues to provide leadership and guidance to theeveryday operations of the company. We are a privately owned small business specializing in geophysical dataacquisition, processing, and interpretation in terms of real world geology.Experience: Dr. Gary Crosby along with Phil Walen, our principal geophysicist and Leopold Mairesse, oursenior geophysicist at SubSurface Surveys and Associates, Inc. has a combined 110 years of experience ingeophysical applications. The company has extensive experience in shallow exploratory geophysics, such asfault and geologic hazards investigations, tank and utility detection, water projects and well sightings, blast andvibration monitoring, archeological investigations, spill and plume mapping, forensic investigations, bedrockrippability, ordnance locations, and landfill mapping.The following pages contain a brief description of most of the methods and instruments we use.2Subsurface Surveys & Associates, s.com
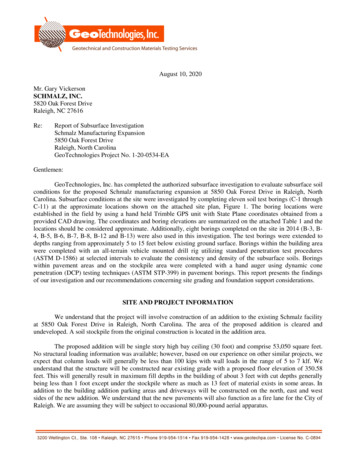
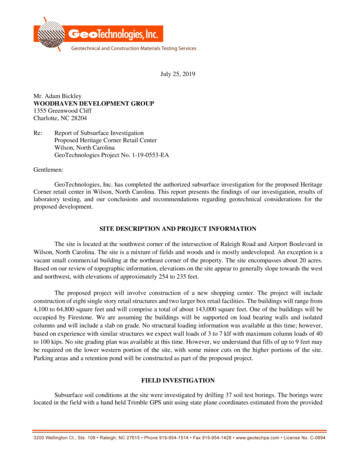
ELECTROMAGNETIC METHODSIntroduction:Electromagnetic induction (EM), as the name implies, uses the principleof induction to measure the electrical conductivity of the subsurface.Unlike conventional resistivity techniques, no ground contact is required.This eliminates direct electrical coupling problems and allows much morerapid data acquisition. Because EM instruments provide rapid and easydata collection, they are often employed as the reconnaissance tools, usedto identify anomalies for greater detailing. There are two categories forwhich electromagnetic field, and time domain measures decay time of anelectromagnetic pulse induced by a transmitter.EM techniques are particularly useful in: Locating buried metal objects (drums,USTs, utilities, etc.) Delineating contamination plumes Map soil salinity and salt water intrusion Defining lateral changes in lithology Locating cavities (old mine tunnels) Locating water producing fractures Investigating Landfills Detecting UXO Gathering of forensic evidenceFrequency Domain Meters:A sinusoidally varying magnetic field electromagnetically induces currentsin the ground in such a manner that their amplitude is linearly proportional to the terrain conductivity. The magnitude of thesecurrents is determined by measuring the magnetic field which they in turngenerate. For shallow profiling (up to 20 feet), a Geonics, Inc. EM-31 TerrainConductivity meter is used. One person can collect as many as 10,000 datapoints per day with this instrument.An EM-34 is used for depths of investigation between 30 and 180 feet. Thisinstrument requires two people to operate, and up to 500 data points per daycan be collected under good conditions.These tools are extremely sensitive and accurate, capable of detectingvariations in conductivity of as little as 3%. Data are automatically stored inan electronic data logger for later interpretation when transferred to acomputer.Photograph of EM-31Time Domain Meters:Time domain meters consist of a powerful transmitter and receiver. The transmitter generates a primary magnetic field, whichinduces eddy currents immediately below the transmitter loop. The receiver then measures the decay of the eddy currentsduring the transmitter’s off cycle. The strength of the field is directly proportional to the average conductivity of thesubsurface materials. The system can sound the depth, thickness and conductivity of layers down to 300 m below surface. Forapplications such as mapping the thickness of aquifers, clay layers and assessing water quality.Metal Detectors:The EM-61 instrument is a high resolution, time-domain device for detectingburied conductive objects. It consists of a powerful transmitter that generatesa pulsed primary magnetic fild when its coils are energized, which induceseddy currents in nearby conductive objects. The decay of the eddy currents,following the input pulse, is measured by the coils, which in turn serve asreceiver coils. The decay rate is measured for two coils, mountedconcentrically, one above the other. By making the measurements at arelatively long time interval (measured in milliseconds) after termination ofthe primary pulse, the response is nearly independent of the electricalconductivity of the ground. Thus, the instrument is a super-sensitive metaldetector. Due to its unique coil arrangement, the response curve is a singlePhotograph of EM-61well defined positive peak directly over a buried conductive object. Thisfacilitates quick and accurate location of targets. Conductive objects, to a depth of approximately 10 feet can be detected.3Subsurface Surveys & Associates, s.com
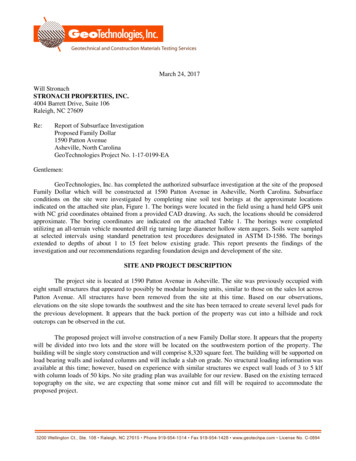
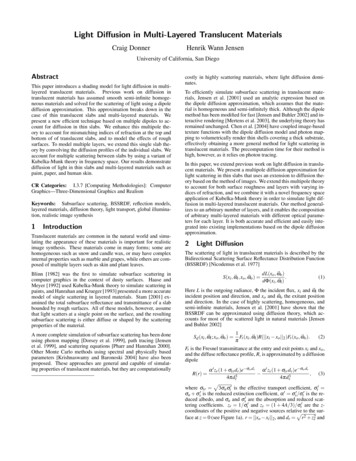
GROUND PENETRATING RADAR METHODSIntroduction:Ground Penetrating Radar (GPR) is used to pinpoint the location of buriedobjects and to map out stratigraphy. It provides a cross-sectionalmeasurement of the shallow subsurface and unlike conventional metaldetectors, radar can locate both metal and nonmetal objects.The data is collected along profiles and the results can be displayed in realtime with an attached computer display unit. This leads to easy and fastinterpretation in the field. Further interpretation of the data can beperformed later back in the office if needed.Radar Applications Include: Locating buried tanks and drums Locating underground utilities Map landfill boundaries Delineate pits and trenches containingmetallic and nonmetallic debris Delineate previously excavated andbackfilled areas Mapping voids beneath pavement and/orbehind retaining walls Measuring pavement thickness Three dimensional rebar mapping Locating clandestine grave sites Archeological investigating Map shallow groundwater tables Map shallow soil stratigraphy Map shallow bedrock topographyBrief Explanation:The GPR instrument beams energy into the ground from itstransducer/antenna in the form of electromagnetic waves. A portion ofthis energy is reflected back to the antenna at any boundary in thesubsurface, across which there exists an electrical contrast. The recordercontinuously records an image of the reflected energy as the antenna is traversed across theground surface. The EM wave travels at a velocity unique to the material properties of theground being investigated and when these velocities are known, or closely estimated fromground conductivity values and other information, two-way travel times can be converted todepth measurements. Penetration into the ground and resolution of the image produced area function of ground electric conductivity and dielectric constant.Radar Frequencies:The objective of the survey will dictate the antenna’s frequency that will by used. Higherfrequency antennae produce the highest resolution data at the sacrifice of penetration depth(i.e. a 900MHz antenna would be used for locating rebar or post-tension cables withinconcrete and a 500MHz antenna would be used for locating utilities or USTs). SubSurfaceSurveys commonly uses frequencies of 300MHz, 500MHz, and 900MHz, with otherfrequencies available if needed. The higher the frequency of the antenna results in higherresolution of the subsurface.Sensors and SoftwareNoggin GPR w/ 500MHzRadar image produced with the Sensors and Software Noggin and a 500 MHz antennaLimitations:As stated earlier, the penetration of the radar signal is a function of ground electric conductivity and dielectric constant.Simply stated, the higher the conductivity the lower the penetration depth. For example, the penetration through dry sandysoils will be much greater than through wet clayey soils, the latter being only two feet in some cases.4Subsurface Surveys & Associates, s.com
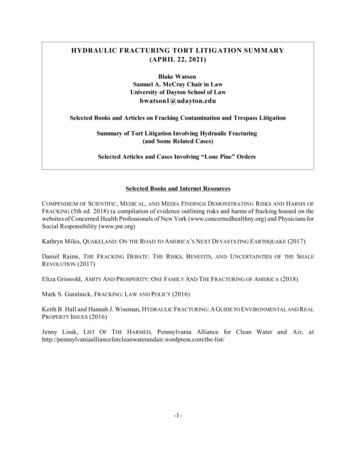
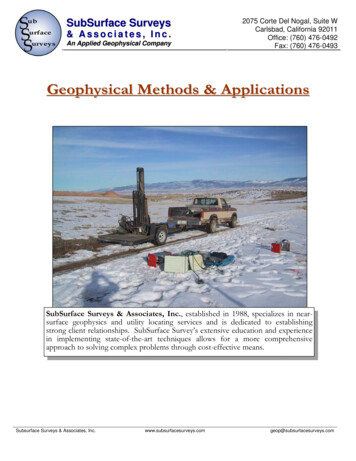
MAGNETIC METHODSBrief Explanation:This is an efficient and effective method to survey large areas forunderground iron and steel objects such as tanks and barrels. Magneticmeasurement of the Earth’s total magnetic field and local magnetic gradientsare usually made with proton precession magnetometers at points along a linewhich should be oriented at a high angle to the suspected trend of structures.For local surveys, the Earth’s ambient field may be considered uniform.Local geological and cultural magnetic materials will then express theirdistribution by local perturbations in the Earth’s field. In general,sedimentary rocks are non-magnetic while igneous and metamorphic rocksare magnetic.Instruments:Geometrics 856 – The proton precession magnetometer utilizes theprecession of spinning protons or nuclei of the hydrogen atom in asample of hydrocarbon fluid to measure the total magnetic intensity. Thespinning protons in a sample of water, kerosene, alchohol, etc, behave assmall, spinning magnetic dipoles. These magnets are temporarily aligned,or polarized, by application of a uniform magnetic field generated by acurrent in a coil of wire. When the current is removed, the spin of theprotons causes them to precess about the direction of the ambient, or theearth’s magnetic field. This is similar to how a spinning top precessesabout the gravity field. The precession protons then generate a smallsignal in the same coil used to polarize them, a signal whose frequency isprecisely proportional to the total magnetic field intensity andindependent of the orientation of the coil (sensor of the magnetometer).Magnetic surveys are useful in: Locating buried drums, tanks, and othermetal objects Finding abandoned wells Mapping geologic structures Locating utilities Investigating landfills Gathering of forensic evidencePhotograph of Geometrics 856 magnetometerSchonstedt GA-52 – The magnetic gradiometer has two flux gatemagnetic fixed sensors that are passed closely to and over theground. When not in close proximity to a magnetic object, that is,only in the earth’s field, the instrument emits a sound signal at a lowfrequency. When the instrument passes over a buried iron or steelobject, so that locally there is a high magnetic gradient, thefrequency of the emitted sound increases. The frequency is afunction of the gradient between the two sensors.Contoured data collected with a Geometrics 856magnetometer showing an oil wellhead.5Subsurface Surveys & Associates, s.com
SEISMIC METHODSIntroduction:Seismic techniques are commonly used to determine site geology,stratigraphy, and rock quality.These techniques provide detailedinformation about subsurface layering and rock geomechanical propertiesusing seismic acoustical waves. Reflection and Refraction are the mostcommonly used seismic techniques. These methods determine geologicalstructure and rock velocities by either refracting or reflecting waves offboundaries between rock units with different seismic velocities orimpedance.Seismic Refraction:Seismic refraction investigates the subsurface by generating arrival timeand offset distance information to determine the path and velocity of theelastic disturbance in the ground. The disturbance is created by shot,hammer, weight drop, or some other comparable method for puttingimpulsive energy into the ground. Detectors, laid out at regular intervals,measure the first arrival of the energy and its time. The data are plottedin time – distance graphs from which the velocities of the differentlayers, and their depths can be calculated. This sis possible because rays( a continuum points on the expanding wave front) of the disturbancewave follow a direct route and is the first arrival energy at the close-ingeophones. The rays are refracted across layer boundaries where there isa difference in elastics and density properties. The critically refracted raytravels along the layer interface, at the speed of the lower layer, andcontinuously “feeds” energy back to the surface, to be successfullydetected by the line of geophones. At some distance the refracted raybecomes the first arrival.Shot energy is normally collected at evenly spacedintervals throughout the entire length of the line inorder to increase coverage and generally determinewhether or not the layering is horizontal, dipping orundulating. The acquired data are computationallyintense. A ray-tracing computer program is used toiteratively honor all traveltimes and velocities, and tobe able to consider a large number of layers where theyare present. A first energy arrival picking program,with such features as zoom, filtering, time stretching,separation of traces, AGC and balancing of traces, isalso applied.Seismic Applications Include: General geologic structure Faults and other hazards Landfill investigations Overburden thickness Rock rippability and quality Water table depth Bedrock depth Dynamic rock moduli Vibration loading response Rock velocities and quality Geologic layeringPhotograph of a seismic refraction surveySeismic refraction tomogram of a salt diapir in central Utah.Hot colors correspond to higher velocities, i.e., salt. Cool colorsdelineate shale.6Subsurface Surveys & Associates, s.com
Seismic Reflection:Seismic Reflection follows the law of mirror images – angle of reflectionfrom a surface is equal to the angle of incidence. Shots are fired, in turn,at each of the geophone positions and active geophones are progressivelyadded ahead of the shots, and taken up from behind the shots, in a rollalong fashion. At each subsurface boundary, across which the elastic anddensity parameters differ, a percentage of the energy in the wave isreflected back to the surface where it is recorded. If a particular boundaryis horizontal, the reflection point will be half way between the shot andany given geophone. Reflecting boundaries are mapped out as the systemrolls along. Placing each reflection point in its proper place in thesubsurface requires intense and complicated processing of the collectedinformation.Seismic reflection plot of the Wasatch Fault innorthern Utah. Indicated is the main normalfault and an associated antithetic fault.Borehole Seismic Surveys:This kind of survey measures geological boundaries and rock velocities in the vicinity of boreholes. Compression and shearwaves are transmitted from a source on the surface to a receiver in the adjacent borehole (Down-hole Survey) or from a sourcelocated in another borehole (Cross-hole Survey).Down-hole Survey – A sturdy hardwood board is laid beside the wellhead,and a down-hole seismic, three – component, clamping geophone islowered into the hole. It is then clamped at intervals, commonly five feet,and at each interval the board is hammered. First it is hammered on oneof its ends and a record is made. Then the procedure is repeated at theother end. This is necessary to identify the shear wave arrival by virtue ofthe two arrivals having opposite polarity. The geophone is then lowered,incrementally, down the borehole and more measurements are done. Bythis process the compression and the shear waves’ velocities aredetermined at intervals as a function of depth in the vicinity of theborehole.Cross-hole Survey – The difference between this survey and the Downholeone is that in the Crosshole approach there are two boreholes. ADownhole refraction survey datadownhole seismometer is in one of the holes and the shear wave sourcein the other. This approach is a little more definitive for acquiringinformation on discrete layers. The information applies to a little larger volume of sediment/rock between the holes asopposed to the near vicinity of one borehole.7Subsurface Surveys & Associates, s.com
RESISTIVITYIntroduction:Resistivity contrast occurs in the subsurface between, for example, dry andResistivity surveys give insight on:water bearing sediments, differing rock lithologies and differing weathering Fault problemshistories. Using an electrical apparatus with two current electrodes, one a Water table determinationssource and the other a sink, and two potential electrodes, a depth electrical Contamination plumesprofile can be measured when the electrode spacing is progressively expanded. LithologyThe field between the electrodes is distributed only near the surface when the Landfillselectrodes spacing is close but the electrical flux flows deeper when the Tunnel/cavern mappingelectrodes are further apart. The flux will crowd into the more conductivelayers and will rarefy in the more resistive layers. The potential at the surface will reflect these path differences and willprovide a data set for which an electrical profile model of the subsurface can be calculated.Brief Description:The direct current resistivity method uses a man-made source of electricalcurrent that is injected into the earth through grounded electrodes. Theresulting potential field is measured along the ground using a second pairof electrodes. The transmitting and receiving electrode pairs are referredto as dipoles. By varying the unit length of the dipoles as well as thedistance between them, the borizontal and vertical distribution ofelectrical properties can be recorded.Resistivity is best understood if thought of as a volume or “bulkresistance” measurement. It is based on Ohm’s Law which is usuallywritten as V IR where for a linear element V is the potential differencePhotograph of a STING resistivity surveyin volts, I is the electrical current in amperes, and R is resistance in Ohms.Now, if current is passed through the opposite faces of a unit cube of earth with side length L, then its three dimensionalresistivity is R V/I (L*L)/L) which has the dimensions of ohms times length. The most common units for expressingresistivity is ohm-meters (ohm-m).The STING device operates in the samemanner as outlined above but theSTING system uses 64 electrodesinstead of 4 and it is computercontrolled. Any combination of fourelectrodes can be selected at a time andthen measurements can be made with it.The selection process can be systematicand automated so that an expandedspread and depth profile can bedetermined in all 64 electrode positions.Thus an electrical structure section canbe calculated and displayed.STING resistivity data8Subsurface Surveys & Associates, s.com
VERY LOW FREQUENCY EM (VLF)Brief Description:Governments with naval forces have established a grid of tall, high – poweredVLF surveys give insight on:transmitters, with power up to 1000 watts, that broadcast a signal field in the 15 to 28 Water bearing fractureskHz frequency range. These broadcast fields propagate thousands of miles over the Linear conductive bodiesEarth’s surface and are essentially uniform in the atmosphere. Due to their power thesignals penetrate into the ground to depths of several hundred feet. Because of thehigh material properties contrast at the ground/air interface, the signals are refracted down into the ground at steep angles.Since the Earth is relatively less homogeneous than the atmosphere, the EM flux crowds into zones of higher conductivity andrarefies in zones of higher resistivity. A VLF receiver tuned to the frequency of a VLF transmitter, traversed across the Earth’ssurface, will exhibit high signals over a conductive water-bearing fracture zone, for example, and a low strength signals over theresistive portions of the crystalline rock mass. Any linear conductive body, in addition to water – bearing fractures, can also bedetected by VLF methodology.GRAVITY METHODSBrief Description:State-of-the-art gravity meters can sense differences in the acceleration (pull) of gravityGravity applications include:to one part in one billion. Measurements taken at the Earth’s surface express the Fault problemsacceleration of gravity of the total mass of the Earth but because of their high sensitivity Ground water inventoriesthe instruments can detect mass variations in the crustal geology. For example a high Intrusive delineationsangle, basin and range type fault will have older consolidated rocks on one side and Basin studiesrelatively unconsolidated valley fill sediments on the other side of the fault. Mass isvolume x density, and there is a density contrast in the order of 0.5 gm/cc across the basin and range fault, therefore thegravity field will express the position of the fault, in the high gradient zone, between the mountain and the valley. Theamplitude of the variation from the high to the low of the gravity gradient zone is a function of the displacement on the fault.In addition to providing insights to fault problems, gravity methodology applies to any geologic problem involving massvariations.Photograph of a gravimeterGravity profile9Subsurface Surveys & Associates, s.com
GROUND MOTION MONITORING:Brief Description:Most often the objective of ground motion monitoring is to determineVibration monitoring includes:whether or not ground shaking or acoustical noise at specific locations has Instant vibration and noise informationthe potential for causing damage to structures or is not conductive for Acceleration, velocity, and displacementnearby human habitation. Normally, monitoring is accomplished by usingmeasurementsa three-component seismograph such as a Vibra-Tech Multiseis Plus. Two Frequency and wave front analysisof the motion detecting elements of the seismograph measure mutually Permanent recordshorizontal directions, transverse and longitudinal, and the third element is Spectral Analysesoriented vertically. Thus, three components of ground motion aremonitored, and from these recordings the vector sum can be calculated. Most instruments, including those used in this survey,have an air pressure measuring microphone (in decibels) for sound recording inasmuch as air waves from certain events havethe potential for causing damage to structures and discomfort for humans.The parameters measured for each seismometer component are a) peakdisplacement, b) peak particle velocity, c) peak acceleration, d) the vectorsum of the output of the three seismometer components and e) airpressure. Frequency of ground motion waves is also necessarilydetermined since higher frequencies attenuate more readily than lowerfrequencies and have less potential for damage; and for display, andanalysis procedure calculates and plots frequency against peak particlevelocity. Acoustical noise damage or discomfort is almost entirely afunction of amplitude. Standard practice gives velocities in units ofinches per second and sound in decibels (dB).Photograph of the Vibra-Tech MultiseisinstrumentThe potential for ground motion or noise to cause structural damage hasbeen determined empirically. The U.S. Bureau of Mines has determinedthe standards for the relationship of ground motion to structural damageto buildings. The Bureau of Mines acquired this responsibility owing to itsdealing in safety matters with blasting in mining operations. From literallythousands of ground motion causing events, plots of peak particle velocityvs. frequency have been carried out by the Bureau of Mines. Ageneralized line has been drawn through these plots that separate thosewhere damage occurred from those where no damage occurred. It is clearthat this determination must be empirical inasmuch as there are solid,strong but flexible structures, as there are all variations to weaklyconstructed buildings. Thus, the standard has become, and is recognizedby most states, including California, that any event that falls below thegeneralized curve is without potential for causing structural damage. It isalso generally agreed upon that noise levels over approximately 140dBcause human discomfort.A Sample Event Report monitor record10Subsurface Surveys & Associates, s.com
Subsurface Surveys & Associates, Inc. www.subsurfacesurveys.com geop@subsurfacesurveys.com 2 Subsurface Surveys, an applied geophysics company, uses a variety of geophysical methods to solve engineering, geological, environmental and forensic problems.