Transcription
European Review for Medical and Pharmacological Sciences2018; 22: 3249-3260Metabolomic changes in humanadipose tissue derived products followingnon-enzymatic microfacturingM. GARCIA-CONTRERAS1,2, F. MESSAGGIO1,2, A. J. MENDEZ1 AND C. RICORDI1,2Diabetes Research Institute, University of Miami, Miller School of Medicine, Miami, FL, USARi.Med Foundation, Palermo, Italy12Abstract. – OBJECTIVE: In this study, weevaluated the metabolomic profiling of cryopreserved Lipogems tissue products and the initial lipoaspirates before microfracturing, to determine altered metabolites that could resultfrom the non-enzymatic processing or the cryopreservation method.MATERIALS AND METHODS: Human Lipoaspirate samples (n 10) were divided in twoaliquots, of which one was non-processed andthe other was processed by Lipogems device.Non-processed lipoaspirates and Lipogems processed tissues were stored at -80 C freshfrozen (N 3 per group) or in the presence of 0.5M dimethyl sulfoxide (DMSO) (N 7 per group). Aglobal non-targeted metabolic profile on thesesamples was performed.RESULTS: Differences were observed in carbohydrate and nucleotide metabolism. Thesealterations translated in long chain and polyunsaturated fatty acid levels and amino acidmetabolites showed divergent trends. When Lipogems and Lipoaspirate tissue products werecryopreserved with DMSO, amino acids tendedto increase in Lipogems product. However,in the absence of DMSO aminoacids and theircatabolites, tended to decrease in Lipogems fat tissue product.CONCLUSIONS: Microfractured human adipose tissue has been shown to provide a moreeffective source of adult stromal cells comparedto the initial lipoaspirated tissue material. Thesecould be, according to our findings, due to thechanges in the metabolic profile of lipoaspiratetissues products.Key WordsAdipose tissue, Lipoaspirates, Non-enzymatic isolation, Metabolomic.IntroductionHuman adipose tissue it is known to be asignificant reservoir of human adipose-derivedmesenchymal stromal cells (hADSCs)1. hADSCshave a strong paracrine potential2-4, which couldfavor native tissue regeneration and repair, making them a suitable option for regenerative cellbased therapies5,6,7.Among mesenchymal stromal cell sources, lipoaspirated adipose tissue is an ideal source becauseof its relative abundance and easy access comparedto other sources8. Adipose tissue could also bebanked and then used at future times for clinical applications8,9. Cryopreservation can be done with orwithout the addition of cryoprotective agents suchas dimethyl sulphoxide (DMSO)10. To avoid someof the regulatory complexity and cost associatedwith enzymatically processed adipose tissue products and their ex-vivo expanded hADSCs, novelminimal manipulated adipose tissue products havebeen developed11,12. Mechanical methods provide alow cost, rapid and simple alternative to the use ofenzymes for adipose tissue processing. Microfragmented lipoaspirates prepared using the Lipogems system are enriched in hADSCs and pericytes13,14and have been successfully used clinically for several regenerative medicine applications15-18.In the present study, we investigated the effectof microfracturing adipose tissue from lipoaspirates and the effect of the use of DMSO in thecryopreservation procedure on the respective metabolomic profiles.Materials and MethodsEthics StatementThis study was approved by the InstitutionalReview Board (IRB) of the University of Miami.Subjects were enrolled at Top Body SculptingRejuvenation Center (Weston, FL, USA) uponprevious informed consent signature. All specimens were negative for HIV (Human Immunodeficiency Virus 1 and 2), HCV (Hepatitis C Virus),HBV (Hepatitis B Virus) and cytomegalovirus.Corresponding Author: Camillo Ricordi, MD; e-mail: CRicordi@med.miami.edu3249
M. Garcia-Contreras, F. Messaggio, A. J. Mendez and C. RicordiSample Collection and Processing10 human adipose tissue samples were obtainedfrom elective liposuction procedures under localanesthesia (Table I). Lipoaspirates were divided intwo aliquots, of which one was non-processed andthe other was processed by Lipogems device aspreviously described12 by the Lipogems system,a non-enzymatic processing method consisting ina two step tissue cluster reduction which includesan emulsification step for reduction of oil andblood residues. Non-processed lipoaspirates andLipogems processed tissues were stored at -80 Cfresh frozen (N 3 per group) or in the presenceof 0.5 M dimethyl sulfoxide (DMSO) (N 7 pergroup) in alpha-MEM supplemented with 10%fetal bovine serum (FBS).Metabolomic AnalysisMetabolite AnalysisThe untargeted metabolomics profiling of lipoaspirate and Lipogems tissues stored in the0.5M DMSO absence or fresh frozen tissues wasperformed by Metabolon (Durham, NC, USA),according to published methods19,20.Sample PreparationSamples were thawed only once and preparedusing the automated MicroLab STAR system fromHamilton Company (Reno, NV, USA). Several recovery standards were added prior to the first stepin the extraction process for quality control (QC)purposes. To remove protein, dissociate small molecules bound to protein or trapped in the precipitated protein matrix, and to recover chemicallydiverse metabolites, proteins were precipitated withmethanol under vigorous shaking for 2 min (GlenMills GenoGrinder 2000, OPS Diagnostics, NJ,Table I. Subjects Information.Sample AgeGenderDonor 1Donor 2Donor 3Donor 4Donor 5Donor 6Donor 7Donor 8Donor 9Donor FemaleFemaleFemaleFemaleFemaleFemaleHeight(ft, 132151.6234156.2251130.2120120USA) followed by centrifugation. The resultingextracted samples were dried and then reconstituted in solvents compatible to each of the followingmethods. Samples were divided into five fractions:two for analysis by two separate reverse phase (RP)/UPLC-MS/MS methods with positive ion modeelectrospray ionization (ESI), one for analysis byRP/UPLC-MS/MS with negative ion mode ESI,one for analysis by HILIC/UPLC- MS/MS withnegative ion mode ESI, and one sample was reserved for backup. Samples were placed briefly on aTurboVap (Zymark) to remove the organic solvent.The sample extracts were stored overnight undernitrogen before preparation for analysis.Ultrahigh Performance LiquidChromatography-Tandem MassSpectroscopy (UPLC-MS/MS)All methods utilized a Waters ACQUITY ultra-performance liquid chromatography (UPLC)and a Thermo Scientific Q-Exactive high resolution/accurate mass spectrometer interfaced witha heated electrospray ionization (HESI-II) sourceand Orbitrap mass analyzer operated at 35,000mass resolution. The sample extract was driedand then reconstituted in solvents compatible toeach of the four methods. Each reconstitutionsolvent contained a series of standards at fixedconcentrations to ensure injection and chromatographic consistency. One aliquot was analyzedusing acidic positive ion conditions, chromatographically optimized for more hydrophilic compounds. In this method, the extract was gradienteluted from a C18 column (Waters UPLC BEHC18- 2.1x100 mm, 1.7 µm) using water and methanol, containing 0.05% perfluoropentanoic acid(PFPA) and 0.1% formic acid (FA). Another aliquot was also analyzed using acidic positive ionconditions; however, it was chromatographicallyoptimized for more hydrophobic compounds. Inthis method, the extract was gradient eluted fromthe same afore mentioned C18 column usingmethanol, acetonitrile, water, 0.05% PFPA and0.01% FA and was operated at an overall higherorganic content. Another aliquot was analyzedusing basic negative ion optimized conditionsusing a separate dedicated C18 column. The basicextracts were gradient eluted from the columnusing methanol and water, however with 6.5mM ammonium bicarbonate at pH 8. The fourthaliquot was analyzed via negative ionization following elution from a HILIC column (WatersUPLC BEH Amide 2.1x150 mm, 1.7 µm) usinga gradient consisting of water and acetonitrile
Metabolomic changes in human adipose tissue derived products following non-enzymatic microfacturingwith 10 mM ammonium formate, pH 10.8. TheMS analysis alternated between MS and data-dependent MSn scans using dynamic exclusion.The scan range varied slighted between methodsbut covered 70-1000 m/z. Raw data files werearchived and extracted as described below.Data Extraction and CompoundIdentificationRaw data was extracted, peak-identified andQC processed using Metabolon’s hardware andsoftware. These systems are built on a web-service platform utilizing Microsofts NET technologies, which run on high-performance applicationservers and fiber-channel storage arrays in clusters to provide active failover and load-balancing.Compounds were identified by comparison to library entries of purified standards or recurrentunknown entities. Metabolon maintains a librarybased on authenticated standards that contain theretention time/index (RI), mass to charge ratio(m/z), and chromatographic data (including MS/MS spectral data) on all molecules present in thelibrary. Furthermore, biochemical identificationsare based on three criteria: retention index within anarrow RI window of the proposed identification,accurate mass match to the library 10 ppm, andthe MS/MS forward and reverse scores betweenthe experimental data and authentic standards. TheMS/MS scores are based on a comparison of theions present in the experimental spectrum to theions present in the library spectrum. Peaks werequantified using area-under-the-curve. For studiesspanning multiple days, a data normalization stepwas performed to correct variation resulting frominstrument inter-day tuning differences. Essentially, each compound was corrected in run-dayblocks by registering the medians to equal one(1.00) and normalizing each data point proportionately.Data analysisData were elaborated by using the randomforest (RF) analysis, developed by Breiman21.For a given decision tree, a random subset of thedata with identifying true class information isselected to build the tree (“bootstrap sample” or“training set”), and then the remaining data, the“out-of-bag” (OOB) variables, are passed downthe tree to obtain a class prediction for eachsample. The final classification of each sampleis determined by computing the class predictionfrequency (“votes”) for the OOB variables overthe whole forest. To determine which variables(biochemicals) make the largest contribution tothe classification, a “variable importance” measure is computed. We use the “Mean DecreaseAccuracy” (MDA) as this metric. The MDA isdetermined by randomly permuting a variable,running the observed values through the trees,and then reassessing the prediction accuracy.Principal component analysis (PCA) was performed on the 409 log-transformed metabolitesto provide a high-level overview of variation inthe dataset. Component scores were calculated byusing the standardized scoring coefficient.To visualize interaction networks and biological pathways of the significant metabolites,we utilized Cytoscape (http://cyto- scape.org), anopen source software platform22.Statistical AnalysisStatistical analysis of log-transformed datawas performed using “R” version 2.14 (http://cran.r-project.org/), which is a freely available,open-source software package.Following log transformation and imputation ofmissing values, if any, with the minimum observedvalue for each compound, Welch’s two-samplet-test was used to identify biochemicals that differed significantly between experimental groups.Multiple comparisons were accounted for by estimating the false discovery rate (FDR) usingq- values. Biochemicals were considered statistical significance when p-value 0.05 and thoseapproaching significance 0.05 p-value 0.10 wereconsidered to have trending changes.ResultsMetabolic Data overviewFollowing data acquisition and curation of a409 compounds (named biochemicals) were identified. Following log transformation and imputation of values below the level of detection, ifany, with the minimum observed value for eachcompound, Welch’s two- sample t-test was usedto identify biochemicals that differed significantly between no DMSO and DMSO groups. InLipoaspirate no DMSO vs. Lipoaspirate DMSO,the levels of 201 biochemicals were significantlydifferent between no DMSO and DMSO groups(p-value 0.05), 173 biochemicals were increasedand 28 decreased. In Lipogems no DMSO andLipogems DMSO 242 biochemicals were significantly different between no DMSO and DMSOgroups (p 0.05), 209 biochemicals were increased3251
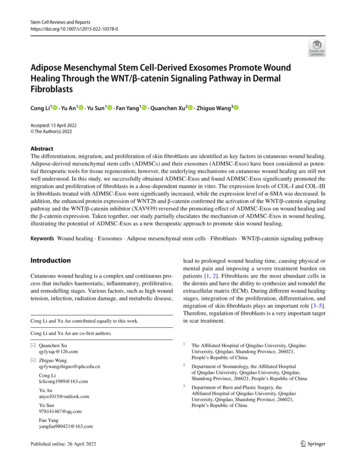
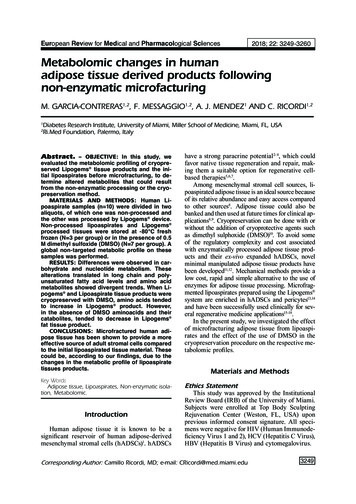
M. Garcia-Contreras, F. Messaggio, A. J. Mendez and C. RicordiTable II. Summary of biochemical alterations induced by adipose microfracturing from a total of 409 named biochemicals identified.Statistical ComparisonsWelch's Two-Sample t-TestNo DMSO Lipogems vs.DMSO Lipogems No DMSO Lipoaspirate vs.DMSO LipoaspirateTotal biochemicals p 0.05Biochemicals( )Total biochemicals 0.05 p 0.10Biochemicals( )24220133 2092928 1734015 1419 21DMSO Lipogems vsDMSO LipoaspirateNo DMSO Lipogems vs.NoDMSO Lipoaspirate24611295 151341 1112518 162 23Matched Pairs t-TestTotal biochemicals p 0.05Biochemicals( )Total biochemicals 0.05 p 0.10Biochemicals( )and 33 decreased. In addition, there were a similar number of biochemicals which demonstrateda trend (0.05 p-value 0.10) toward significancein these analyses (Table II). Matched pairs t-testwas used to identify biochemicals that differedsignificantly between Lipoaspirate and Lipogems groups. In Lipoaspirate DMSO vs. Lipogems DMSO the levels of 246 biochemicals were different between Lipoaspirate and Lipogems groups(p-value 0.05), 95 biochemicals were increasedand 151 decreased. In Lipoaspirate no DMSOvs. Lipogems no DMSO 112 biochemicals weresignificantly different between Lipoaspirate andLipogems groups (p-value 0.05), 1 biochemicalwas increased and 111 decreased. In addition,there were a similar number of biochemical, whichachieved a trend value (0.05 p-value 0.10) towardsignificance in these analyses (Table II).In the Principal Component Analysis (PCA)(which gives a value to each biochemical to showcontributions to the Component scores) (Figure 1A) Component 1 is correlated with the presence orabsence of DMSO, suggesting this was the greatestsource of variation in the dataset. Component 2separated between Lipoaspirate and Lipogems ,which may reflect differences due to the microfracturing process. In the hierarchical clusteringanalysis (HCA) (Figure 1 C), which assesses samplesimilarity, samples tended to cluster well, with thetop-level split in the dendrogram separating between DMSO and fresh frozen samples. The PCALoadings plot (Figure 1B) separates the biochemicals separating groups in the PCA. Lipids tended to3252move northward in the loadings plot, which couldsuggest enrichment in the lipoaspirate samples.Enrichment for the vascular niche (and associatedMesenchymal stem cells) may lead to loss of adipocytes from the sample, which could be consistentwith declines in lipid metabolites. However, lipidstended to move rightward in Component 1, whichcould reflect DMSO function as detergent. Severalxenobiotics and nucleotide metabolites (adenine anduridine) also showed changes associated with processing; changes in carbohydrate metabolites (e.g.,3-phosphoglycerate) were also observed.Carbohydrate MetabolismGlucose can be utilized to support a variety ofphysiological processes, including energy generation, fatty acid synthesis, protein glycosylation,and nucleotide biogenesis. Metabolomic profilingrevealed in No DMSO fresh frozen Lipogems vs. Lipoaspirate, glucose and related products(e.g., 3-phosphoglycerate, phosphoenolpyruvate)a decreased, which could suggest high demandfor use. However, the glycolytic end- products pyruvate and lactate were not significantly changed,but did show a non- significant decline. A similarphenotype was also observed in DMSO samplesLipogems vs. Lipoaspirate; however, signs ofincreased glucose availability (increases in glucose, fructose and an isobar of mannitol/sorbitol) with increases in pyruvate and lactate werealso observed, which could suggest changes inenergy demand in this comparison. NAD andrelated metabolites (e.g., 1-methylnicotinamide,
Metabolomic changes in human adipose tissue derived products following non-enzymatic microfacturingFigure 1. Statistical analysis of metabolomics results separate Lipoaspirate and Lipogems and DMSO and non-DMSO-treated samples. (A) Principal component analysis (PCA) separates the samples when plotted against the first two principal components. (B) PCA loadings plot separates the groups in the PCA (C) Hierarchical clustering analysis (HCA) separated the samplesbetween DMSO and non-DMSO-treated samples.N1-methyl-2-pyridon-5- carboxamide) decreasedin DMSO and No DMSO, Lipogems vs. Lipoaspirate comparison, consistent with increasedglycolytic use (Figure 2).Lipid MetabolismFatty acids are a critical source of energyfor mitochondrial oxidation and cellular ATPgeneration (in addition to being precursors forphospholipids and storage lipids). Long- chain(e.g., palmitate, palmitoleate, margarate) andpolyunsaturated (e.g., linoleate, linolenate) fattyacids tended to decline in Lipogems comparedto Lipoaspirate (both DMSO and Non-DMSOfresh frozen tissue), which could suggest changes in use to support energetics (or biosyntheticdemand). Long-chain fatty acids must be conjugated to carnitine for efficient transport acrossthe mitochondrial membrane; acylcarnitines also tended to decrease, though not all observedchanges achieved significance, which could suggest changes in lipid oxidation. However, theketone body 3-hydroxybutyrate (BHBA) was notsignificantly changed – curiously, ketone bodieswere not observed in No DMSO-treated samples, which could suggest DMSO altered use (oruptake/generation) of ketone bodies. Complexlipids (e.g., 1,2-dipalmitoyl-GPC), plasmalogens(e.g., 1-(1-enyl-palmitoyl)-2-oleoyl-GPE), sphingolipids (e.g., N-palmitoyl-sphinganine) and ceramides also tended to decrease in DMSO (PostPre). Subtle declines in many of these classes inNo DMSO (Lipogems vs. Lipoaspirate) did notachieve significance (which may reflect decreasedpower in these comparisons compared to DMSO-treated comparisons) (Figure 3).TCA CycleCarbon can flow into the TCA cycle from anumber of sources, including carbohydrates andlipids (via conversion of acetyl-CoA to citrate),glutamine (entering as alpha- ketoglutarate), andbranched-chain amino acids (entering as citrate andsuccinyl-CoA). Declines in citrate in No DMSOfresh frozen (Lipogems vs. Lipoaspirate) could beconsistent with increased acetyl CoA demand (orpossibly limiting input from glycolysis), with declines in malate also observed. DMSO (Lipogems vs. Lipoaspirate) did not show a similar trend;however, increases in aconitate [cis or trans] maybe consistent with declining energy demand (whichwas also reflect in glycolytic metabolites) (Figure 4).3253
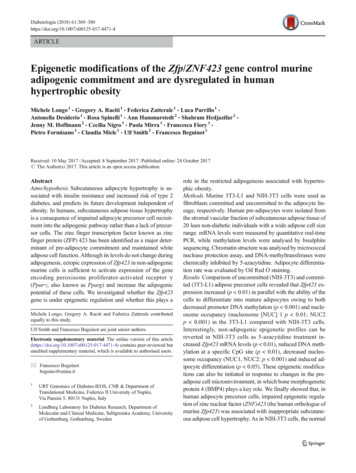
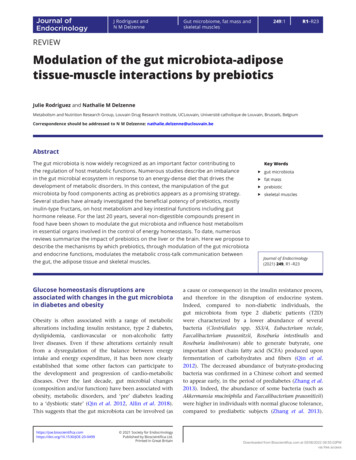
M. Garcia-Contreras, F. Messaggio, A. J. Mendez and C. RicordiFigure 2. Carbohydrate metabolism. Glycolytic use is increased in microfractured adipose tissue Lipogems samples compared to non-microfractured Lipoaspirate adipose tissue. The y-axis for glucose is plotted on a log-scale to better show population distributions in the box plot.Figure 3. Lipid metabolism. Fatty acids are decline in in microfractured adipose tissue Lipogems samples compared tonon-microfractured Lipoaspirate adipose tissue.3254
Metabolomic changes in human adipose tissue derived products following non-enzymatic microfacturingFigure 4. TCA cycle. The y-axis in citrate is plotted against a log-scale to better show population distribution.Changes in Amino AcidMetabolism/AvailabilityAmino acid metabolites tended to show divergent trends in the DMSO-treated and non- DMSOfresh frozen comparisons. In the DMSO-treatedcomparison (DMSO, Lipogems vs. Lipoaspirate), amino acids (e.g., Gly, Ser, Ala, Glu, Gln,His) and their catabolite tended to increase. However, in the non-DMSO fresh frozen comparison(No DMSO, Lipogems vs. Lipoaspirate), aminoacids and their catabolites tended to decline asa class. Changes in amino acid metabolites canreflect differences in biosynthetic demand whenconsidered together, with patterns associatedwith declining energy demand above (Table III).Bile AcidsPrimary and secondary bile acids tended toincrease as a class in DMSO (Lipogems vs.Lipoaspirate); interestingly, these biochemicalswere below the threshold of detection in non-DMSO fresh frozen samples. DMSO has been shownto increase membrane permeability, which mayaid transport of bile acids (or potentially enhanceextraction from cells during processing).Nucleotide MetabolismDeclines in purine catabolites (e.g., hypoxanthine, xanthine) could suggest changes innucleotide demand (no DMSO, Lipogems vs.Lipoaspirate); adenine was also elevated, witha non-significant increase in adenosine (and asubtle, non-significant decline in AMP), consistent with increased demand. Pyrimidine metabolites showed similar changes, with a declinein orotidine, uridine and uracil consistent withincreased demand. Declining nucleotide availability may reflect increased transcriptional use(e.g., activation of stress-responsive pathways) orproliferative demand.DiscussionMesenchymal stromal cells (MSCs) have thecapacity to differentiate in-vitro into a variety ofcell types, and have paracrine properties that canassist tissue regeneration and repair, which makethem of great interest for regenerative medicineapplications1,5.3255
M. Garcia-Contreras, F. Messaggio, A. J. Mendez and C. RicordiTable III. Amino Acids showed divergent trends. Red and green shaded cells indicate p 0.05 (red indicates that the mean valuesare significantly higher for that comparison; green values significantly lower). Light red and light green shaded cells indicate0.05 p 0.10 (light red indicates that the mean values trend higher for that comparison; light green values trend lower).PathwayBiochemicalNameDMSONo DMSOLipogemsLipogemsDMSONo DMSOLipoaspirate LipoaspirateNo DMSOLipoaspirateDMSOLipoaspirateNo DMSOLipogemsDMSOLipogemsGlycine, Serineand ThreonineMetabolismG 040.080.370.020.11Alanine ateN-acetylaspartate 4-hydroxyglutamateglutamate, gamma-methyl ntoin-5-propionic acidtrans-urocanateimidazole propionateimidazole 80.200.24Lysine ysine5-(galactosylhydroxy)-L- lysine2-aminoadipateglutarate (pentanedioate)pipecolate6-oxopiperidine-2- ne ctatephenol sulfatep-cresol 0.540.040.620.080.150.030.700.34Continued3256
Metabolomic changes in human adipose tissue derived products following non-enzymatic microfacturingTable III. Amino acids showed divergent trends. Red and green shaded cells indicate p 0.05 (red indicates that the mean valuesare significantly higher for that comparison; green values significantly lower). Light red and light green shaded cells indicate0.05 p 0.10 (light red indicates that the mean values trend higher for that comparison; light green values trend lower).PathwayBiochemicalNameDMSONo DMSOLipogemsLipogemsDMSONo DMSOLipoaspirate LipoaspirateNo DMSOLipoaspirateDMSOLipoaspirateNo phan3-indoxyl e, Isoleucineand xopentanoateisovalerylglycineisovalerylcarnitine a-hydroxyisovalerate2-methylbutyrylcarnitine natevalineisobutyrylcarnitine 0.010.060.52Methionine,Cysteine, SAMand onine sulfonemethionine eine s-sulfatecystinecysteine sulfinic rea cycle;Arginine nine*citrullinehomoarginineprolinedimethylarginine (SDMA 0.51Continued3257
M. Garcia-Contreras, F. Messaggio, A. J. Mendez and C. RicordiTable III. Amino acids showed divergent trends. Red and green shaded cells indicate p 0.05 (red indicates that the mean valuesare significantly higher for that comparison; green values significantly lower). Light red and light green shaded cells indicate0.05 p 0.10 (light red indicates that the mean values trend higher for that comparison; light green values trend lower).PathwayBiochemicalNameDMSONo DMSOLipogemsLipogemsDMSONo DMSOLipoaspirate LipoaspirateNo DMSOLipoaspirateDMSOLipoaspirateNo oacetatecreatinecreatininecreatine lutathione, reduced (GSH)glutathione, oxidized (GSSG)cysteine-glutathione 0.100.021.00Several groups have suggested that adiposetissue may be an ideal source for MSCs, thoughmethods of isolation involve extensive ex-vivoprocessing23 (e.g., enzymatic digestion and expansion), which can affect differentiation potentialand limit mulitipotency11. Recently, Lipogems International has introduced a protocol to obtainmicrofragmented adipose tissue products with intact stromal vascular niches (which may maintainhADSCs multipotency). Lipogems processing significantly reduces contaminating blood, removeslipids and other cytosolic components resultingfrom damage to the tissue during collection ofthe lipoaspirates and results in a microfracturedtissue enriched in stem cells and pericytes compared with the unprocessed lipoaspirates13,14. Thisstudy assessed lipoaspirate tissue and Lipogems microfractured adipose tissue, either exposed toDMSO for cryopreservation or fresh-frozen without DMSO, with the goal of identifying possiblemetabolomic differences between adipose tissueproducts and cryopreservation methods.Comparison of global biochemical profilesin adipose (either exposed to DMSO or not)revealed several metabolomic differences including changes in metabolites related to the aminoacid metabolism and energetics. Several commondifferences were observed in both DMSO andnon-DMSO fresh frozen samples (Lipogems vs.Lipoaspirate), including changes in carbohydrateand nucleotide metabolism. Signs of shifts towardincreasing glycolytic use may reflect enrichment3258of mesenchymal stem cells in microfractured adipose tissue Lipogems sample24,25, with patternsassociated with increasing nucleotide demandconsistent with the highly proliferative nature ofthese cells26.Amino acid metabolites, however, tended toshow divergent changes between DMSO andnon-DMSO comparisons, which could reflectchanges in cellular uptake/transport or contributions from DMSO storage solution (or a combination of both) as previously reported26,28.ConclusionsCollectively, our findings suggest that the Lipogems system modifies the metabolic profile oflipoaspirate tissues products. Further work willbe needed to determine the specific mechanismsinvolved in the observed metabolic changes associated with tissue processing. Finally, studiesassessing the “stemness” of cells exposed toDMSO could be of assistance to identify possible effects of the cryopreservation method onhADSCs differentiation potential and paracrineeffects in target tissues.AcknowledgementsThis work was funded by Lipogems Internation
Subjects were enrolled at Top Body Sculpting Rejuvenation Center (Weston, FL, USA) upon previous informed consent signature. All speci- . Donor 2 26 Female 5'3" 145 Donor 3 29 Female 5'1" 132 Donor 4 33 Female 5'0" 151.6 Donor 5 53 Female 5'5" 234 Donor 6 33 Female 5'7" 156.2 .