Transcription
Journal of the Scholarship of Teaching and Learning, Vol. 16, No. 1, February 2016, pp.1- ‐14.doi: 10.14434/josotl.v16i1.19106Validity and Reliability of Scores Obtained on Multiple-ChoiceQuestions: Why Functioning Distractors MatterSyed Haris Ali1, Patrick A. Carr2, Kenneth G. Ruit3Plausible distractors are important for accurate measurement of knowledge viamultiple-choice questions (MCQs). This study demonstrates the impact of higherdistractor functioning on validity and reliability of scores obtained on MCQs. Freeresponse (FR) and MCQ versions of a neurohistology practice exam were given to fourcohorts of Year 1 medical students. Consistently non-functioning multiple-choicedistractors ( 5% selection frequency) were replaced with those developed fromincorrect responses on FR version of the items, followed by administration of therevised MCQ version to subsequent two cohorts. Validity was assessed by comparingan index of expected MCQ difficulty with an index of observed MCQ difficulty, whilereliability was assessed via Cronbach’s alpha coefficient before and after replacementof consistently non-functioning distractors. Pre-intervention, effect size (Cohen’s d) ofthe difference between mean expected and observed MCQ difficulty indices was notedto be 0.4 – 0.59. Post-intervention, this difference reduced to 0.15 along with anincrease in Cronbach’s alpha coefficient of scores obtained on MCQ version of theexam. Through this study, we showed that multiple-choice distractors developed fromincorrect responses on free-response version of the items enhance the validity andreliability of scores obtained on MCQs.Keywords: Assessment; Psychometrics; Validity; Reliability; Medical EducationIntroductionValidity of obtained scores is necessary for an assessment instrument and is irrespective of thelevel of examinees’ education or the domain or subject under assessment. A search of theliterature on scholarship of teaching and learning reveals a plethora of studies on the topic,ranging from cultural validity of assessment (Shaw, 1997), to impact of clarity of assessment'sdesign on learners’ performance (Solano-Flores & Nelson-Barber, 2001). In medical education,the desire to yield valid assessment scores is even stronger, since learner competence hasimmediate and serious implication on patient care. Although the study presented here wasconducted in the context of undergraduate medical education, it demonstrates how the multiplechoice question, an assessment instrument prevalent in science and humanities education, can beimproved to help educator scholars make more definitive conclusions about competence oflearners and effectiveness of curricula.1Department of Internal Medicine, University of North Dakota School of Medicine and Health Sciences, Sanford Health, 801Broadway North, Fargo ND 58122-0114, syedharis.ali@med.und.edu2Department of Basic Sciences, University of North Dakota School of Medicine & Health Sciences, 501 N Columbia Rd., GrandForks ND 582023Department of Basic Sciences, University of North Dakota School of Medicine & Health Sciences, 501 N Columbia Rd., GrandForks ND Vol.16,No.1,February2016.Josotl.Indiana.edu1
Ali,Carr,andRuitValidity of Scores Obtained on Multiple-choice QuestionsValidity is defined as the extent to which scores obtained on an assessment instrument representtrue knowledge (Cook & Beckman, 2006). To assess an exam’s ability to elicit true knowledge,systematic collection of evidence of validity of assessment scores is advised (Kern et al., 2009).A source of such evidence, termed Relations to Other Variables, ascertains closeness of scoresobtained on one instrument to scores obtained on the reference instrument for assessment of thatcompetency. In regards to knowledge of basic medical sciences, questions written in FreeResponse (FR) or un-cued (UnQ) formats have served as a point of reference for questionswritten in multiple-choice question (MCQ) format, since FR or UnQ formats minimize theimpact of guessing and cueing (Haladyna & Downing, 1993; Damjanov et al., 1995). A synopsisof a few relevant studies follows.Damjanov et al. did not find any significant difference between scores on or itemdiscrimination indices between MCQ and UnQ versions of an exam and recommended un-cuedopen-ended format as an acceptable alternative to the MCQ format (Damjanov et al., 1995).Fajardo et al. compared performance on un-cued format of an exam with performance on itsMCQ and reported a lower level of performance on un-cued version of the items (Fajardo &Chan, 1993). Prihoda et al. proposed a “correction” for random guessing for scores obtained ona MCQ exam (Prihoda et al., 2006). The correction entailed a weighting formula for pointsawarded for correct answers, incorrect answers, and unanswered questions such that the expectedvalue of increase in test score due to guessing was zero. They reported that the agreementbetween scores obtained on FR version of the exam and “corrected” MCQ scores was greaterthan the “uncorrected” scores, highlighting the value of correction for guessing in validity ofscores obtained on MCQs. Newble et al. compared performance of medical students andpracticing physicians on a test of clinical knowledge written in MCQ and FR formats (Newble etal., 1979). They reported a smaller difference between mean scores obtained on the two versionsamong practicing physicians than among senior-level and junior-level students, surmising thatMCQs performance appears to overestimate examinee ability which makes them less suitable forassessment of clinical competence.The difference between performance on an item’s FR and MCQ format can be attributedto functioning distractors (Haladyna & Downing, 1993; Rodriquez, 2005). By definition, afunctioning distractor (FD) is an incorrect option selected by 5% of examinees (i.e., 5%selection frequency), and chosen by a greater number of low-performing examinees than highperforming ones, which renders a negative discriminatory ability to that distractor (Rodriguez,2005). On the other hand, a non-functioning distractor (NFD) does not possess these desirablecharacteristics. Tarrant et al. reported on the impact of eliminating a non-functioning distractorfrom 4- or 5-option MCQs and reported minimal decrease (0.3%) in mean item difficulty(Tarrant & Ware, 2010). They reported that three-option version of the items contained morefunctioning distractors despite having fewer distractors overall, and that existing distractors morediscriminatory after removal of infrequently selected distractors. A seminal study published byRodriguez consolidated the findings from dozens of previously published studies and showedthat systematically removing one non-functioning distractor from 5-option MCQs reduced theiraverage difficulty and discriminatory ability only to a mild extent (0.02 and 0.04 units,respectively), and removing two non-functioning distractors from such questions did not impactaverage item discriminatory ability (Rodriguez, 2005). The above studies show that l.16,No.1,February2016.Josotl.Indiana.edu2
Ali,Carr,andRuitfunctioning distractors offer very little in terms of validity of scores, while unnecessarilyincreasing the response time needed per MCQ.Reliability of Scores Obtained on Multiple-choice QuestionsThe concept of reliability is ingrained in Classical Test Theory, the central tenet of which is thatan examinee’s observed score (X) can be decomposed into her/his true score (T) and a randomerror component (E) (X T E) (De Champlain, 2010). True score (T) is the score obtained ifthe exam were measuring the ability of interest perfectly (i.e. with no measurement error). Areliability coefficient, which ranges from 0 (lowest) to 1 (highest), estimates of the level ofconcordance between observed and true scores of an examinee (De Champlain, 2010).The type of reliability frequently discussed in the context of MCQ is internal consistency,which is meant for exams that require a single administration to a group of examinees (Downing,2004). Internal consistency reliability assesses the correlation between scores obtained on twoparallel forms of an exam, i.e., the forms assessing the same content and on which examineeshave the same true scores and equal errors of measurement. Cronbach’s alpha is its widely-usedcoefficient; a coefficient of 0.8 or more is desired for high-stakes in-house exams (DeChamplain, 2010; Downing, 2004).It has been suggested that reliability can be improved by increasing the number of itemsgiven in an exam (Downing, 2004). Such an improvement can be estimated using the SpearmanBrown “prophecy” formula!!"# !" !"# "%&'( !" !"" !"# %𝛼 !!! (1 ), where “𝛼” is the Cronbach’s alpha coefficient and!"!# !"#! !"# "%&'“k” is the number of items in an exam (Karras, 1997). However, owing to the usually fixednumber of items given in high-stakes in-house or licensure exams, an alternate way to improvereliability is to increase the spread of scores obtained on an exam (total test variance). Anincreased distribution of scores can be obtained by eliciting a wider range of performances fromexaminees by giving a greater number of moderately difficult (difficulty index: 0.4 – 0.8) andsufficiently discriminatory (point biserial correlation 0.2) items in the exam (Hutchinson et al.,2002). McManus et al. discuss in greater detail how this approach may increase the standarddeviation, hence variance, of observed scores (McManus et al., 2003).In the study presented here, two versions (FR and MCQ) of the same neurohistologyexam were randomly distributed among six cohorts of Year 1 medical students. The evidence ofvalidity pertaining to Relations to other variables, described above, was gathered before andafter replacement of consistently non-functioning distractors with those developed from incorrectresponses on the FR version of the items. Specifically, an index of expected MCQ difficulty wascalculated (see Methods) and compared with the index of observed MCQ difficulty. Thiscomparison was based on assumptions that, 1. FR version of an item elicits true knowledge, and2. Faculty responsible for the assessment of basic science content writes reasonably plausibleMCQ distractors. The effect of distractor functioning on range of ability elicited from examineesand its impact on reliability of obtained scores was also studied.Research hypothesesResearch hypothesis of the validity part of the study was: There is no difference betweenexpected and observed MCQ difficulty indices when selection of all provided options isaccounted for in calculating the expected index. To date, no such comparisons of ,Vol.16,No.1,February2016.Josotl.Indiana.edu3
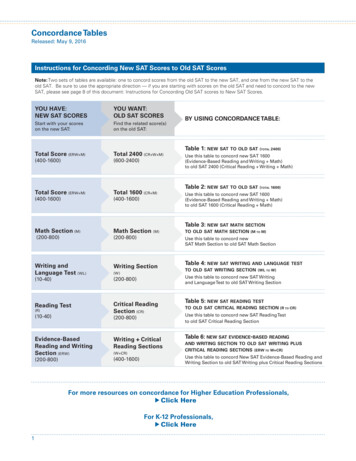
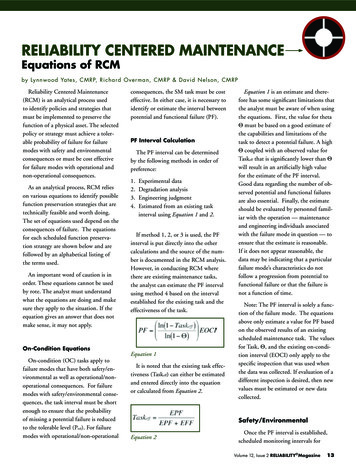
Ali,Carr,andRuitperformance on multiple-choice questions (observed difficulty index) with what it ought to havebeen (expected difficulty index) have been reported, especially in the context of assessment inundergraduate medical education, which highlights the novelty of the presented study. Researchhypothesis of the reliability part of the study was: Enhanced distractor functioning increases thestandard deviation and, therefore, reliability coefficient of scores obtained on multiple-choiceexams.Materials and MethodsResearch DesignAn experimental research design with random distribution of the free-response (FR) andmultiple-choice (MCQ) versions of an exam was employed. The study was approved andadjudged exempt from detailed review by the Institutional Review Board of University of NorthDakota.Subjects and SettingSix cohorts of Year 1 medical students at the University of North Dakota School of Medicineand Health Sciences served as subjects.The school’s medical education curriculum is a hybrid of Patient-Centered Learning(PCL) as well as traditional, discipline-based instruction. Neurohistology is taught during theneuroscience curricular block scheduled at the end of academic Year 1 via a combination oflectures and laboratory exercises by faculty with expertise in neuroscience.Sample of QuestionsA neurohistology exam comprising 25 items with a mix of knowledge (factual recall) andapplication-type questions was used. A FR (fill-in-the-blank) and a MCQ (one-best answer)version of this exam was created; the only difference between these two versions was in theformat of the asked question (example: Figure 1). Of the 25 FR-MCQ item-sets, two wereexcluded from analysis since their FR version contained options, thereby not meeting thecriterion needed for comparison with the MCQ version.Figure 1. Example of Free-Response (FR) and Multiple-Choice (MCQ) version of an du4
Ali,Carr,andRuitEach cohort of students was invited, via email, to attend a non-mandatory practice session 5 daysprior to the end-of-block neurohistology exam. No information in regards to design of the studywas shared in advance. No points were granted for participation in the study. Once seated, anapproximately equal number of free-response and multiple-choice versions of the exam printoutswere randomly distributed amongst the subjects. Then, the purpose of the study was shared, andsubjects were asked not to provide any personal or identifiable information on the answer sheets.Neurohistology images (example: Figure 1) were projected on a screen and one minute wasprovided to answer each question. After the exam, each question was discussed openly andstudents were asked not to change their answers. The answer sheets were collected, codified andscored according to pre-developed answer keys.InterventionThe following revisions were performed on the MCQ version of the exam based on examineeperformance in Cohorts 1 – 4.a. Thirty-one distractors in 15 MCQs with consistent selection frequency of 0% werereplaced with new distractors developed from frequent incorrect responses on FRversion of the items.b. Five 5-option MCQs were converted to 4-option MCQs via removal of a distractorwith consistently 0% selection frequency. The number of 5-, 4- and 3-option MCQsin the original (unrevised) version was 21, 1 and 1, respectively; these numbers were16, 6 and 1 in the revised MCQ version of the exam.In order to note the extent of distractor functioning from a bigger sample of subjects, therevised MCQ version of the exam was given to all subjects in Cohort 5. In Cohort 6, the revisedMCQ version was given to random half of subjects while the other half received the FR versionof the exam.Data Collection and AnalysisThe following variables were calculated from student performance:a. Individual, as well as mean and standard deviation of scores in each cohort.b. Psychometric characteristics, i.e. the difficulty and discriminatory ability of eachitem. Difficulty was calculated via difficulty index (number of correct answers /number of all answers), while discriminatory ability was calculated via point biserial(item-total) correlation (Tavakol & Dennick, 2011).b. The index of expected MCQ difficulty was calculated as follows. Suppose the FRversion of an item is correctly answered by 60% examinees (FR difficulty index: 0.6).The proportion of examinees with an incorrect answer on the FR version would be40% (0.4). Now suppose that the MCQ version of this item contains 5 options. Itwill be anticipated that a certain proportion of examinees who answered the itemincorrectly on its FR version might have chosen the correct MCQ option, usingrandom or educated guessing, had they taken the MCQ version of the exam.Probability would suggest that such a proportion among 40% (0.4) examinees wouldbe at least 8% (0.08) (0.4 / 5 0.08). This proportion of examinees (0.08) can beadded to the FR difficulty index to generate the index of expected MCQ difficulty(0.6 0.08 0.68) (Table l.16,No.1,February2016.Josotl.Indiana.edu5
Ali,Carr,andRuitTable 1. Calculation of expected MCQ difficulty indexMCQID# of totaloptionsFR versiondifficulty (FRdiff.)Proportion of studentswith incorrect answerson FR version (Pw)Expected inflation in itemease (EI) (Pw / # of totaloptions in the MCQversion)Expected MCQdifficulty (FRdiff. EI)Example50.601 – 0.60 0.400.40 / 5 0.080.60 0.08 0.68c. Effect size [Cohen’s d] of the difference between mean expected and observed MCQdifficulty indices. Effect size represents the extent to which research hypothesis isconsidered to be true, or the degree to which findings of an experiment have practicalsignificance in the study population regardless of the size of the study sample (Hojat& Xu, 2004). Cohen’s d is a statistic that is equal to the difference between means ofexperimental (Me) and control (Mc) groups divided by the standard deviation for the!" – !"control group (σc) (Cohen’s d !! ) (Hojat & Xu, 2004).e. Number of MCQ distractors with 5%, 10%, 20%, and 33% selection frequencyin each cohort.f. Cronbach’s alpha coefficient of scores, before and after revision, on MCQ version ofthe exam.g. Standard Error of Measurement (SEM SD 1 𝑟𝑒𝑙𝑖𝑎𝑏𝑖𝑙𝑖𝑡𝑦), which is the standarddeviation of an examinee’s observed score, given her true score (Karras, 1997). SEMdescribes precision of measurement and is used to establish a confidence intervalwithin which an examinee’s true score is expected to fall4.Exam performance data from all cohorts were stored in Microsoft Excel (2010) andanalyzed via MS-Excel and SigmaStat v. 20.ResultsTable 2 displays the number of students taking the FR and MCQ versions of the exam, scoremeans and their standard deviations, mean item difficulty indices and mean point biserialcorrelations. As expected, scores on FR version tended to be lower in all cohorts than scores onMCQ version of the exam. Moreover, the revised MCQ version (Cohorts 5 and 6) exhibitedgreater difficulty and discriminatory ability than the original MCQ version (Cohorts 1 – 4) of theexam.Table 2. Number of students taking the Free-Response (FR) and Multiple-Choice (MCQ) versions of theexam in all cohorts. Mean score, standard deviation, mean item difficulty (diff.) and mean point biserialcorrelations (pbi) are also displayed.CohortCohort 1Cohort 2Cohort 3Cohort 4Cohort 65MCQFRMCQFRMCQFRMCQFRMCQFRMCQ(only)# of students28312731302328277134334Standard Error of Measurement is not to be confused with another commonly used statistic Standard Error of the Mean (a.k.a.Standard Error), which is standard deviation of the sample mean's estimate of a population mean (Harvill, ,Vol.16,No.1,February2016.Josotl.Indiana.edu6
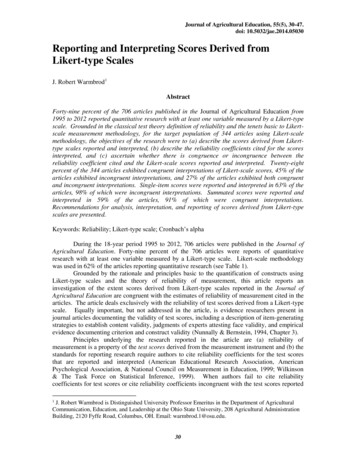
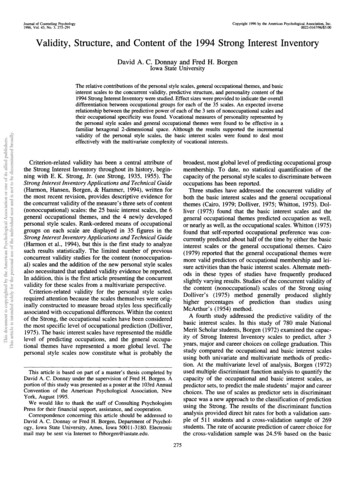
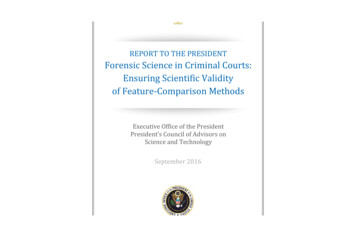
Ali,Carr,andRuitMean scoreStandard deviationMean item diff.Mean 740.3815.653.370.680.3418.243.610.790.39Table 3 and Figure 2 display Effect Size (Cohen’s d) of the difference between meanexpected and observed MCQ difficulty indices before (Cohorts 1 – 4) and after (Cohort 6)replacement of previously non-functioning distractors; Cohen’s d could not be calculated forCohort 5, since all subjects in that cohort received the revised MCQ version of the exam.Considerable increase in MCQ difficulty was noted after replacement of consistently nonfunctioning distractors (Cohorts 5 and 6), with a concomitant reduction in disparity betweenmean expected and observed MCQ difficulty indices (Cohort 6) (d 0.15).Table 3. Mean Free-Response (FR) and Multiple-Choice (MCQ) difficulty indices and their StandardDeviations (SD) in all cohorts. Effect size (Cohen’s d) of the difference b/w Mean Observed and ExpectedMCQ difficulty indices is also displayed.Cohort 1Cohort 2Cohort 3Cohort 4Cohort 5Cohort 6Mean FR diff. index0.7 (0.20)0.67 (0.25)0.64 (0.23)0.69 (0.18)0.68 (0.22)(SD)Mean Expected MCQ0.78 (0.15)0.76 (0.19)0.74 (0.17)0.77 (0.14)0.76 (0.16)diff. index (SD)Mean Observed MCQ0.85 (0.13)0.83 (0.17)0.82 (0.19)0.85 (0.14)0.74 (0.16) 0.79 (0.16)diff. index (SD)Cohen’s d of thedifference b/w Mean0.460.400.460.590.15Observed and ExpectedMCQ difficulty indicesFigure 2. Effect size of the difference between mean expected and observed MCQ difficulty indices.Table 4 and Figure 3 display the number of distractors with 5%, 10%, 20%, and 33% selection frequency in MCQ version of the exam before (Cohorts 1 – 4) and after (Cohorts5 and 6) replacement of consistently non-functioning distractors. Table 4 also displays thenumber of total as well as functioning ( 5% selection frequency) distractors per MCQ. Bothhigher distractor selection in most categories and a greater number of functioning distractors perMCQ was noted after replacement of consistently non-functioning distractors (Cohorts 5 and l.16,No.1,February2016.Josotl.Indiana.edu7
Ali,Carr,andRuitTable 4. Number of distractors with 5%, 10%, 20% and 33% selection frequency in each cohort.Number of total and functioning ( 5% sel. freq.) distractors per MCQ is also displayed.Cohort 1Cohort 2Cohort 3Cohort 4Cohort 5Cohort 6# of total distractors898989898484 5% sel. freq.24 (26.97%) 22 (24.72%) 21 (23.60%) 20 (22.47%) 38 (45.24%)23 (27.38%) 10% sel. freq.6 (6.74%)13 (14.61%) 11 (12.36%) 12 (13.48%) 21 (25.00%)14 (16.67%) 20% sel. freq.2 (2.25%)5 (5.62%)6 (6.74%)4 (4.49%)5 (5.95%)7 (8.33%) 33% sel. freq.0.00%1 (1.12%)5 (5.62%)0.00%0.00%3 (3.57%)# of distractors per3.873.873.873.873.843.84MCQ# of functioning1.040.960.910.871.651.00distractors per MCQFigure 3. Percentage of MCQ distractors with different selection frequencies.Table 5 and Figure 4 display the reliability coefficients (Cronbach’s alpha) and StandardErrors of Measurement (SEM) of scores obtained on FR and MCQ versions of the exam. Afterreplacement of previously non-functioning distractors (Cohorts 5 and 6), scores obtained on theMCQ version of the exam exhibited greater standard deviation (3.61), higher Cronbach’s alphacoefficient (0.74 and 0.78) and a slightly higher Standard Error of Measurement (1.84 and 1.66).Figure 4 demonstrates the directly proportional relationship between standard deviation andreliability coefficient of exam scores. A peculiar finding was high standard deviation andreliability coefficient of scores on MCQ version of the exam in Cohort 1. This is an interestingfinding, since examinees in that cohort had received the unrevised MCQ version of the exam.See Discussion for a possible explanation of this finding.Table 5. Mean score, Standard Deviation (SD), reliability coefficient (Cronbach’s alpha) and Standard Errorof Measurement (SEM) on FR and MCQ versions of the exam in all cohorts.Cohort 1# ofCohort 2Cohort 3Cohort Vol.16,No.1,February2016.Josotl.Indiana.eduCohort 6FRMCQ34338
�s .0415.6518.243.159 – 233.348 – 234.164 – 212.5212 – 233.695 – 212.1114 – 234.344 – 222.4813 – 233.617 – 233.377 – 223.619 – 1.491.751.561.911.591.881.491.841.871.66Figure 4. Standard deviation and reliability coefficient (Cronbach's alpha) of scores obtained on MCQversion of the exam.DiscussionThe first observation, in line with previously published studies (Ward, 1982; Norman et al.,1987; Schuwirth, 1996; Norman, 1988), was that performance on FR version of an exam isconsistently lower than performance on its MCQ version (Table 1). Since FR and MCQ versionswere randomly distributed in each cohort, the consistently disparate performance is attributableto the nature of the two versions; the MCQ version contains options and allows for some degreeof cueing and correct guessing, while the FR version requires production of an answerspontaneously from memory.Secondly, the difficulty of a MCQ-based exam is lower than expected when the numberof distractors with sufficient plausibility ( 5%, 10%, 20% and 33% selection frequencies) islow. Tables 3 and 4 highlight this finding. Effect size of the difference between mean expectedand observed MCQ difficulty indices was found to be higher in cohorts with lower overalldistractor functioning (Cohorts 1 – 4). However, when consistently non-functioning distractorswere replaced with those developed from frequent incorrect answers on FR version of the items(Cohorts 5 and 6), a higher overall distractor functioning and reduced disparity between meanexpected and observed MCQ difficulty indices was noted. In other words, when incorrectresponses on FR versions of the items are used to construct MCQ distractors, the MCQs tend todemonstrate their expected difficulty thereby enhancing the evidence of validity of ,Vol.16,No.1,February2016.Josotl.Indiana.edu9
Ali,Carr,andRuitobtained on them. This argument is strengthened by previously published reports that MCQdifficulty is contingent upon quality, not quantity, of its distractors (Tarrant & Ware, 2010;Schuwirth et al., 1996). Therefore, we surmise that careful creation and selection of distractorsis vital for reducing the much-dreaded cueing effect and amelioration of quality of MCQ testing.Unlike a previously-published study which demonstrated enhanced validity of scoresobtained on MCQs via post-hoc correction for guessing (Prihoda, 2006), the study presented hereused an active intervention in the form of replacement of consistently non-functioning distractorswith more plausible, functioning ones. We used incorrect responses on FR version of the itemsin their previous no-stakes administration, which is an approach yet to be reported in educationalresearch in medicine and other sciences, which highlights the novelty of the presented study.Thirdly, replacement of consistently non-functioning distractors led to an increase inaverage discriminatory ability of MCQs. Table 2 highlights this finding; average point biserialcorrelations were found to range between 0.25 – 0.40 before revision of the MCQ version of theexam (Cohorts 1 – 4). After the revision, point biserial correlations of 0.38 (Cohort 5) and 0.39(Cohort 6) were noted, which are considerably higher than those in the previous three cohorts.This increase in discriminatory ability occurred in the setting of increased selection, i.e.functioning, of MCQ distractors (Table 4, Figure 3) and affirms the notion that plausibledistractors gauge conceptual misunderstandings more accurately, allowing clearer separation oflow- and high-ability examinees.Fourthly, increased distractor functioning enhances the reliability coefficient of scoresobtained on MCQs (Table 5). After replacement of consistently non-functioning distractors(Cohorts 5 and 6), performance on the MCQ version of the exam exhibited a lower mean, greaterrange, and higher standard deviation of scores. Owing to the directly proportional relationshipbetween standard deviation and the reliability coefficient (Karras, 1997), the higher standarddeviation led to an increase in the reliability of scores as well. This finding highlights the effectof enhanced distractor functioning on spread (standard deviation) of scores and, consequently, onthe reliability coefficient of scores obtained on an exam.Looking at the data presented in Table 5, a noteworthy finding is the relatively higherstandard deviation (3.34) and reliability coefficient (0.84) on MCQ version of the exam inCohort 1. These values are higher than other cohorts that also took the original (unrevised)MCQ version of the exam (Cohorts 2 – 4). Scores obtained on the MCQ version of the exam inCohorts 1 – 4 were weakly valid as evidenced from a relatively higher effect size of thedifference between expected and observed MCQ difficulty indices (Table 2). Therefore, a higherreliability coefficient in Cohort 1 was puzzling to us. However, a closer look at range of scoresexplains this finding. While maximum score on the MCQ version of the exam was the sameacross Cohorts 1 – 4, a minimum score of 8 was observed in Cohort 1, while it was 12, 14 and 13in Cohorts 2, 3 and 4, respectively. This shows that, for some reason, there were some very lowperforming examinees in Cohort 1 who took the MCQ version of the exam. Theiruncharacteristically lower performance increased the score range, the standard deviation, and,consequently, the reliability coefficient of scores on MCQ version of the exam, owing to thedirectly proportional relationship between standard deviation and the reliability coefficient(Karras, 1997).Another peculiar finding was a slight increase in the standard error of measurement(SEM) on the MCQ version of the exam after replacement of consistently non-functioningdistractors (Cohorts 5 and 6) (Table 5). The explanation for this finding is the directlyproportional relationship between standard deviation (SD) and standard error of 0
Ali,Carr,andRuit(SEM) (SEM SD 1 𝑟𝑒𝑙𝑖𝑎𝑏𝑖𝑙𝑖𝑡𝑦 ) (Hutchinson et al., 2002; Harvill, 1991), since increasedrange of ability (standard deviation) elicited by an exam increases not only the reliabilitycoefficient but also the error of measurement of assessment instrument. This theory has beenreported on by Tighe et al., who studied the interrelationships among standard deviation,Standard Error of Measurement and exam reliability via a Monte Carlo simulation of 10,000candidates taking a postgraduate exam (Tighe et al., 2010). They found that scores obtained onthe very same exam experienced a decrease in reliability coefficient when retaken by only thoseexaminees who had already passed it. In other words, allowing very weak (unprepared)candidates to take an e
adjudged exempt from detailed review by the Institutional Review Board of University of North Dakota. Subjects and Setting Six cohorts of Year 1 medical students at the University of North Dakota School of Medicine and Health Sciences served as subjects. The school’s medical educ