Transcription
Manufacturing Cost and Installed PriceAnalysis of Stationary Fuel Cell Systems30 September 2015By:Brian D. JamesDaniel A. DeSantisRevision 31
Sponsorship and AcknowledgementsThis research was conducted under Subcontract Number AGB-0-40628-01 and AGB-0-40628-03 to theNational Renewable Energy Laboratory1 (NREL) under Prime Contract Number DE-AC36-08GO28308 tothe US Department of Energy.The authors wish to thank Dr. Bryan Pivovar of NREL and Mr. Jason Marcinkoski of DOE’s Office ofEnergy Efficiency and Renewable Energy (EERE), Fuel Cell Technologies Office (FCTO) for their technicaland programmatic contributions and leadership.Authors Contact InformationStrategic Analysis Inc. may be contacted at:Strategic Analysis Inc.4075 Wilson Blvd, Suite 200Arlington VA 22203(703) 527-5410www.sainc.comThe authors may be contacted at:Brian D. James, BJames@sainc.com (703) 778-7114Document RevisionsRev 1September 2015Original documentRev 2October 2015Minor formatting correctionsRev 3August 2016Correction of installation costs as applied to all three fuel celltechnologies1Actual subcontract is with the Alliance for Sustainable Energy, LLC which is the management and operatingcontractor for NREL.2
Table of TMCFCMCOMEAMPPTNiONi-CoNLBNm3NREalternating currentautomatic transfer switchbeginning of lifebill of materialbalance of plantcustomer critical busCeramic Fuel Cells Limited (of Australia)carbon monoxidecentral processing unitdirect currentDesign for Manufacturing and Assemblyde-ionizingUS Department of Energyend of lifeelectrically resistive load bankexpanded polytetrafluoroethyleneelectrical subsystem configurationfuel cellfuel cell systemfuel processorgadolinia-doped ceriagas diffusion layerhigh density polyethylenehigher heating valuehigh temperaturekilowatts of electricityload banklower heating valuelanthanum-strontium-cobalt-ferritelow temperaturemolten carbonate fuel cellmanganese cobalt oxidemembrane electrode assemblyMaximum Power Point Trackingnickel oxidenickel cobaltNo Load Banknormal cubic metersnon-recurring engineering3
ZNational Renewable Energy Laboratorynanostructured thin filmproton exchange membraneparts per million (by volume)preferential tegic Analysis, Inc.steam methane reformersolid oxide fuel cellsteam reformingtie bartungsten inert gaswater gas shiftyttrium stabilized zirconia4
Table of Contents1Executive Summary . 91.1Abstract . 91.2Summary of System Configurations and Operating Conditions . 101.3Overview of Changes to the 2012 Fuel Cell System Cost Report. 131.4Summary of System Cost and Price Results . 131.4.1System Price Comparison as a function of Manufacturing Rate . 131.4.2Breakdown of price results at subsystem level . 151.4.3Cumulative global installed capacity. 181.4.4Additional Cost Comparisons of Fuel Cell Subsystems . 191.4.5Comparison of System Installed Price between the Three FC Types . 211.4.6Primary Findings. 222 Introduction . 252.1Project Motivation . 2532.2Fuel Cell System Summary . 252.3Structure of Report . 26Analysis Methodology . 283.1System Conceptual Design . 283.2System Physical Design . 293.3Cost Modeling . 293.3.1Core System Components . 293.3.2Balance of Plant Components . 323.3.3Cost and Price Factors Included in Analysis . 323.3.4Iteration to Improve Analysis . 334 System Design, Performance, and Manufacturing Details . 344.1System Overview. 344.1.1Breakdown of Subsystems . 344.1.2Common Design and Cost Assumptions . 354.1.2.1 Power levels and Manufacturing Rates . 354.1.2.2Gross Power vs. Net Power . 354.1.2.3System Efficiency . 354.1.2.4Air Supply . 364.1.2.5Fuel and Water Supply . 364.1.2.6Desulfurization System . 374.1.2.7Fuel Processor . 374.1.2.8Stack Degradation . 405
4.1.2.94.2CHP Operation . 414.1.2.10System Housing . 424.1.2.11Grid-Dependent vs. Grid-Independent Operation . 42System Schematics . 444.2.1LT PEM. 444.2.2HT PEM . 444.2.3SOFC . 444.3Fuel Cell Subsystem . 464.3.1Fuel Cell Stack . 464.3.1.1 LT PEM Stack Parameters. 464.3.1.2HT PEM Stack Parameters . 484.3.1.3SOFC Stack Parameters . 494.3.2Fuel Cell Balance of Plant . 534.3.2.1 Common FC BOP Parts . 534.3.2.2Unique LT PEM BOP Components. 564.3.2.3Unique HT PEM BOP Components . 564.3.2.4Unique SOFC BOP Components . 564.3.3Fuel Cell Subsystem Assembly . 564.4Fuel Processor Subsystem. 564.4.1Reactor . 564.4.1.1 LT PEM. 564.4.1.2HT PEM . 574.4.1.3SOFC . 574.4.2Fuel Processor Balance of Plant . 584.4.2.1 Common FP BOP Parts . 584.4.3Fuel Processing Reactor Assembly . 595 System Performance Projections . 606 Fuel Cell System Electrical Configurations . 616.1Electrical Subsystem Framework . 61786.2ESC for Configuration 4a with fast ramping fuel cells. 656.3ESC for Configuration 4a with slow ramping fuel cells using a resistive load bank . 666.4Critical Power using Other Electrically Resistive Loads, Capacitors, or Batteries . 686.5ESC selected for cost analysis . 69Manufacturer Markup Rate (to Convert FCS Cost into FCS Price) . 70Installation Cost . 716
98.1Installation Cost Analysis Methodology . 718.2Installation Cost Result Summary . 75System Cost and Price Results . 779.1LT PEM Costs . 779.1.1LT PEM System Price Projections . 779.1.2LT PEM System Projected Price as a Function of Subsystem and Component Costs . 809.1.3LT PEM FP Subsystem Costs . 829.1.4LT PEM FC Subsystem Costs . 879.2HT PEM Costs . 899.2.1HT PEM System Costs. 899.2.2HT PEM System Projected Price as a Function of Subsystem and Component Costs . 909.2.3HT PEM FP Subsystem Costs . 939.2.4HT PEM FC Subsystem Costs . 989.3SOFC Costs . 1009.3.1SOFC System Price Projections. 1009.3.2SOFC System Projected Price as a Function of Subsystem and Component Costs . 1019.3.3SOFC FP Subsystem Results . 1039.3.4SOFC FC Subsystem Costs . 10810 Summary and Comparison of Installed FCS Price Projections . 11010.1 Summary of FCS Installed Price Projections . 11010.2Comparisons by Fuel Cell System Type . 11211 Fuel cell System Price Conclusions. 11512 Appendices of System Detailed Cost Results . 11812.1 Appendix A: Stack BOM . 11812.1.1 LT PEM Stack BOM . 11812.1.2 HT PEM Stack BOM . 11912.1.3 SOFC Stack BOM. 12012.2 Appendix B: FC BOP BOM . 12112.2.1 LT PEM FC BOP BOM . 12112.2.2 HT PEM FC BOP BOM . 12212.2.3 SOFC FC BOP BOM . 12312.3 Appendix C: FC Subsystem Summary. 12412.3.1 LT PEM FC Subsystem Summary . 12412.3.2 HT PEM FC Subsystem Summary . 12412.3.3 SOFC FC Subsystem Summary. 12512.4 Appendix D: Fuel Processing Reactor BOM . 12612.4.112.4.212.4.3LT PEM Reactor BOM . 126HT PEM Reactor BOM . 127SOFC Reactor BOM. 1287
12.5Appendix E: FP BOP BOM. 12912.5.1 LT PEM FP BOP BOM . 12912.5.2 HT PEM FP BOP BOM . 13112.5.3 SOFC FP BOP BOM . 13312.6 Appendix F: FP Subsystem Assembly . 13512.6.1 LT PEM FP Subsystem Assembly . 13512.6.2 HT PEM FP Subsystem Assembly . 13512.6.3 SOFC FP Subsystem Assembly . 13512.7 Appendix G: Power Electronics BOM . 13612.7.1 LT PEM Power Electronics BOM . 13612.7.2 HT PEM Power Electronics BOM . 13712.7.3 SOFC Power Electronics BOM . 13812.8 Appendix H: Housing and Final System Assembly . 14012.8.1 LT PEM Housing and Final System Assembly . 14012.8.2 HT PEM Housing and Final System Assembly . 14012.8.3 SOFC Housing and Final System Assembly. 14012.9 Appendix I: CHP. 14112.9.1 LT PEM CHP . 14112.9.2 HT PEM CHP . 14112.9.3 SOFC CHP. 14112.10Appendix J: Tabular Summary of Costs and Prices at the Subsystem Level . 14212.10.1 LT PEM Tabular Summary of Costs and Prices at the Subsystem Level . 14212.10.2 HT PEM Tabular Summary of Costs and Prices at the Subsystem Level . 14212.10.3 SOFC Tabular Summary of Costs and Prices at the Subsystem Level . 1428
1 Executive Summary1.1 AbstractThis report builds upon past Strategic Analysis Inc. (SA) reports to conceptually design and estimate thecapital and installation cost of stationary fuel cell systems (FCSs) based on three different fuel celltechnologies: low temperature (LT) proton exchange membrane (PEM), high temperature (HT) PEM, andsolid oxide fuel cell (SOFC). Each system is configured for operation in combined heat and power (CHP)mode to allow utilization of the system exhaust heat for building heating. Each system’s fuel cell (FC)stack, fuel processor (FP) subsystem, and balance of plant (BOP) design and performance parametersare discussed and the methods of cost-modeling each are explained. Cost trends for each FCS and itssubsystems are evaluated in terms of the capital costs per unit in dollars per kilowatt-electric ( /kWe) asa function of system installed capacity and system annual production rate. A Design for Manufacturingand Assembly (DFMA) process-based cost estimating methodology is used to derive stack and reactorcost values. Price quotations or estimates based on analogous function components are used to obtaincost estimates for other balance of plant (BOP) components. A 10% cost contingency is added to allsystems to reflect non-enumerated costs and components. The marginal cost increase from enhancingan electricity-only FCS (base design) to one that can serve combined heat and power (CHP) applicationsand/or grid-independent conditions is assessed for each system. Finally, the cost results of all three FCSdesigns are compared to assess capital cost differences. Systems are cost-modeled with peak electricalcapacities of 1 kWe, 5 kWe, 25 kWe, and 100 kWe across annual production rates of 100, 1,000, 10,000,and 50,000 systems per year.The report represents the synthesis of past SA analysis. The baseline body of work is an SA 2012 analysisof the material and manufacturing cost of CHP FCS systems.2 This work established detailed bills ofmaterials and performance assumptions for each of the three FC technologies examined. This work wasthen augmented to update details of the fuel cell designs (primarily the SOEC system). Results werethen combined with a detailed 2013 analysis of the fuel cell electrical configuration3 to identify thehardware and likely operating conditions of CHP FCS. Next, a markup rate was added onto FCS cost toproject a price that the consumer might pay for the system. Finally, results from a 2015 report4 oninstallation cost were added to the analysis. In total, the final system results contained in this reportrepresent projected CHP FCS final installed price i.e. cost plus manufacturer markup plus installation.The installation cost projections in this report are based on a first of its kind DFMATM installation costassessment of CHP fuel cell systems.5 Installation costs account for transport, permits, siting,2“Manufacturing Cost Analysis of Stationary Fuel Cell Systems”, Strategic Analysis Inc., Brian D. James, Andrew B.Spisak, Whitney G. Colella, 7 September 2012. Under Subcontract Number AGM-0-40628-01 to the NationalRenewable Energy Laboratory.33Colella, W. G., James, B. D., Assessing Electrical Sub-system Configurations and Installation Costs forStationary Fuel Cell Systems, report for the National Renewable Energy Laboratory, 9 Sept. 2013.4James, B.D., DeSantis, D.A., “Installation Cost Analysis of Stationary Fuel Cell Systems,” Strategic Analysis Inc.,under sub-contract to the National Renewable Energy Laboratory, 30 September 2015.5James, B.D., DeSantis, D.A., “Installation Cost Analysis of Stationary Fuel Cell Systems,” Strategic Analysis Inc.,under sub-contract to the National Renewable Energy Laboratory, 30 September 2015.9
electrical/plumbing/gas-line hookup, installer profit & contingency, and test of the FCS into its finaldestination. Given the myriad electrical, plumbing, and hardware options available, a focus is placed onSOFC installations linked with a hot water heating system for CHP benefits. While primarily SOFC-based,the installation approach, issues, and results are broadly applicable to the other types of fuel cellsystems considered (LT PEM and HT PEM). Installation costs are projected for an average of new homeconstruction and retrofits.A manufacturing markup is applied to convert FCS “cost” into “price”. Manufacturer’s markupspecifically accounts for the manufacturer’s expenses relating to profit, general & administrative (G&A),research & development (R&D), warranty, advertising, and other corporate expenses. A constantmarkup of 50% is applied at all production rates.The report is composed of 12 sections:Section 1: Executive SummarySection 2: IntroductionSection 3: Analysis MethodologySection 4: System Design, Performance, and Manufacturing DetailsSection 5: Summary of System Performance ProjectionsSection 6: Fuel Cell System Electrical ConfigurationSection 7: Manufacturer Markup RateSection 8: Installation CostSection 9: System Cost and Price ResultsSection 10: Summary and Comparison of System Price ProjectionsSection 11: Fuel Cell System Price ConclusionsSection 12: Appendices A-J containing detailed tabular cost and price results1.2 Summary of System Configurations and Operating ConditionsThe cost analysis considers stationary fuel cell power systems suitable for electricity generation forresidential or office building power. The systems are configured for combined heat and power (CHP)operation: waste heat from the fuel cell system is available for building heat.The fuel cell systems (FCS) are examined: For three fuel cell technologies (low temperature PEM, high temperature PEM, and solid oxide), at four power levels (1, 5, 25, and 100kWe), and at four annual manufacturing rates (100, 1,000, 10,000, and 50,000 systems per year).Although the FCSs vary significantly in technology and system power, they share many of the sameconfiguration characteristics.10
These characteristics include: Operationo operation on natural gas and airo design for water-neutral operation using a condenser to capture liquid productwater for use in the systemo produce 110VAC electricityo provide waste heat to a building CHP loado able to be connected to the external electrical grid that can load follow demands Fuel Processing (FP) Subsystemo converts NG into a hydrogen-rich reformate gas which is fed to the FC stackso based on Tokyo Gas designs of a highly thermally-integrated concentric-shell reactorwhich combines the functionality of fuel preheat, raising steam, and steamreforming in one piece of hardwareo metal monolith catalyst bed for steam reforming (SR), water-gas shift (WGS) (ifneeded), and preferential oxidation (PROX) (if needed)o catalysts applied to monoliths via washcoatingo catalyst beds sized by assumed space velocities Fuel Cell Subsystemo operation on NG reformate and airo operation at approximately 1.4 atm inlet pressure Power Electronics Subsystem (baseline case)o contains the system controls, inverters, and sensors for full system operationo relies on the grid for system start-upo does not contain batteries CHP Subsystemo uses waste heat from the fuel cell stack and fuel processing sub-system exhaust toheat building water or airo includes heat exchangers for this purpose Housing and Final System Assemblyo includes a FCS housing suitable for outdoor installationo does not include any cost allowance for system installation in the field Cost Margino includes a 10% cost contingency to cover the cost of un-enumerated components System Lifetimeo although system lifetime and cost are related, we treat them as independentvariables to allow a cost assessment among FC technologies at different maturitylevels.o consequently, all systems are oversized by 20% to correspond to future mature FCtechnologies that only decay 20% in power density over their useful lifetime.11
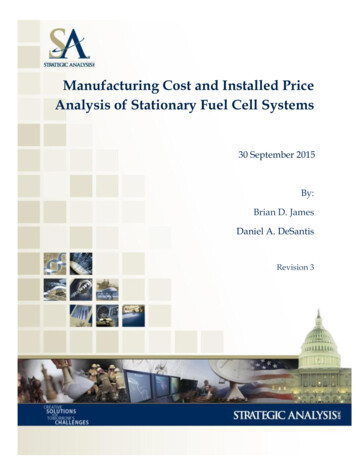
Additionally, technology specific characteristics include: Low Temperature (LT) Polymer Electrolyte Membrane (PEM) Fuel Cello planar metallic cell constructiono stamped stainless steel bipolar plates with an anti-corrosion coatingo based on a Nafion -based supported membrane achieving 408 milliwatts persquare centimeter (mW/cm2)at 0.676 volts/cell at 80 degrees Celsius ( C) at 0.4milligrams (mg) platinum (Pt) catalyst/cm2 at beginning of life High Temperature (HT) PEM Fuel Cello planar metallic cell constructiono stamped stainless steel bipolar plates with an anti-corrosion coatingo based on a pyridine-based aromatic polyether membrane achieving 240 mW/cm2at 0.6 volts/cell at 160 C at 1.0mgPt/cm2 at beginning of life Solid Oxide Fuel Cell (SOFC)o electrolyte supported planar ceramic cell construction based on the NexTechMaterials Inc.6 Flexcell designo tape cast ceramic layerso nickel –cobalt (Ni-Co) catalyst, lanthanum-strontium-cobalt-ferrite (LSCF)cathode, and yttrium stabilized zirconia (YSZ) electrolyteo achieving 291 mW/cm2 at 0.8 volts/cell at 819 C at beginning of life System Efficiencyo system efficiency among the three technologies is not normalized to a commonvalueo rather, each system is designed for operation at its anticipated operatingconditionsLT PEMHT PEMDesign Cell voltage0.676 volts/cell0.6 volts/cellDesign Power Density408 mW/cm2240 mW/cm2Net Elec. System EfficiencyHigher Heating Basis35%28%Lower Heating Basis39%31%CHP Heat Load Available40 kWthermal56 kWthermal(for 25kWe systems)Figure 1: Summary of System Efficiency6SOFC0.8 volts/cell291 mW/cm249%55%21 kWthermalhttp://www.nextechmaterials.com/energy/12
1.3 Overview of Changes to the 2012 Fuel Cell System Cost ReportThe following list summarizes changes made to the SA 2012 report7 to both update the analysis andtranslate cost into FCS installed price. A series of SOFC system changes to improve accuracy of the previous cost estimateso Incorporation of updated material price quotes discounts for purchased quantityo Addition of current collector material cost (which was previously erroneouslyomitted)o Update to the anode wash coating processo Update
Manufacturing Cost and Installed Price Analysis of Stationary Fuel Cell Systems 30 September 2015 By: Brian D. James Daniel A. DeSantis . (by volume) PROX preferential oxidation Pt/Co/Mn platinum-cobalt-manganese . Price quotations or estimates based on analogous function components are used to obtain