Transcription
1Journal of Regional Socio-Economic Issues, Vol. 7, Issue 1, January 2017
Journal of Regional Socio-Economic Issues, Vol. 7, Issue 1, January 20172JOURNAL OF REGIONAL SOCIOECONOMIC ISSUES (JRSEI)Volume 7, Issue 1, January 2017Journal of Regional & Socio-Economic Issues (Print) ISSN 2049-1395Journal of Regional & Socio-Economic Issues (Online) ISSN 2049-1409Indexed by Copernicus Index, DOAJ (Director of Open Access Journal), EBSCO, Cabell’s IndexThe journal is catalogued in the following catalogues: ROAD: Directory of Open Access ScholarlyResources, OCLC WorldCat, EconBiz - ECONIS, CITEFACTOR, OpenAccess
3Journal of Regional Socio-Economic Issues, Vol. 7, Issue 1, January 2017JOURNAL OF REGIONALSOCIO-ECONOMIC ISSUES (JRSEI)ISSN No. 2049-1409Aims of the Journal: Journal of Regional Socio-Economic Issues (JRSEI) is an internationalmultidisciplinary refereed journal the purpose of which is to present papers manuscripts linkedto all aspects of regional socio-economic and business and related issues. The views expressedin this journal are the personal views of the authors and do not necessarily reflect the views ofJRSEI journal. The journal invites contributions from both academic and industry scholars.Electronic submissions are highly encouraged (mail to: gkorres@geo.aegean.gr).Indexed by Copernicus Index, DOAJ (Director of Open Access Journal), EBSCO, Cabell’s IndexInternational Institute of Organized Research (I2OR) databaseThe journal is catalogued in the following catalogues: ROAD: Directory of Open Access ScholarlyResources, OCLC WorldCat, EconBiz - ECONIS, CITEFACTOR, OpenAccessChief-Editor Prof. Dr. George M. Korres: Professor University of the Aegean, School of SocialSciences, Department of Geography, gkorres@geo.aegean.grEditorial Board (alphabetical order) Assoc. Prof. Dr. Zacharoula S. Andreopoulou, Aristotle University ofThessaloniki, Faculty of Forestry and Natural Environment, School ofAgriculture, Forestry & Natural Environment, randreop@for.auth.grDr. Stilianos Alexiadis, Ministry of Reconstruction of Production, Environment& Energy Department of Strategic Planning, Rural Development, Evaluation && Statistics, salexiadis7@aim.com; salexiad@hotmail.comAssoc. Prof. Dr. Maria Athina Artavani, Department of Military Science,Hellenic Military Academy, Greece, artmar000@yahoo.grProf. Dr. Elias G. Carayannis: School of Business, George Washington University,USA, caraye@otenet.gr; caraye@gwu.eduProf. Dr. Christos Frangos, Technological Institute of Athens, cfragos@teiath.grProf. Dr. Andreas Demetriou, Department of Military Science, Hellenic MilitaryAcademy, Greece, andrewd@otenet.grAss. Professor Dr Vicky Delitheou, Department of Economics and RegionalDevelopment, Panteion University of Social and Political Sciences of Athens,Email: vdelith@hua.grProf. Dr. Hanna Dudek: Warsaw University of Life Sciences, hanna dudek@sggw.plProf. Dr. George Gkantzias: Hellenic Open University, ggantzias@yahoo.grProf. Dr. George Halkos, Department of Economics, University of Thessaly,halkos@uth.grProf. Dr. Richard Harris: Durham University, r.i.d.harris@durham.ac.ukAss. Prof. Dr. Olga-Ioanna Kalantzi, Department of Environment, Universityof the Aegean, Email: kalantzi@aegean.grAssoc. Prof. Dr. Stephanos Karagiannis, Panteion University, stephanoskar@yahoo.grAss. Prof. Dr. Marina-Selini Katsaiti, Department of Economics & Finance, College UAE,Selini.katsaiti@uaeu.ac.ae
Journal of Regional Socio-Economic Issues, Vol. 7, Issue 1, January 2017 4Prof. Dr. Christos Kitsos, Technological Institute of Athens, xkitsos@teiath.grDr. Aikaterini Kokkinou, Department of Military Science, Hellenic Military Academy,Greece, aikaterinikokkinou@gmail.comProf. Dr. Elias A. Kourliouros, Department of Economics, University of Patras,e.kourliouros@aegean.gr; e.kourliouros@gmail.comAss. Prof. Dr. Christos Ladias, Panteion University, Greece caladias@otenet.grProf. Dr. Dimitrios Lagos, Department of Business Administration, University of theAegean, d.lagos@aegean.grAssoc. Prof. Dr. Charalambos Louca: Head of Business Department, Director ofResearch Department, charalambos.louca@ac.ac.cyAssoc. Prof. Dr. Evangelos Manolas, Department of Forestry & Management ofthe Environment & Natural Resources, School of Agricultural & ForestrySciences, Democritus University of Thrace. E-mail: hnicalUniversityofCrete,em.marmaras@gmail.com; em.marmaras@arch.tuc.grProf. Dr. Ioannis Th. Mazis, National and Kapodistrian University of s,School of Economics and Political Sciences, f. Dr. Maria Michailidis: Dean, Department of Management & MIS, University ofNicosia, michailidis.m@unic.ac.cyProf. Dr. Photis Nanopoulos, Former Director of Eurostat, phn@otenet.grProf. Dr. Nikitas Nikitakos, Department of Shipping Trade and Transport, University ofthe Aegean, Email: nnik@aegean.grDr. Pablo Ruiz-Nápoles, Faculty of Economics, Universidad NacionalAutonoma de Mexico, ruizna@servidor.unam.mxAssistant Professor Dr. Efstratios Papanis, Department of Sociology, University of theAegean, papanis@papanis.comAssoc. Prof. Gerasimos Pavlogeorgatos (PhD), Department of Cultural Technology andCommunication, University of the Aegean, gpav@aegean.grProf. Dr. George Polychronopoulos, Technological Institute of Athens,gpolyc@teiath.grProf. Dr. Kiran Prasad, Professor Sri Padmavati Mahila Universitykiranrn prasad@hotmail.com; kiranrn.prasad@gmail.com;Dr. Efthymia Sarantakou, Architect Engineer, adjunct lecturer at the HellenicOpen University and at the Technological Educational Institute of Athens,esarad@otenet.grAssociate Professor Dr. Anastasia Stratigea, National Technical University of Athens,School of Rural and Surveying Engineering, Department of Geography and RegionalPlanning, stratige@central.ntua.grProf. Paris Tsartas, Harokopio University, Athens, Greece, ptsar@aegean.grProf. Dr. George O. Tsobanoglou, University of the Aegean, Department of Sociology,g.tsobanoglou@soc.aegean.grAssoc. Professor Dr. George Tsourvakas, School of Economic and Political Studies,Department of Journalism and Mass Communications, Aristotle University ofThessaloniki, Email: gtsourv@jour.auth.grProf. Dr. George Zestos, Christopher Newport University, gzestos@cnu.edu
5Journal of Regional Socio-Economic Issues, Vol. 7, Issue 1, January 2017Table of ContentsEditorial Board3Table of Contents5Paper 1:The Educational Level as Index of Economic and SocialDevelopment: the Case of the Cyclades (by Vasilis S. Gavalas)6Paper 2: Educational Research as a Tool for Teacher Lifelong Learning (byIoannis Kalaitzidis, Olga Kalaitzidou and Evangelos Manolas)23Paper 3: Improving Reading Difficulties in a Student with MentalRetardation: A Case Study from the Peloponnese Region (by Drossinou,Korea Maria and Panopoulos Nikolaos)34Paper 4: Inefficiency Effects and Frontier Determining Factors: A Surveytowards Technology and Innovation (by Aikaterini Kokkinou)49Paper 5: Spatial planning and tourism development – The case of Greece(by Efthymia Sarantakou)59Book Review70Call for Papers72Instructions to Authors73
Journal of Regional Socio-Economic Issues, Vol. 7, Issue 1, January 20176The Educational Level as Index of Economic and Social Development: theCase of the CycladesAbstract:Taking into account the relevant studies, the census returns and official statistics, this paperexplores the relationship between socio-economic development and education in theCyclades. These islands, seen as a geographical entity, have experienced a remarkablepopulation and economic development during the last forty years grace to a booming touristindustry. Nevertheless, the human geography of these islands is quite heterogeneous. Islandsthat have witnessed intense tourist development have a younger age structure, because of therelatively young people who settled there in search for a job. At the same time there areislands where more than 30% of their population consists of elderly people (65 and over yearsof age). The average Cycladian has a higher income than the average Greek. Nevertheless,economic prosperity does not seem to be related with a high educational level, since thepopulation of the Cyclades has, on average, lower educational level than the population ofGreece. It is plausible that in areas that are developed grace to tourism, skills and aptitudesthat are acquired through vocational training are more important to the average inhabitant thanuniversity level education.Key-Words: Education Level, Economic and Social Development, Index, CycladesJEL category: PVasilis S. Gavalas11Dr, Vasilis S. Gavalas, Assistant Professor, Department of Geography, University of the Aegean, Greece.Email address: bgav@geo.aegean.gr
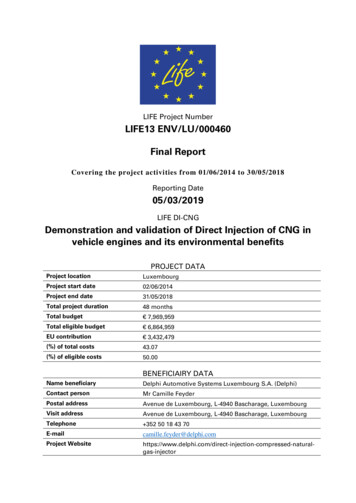
7Journal of Regional Socio-Economic Issues, Vol. 7, Issue 1, January 20171. IntroductionThe group of islands called “the Cyclades” is situated in the middle of the Aegean sea, in alatitude between 36oN and 38oN and a longitude between 24oE and 26oE. These islandsbelong to the Greek state since its independence in 1830. Since the mid-1970s they experiencea spectacular economic growth grace to the booming tourist industry. Economic growth wasfollowed by demographic and social changes in the islands. This paper investigates therelationship between educational level and economic and social development in the Cyclades.Educational systems are expensive both for the state and for the individuals that decide tofollow higher education. Therefore, the study of any relationship between educational leveland socio-economic development of an area will help us to understand the priorities of thelocal population as far as its educational goals are concerned.2. The human geography of the CycladesHuman geography, although it is not a direct consequence of economic and socialdevelopment, it is affected by it and it affects it as well. Therefore, it is useful to see somedemographic features of the population of the study islands, so as to better understand anyrelationships between socio-economic development and human geography.2.1 Population densityThe Cyclades in general are less densely populated than Greece as a whole. In 2011 therewere approximately 50 people per Km2 in the Cyclades, while in Greece there were 82.However, map 1 reveals a great heterogeneity in population density from one island toanother and also within the same islands, from one municipal unit to another. The case ofTinos is characteristic: most part of the island is very sparsely populated with less than 18inhabitants per Km2 (municipal unities of Exomvorgou and Panormou), while in Tinos(municipal unity which includes the main town of the island) there are 637 inhabitants perKm2. In the upper end of the scale is Hermoupolis of Syros, with 1229 inhabitants per Km2 ,which is by far the most densely populated municipal unit in the Cyclades.In the lower end of the scale, there are islands with less than 30 inhabitants per Km2 ,like Kea, Kythnos, Serifos, Kimolos, Sikinos, Folegandros, Amorgos, Anafi, and the smallCyclades (Schinousa being an exception). On the other hand, Santorini, Syros, Mykonos, andParos could be characterized as densely population islands (by the Cycladian standard), asthey have more than 60 inhabitants per Km2. Between these two categories, the rest of theislands are sorted (Milos, Sikinos, Naxos, Andros, Tinos, Schinousa) with between 31 and 60inhabitants per Km2.
Journal of Regional Socio-Economic Issues, Vol. 7, Issue 1, January 20178Map 1: Population Density in the Cyclades in 2011.Map 2: Sex ratio (males per 100 females) in each municipal unit. Cyclades 2011.
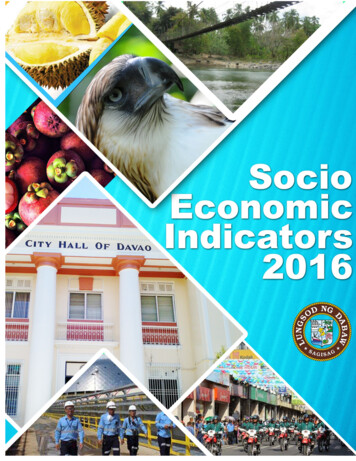
9Journal of Regional Socio-Economic Issues, Vol. 7, Issue 1, January 20172.2 The sex ratio in the populationIn Greece in 2011 women outnumbered men (there were 96 men per 100 women). UnlikeGreece as a whole, in the Cyclades the number of men exceeded slightly that of women in aratio 101 men per 100 women (ELSTAT 2014). This masculine sex ratio may be due to theimmigration that took place in the Cyclades in the 1990s mainly from ethnic Albanians. Thesex ratio of the Albanians who came in Greece during the 1990s was pretty masculine,namely 142 men per 100 women (Gavalas 2015:35)However, map 2 shows that men are not the majority of the population in every island.In Syros there were more women, especially in the municipal unit of Hermoupolis (91,8women per 100). In the municipal unit of Panormos in Tinos and in the municipal unit ofAndros women were the majority as well. In the islands of Paros, Sikinos, Naxos Santoriniand in the municipal unit of Korthi (Andros) the sex ratio was balanced (approximately 1 to1). In every other municipal unit men constituted the majority of the population.2.3 Demographic ageingThe population of the Cyclades is slightly younger than that of Greece. In 2011 the percentageof the elderly in the Cyclades (aged 65 ) was 18.9%, while that of Greece exceeded 19%.Focusing on the Cyclades, one finds great fluctuations from one island to another and fromone municipal unit to another as a far as demographic ageing is concerned (map 3). Islandsthat can be characterised as tourist-oriented, present lower percentages of elderly: inMykonos, Santorini and Ios the elderly constituted less than 16% of the population in 2011.Antiparos, Paros, Kea and Syros were following with that order with the aged populationbeing between 16% and 21% of the total. The island with the most aged population in theCyclades was Kimolos where the elderly constituted 41% of the population. Particularly highpercentages of aged population are also noticed in two municipal unities of Tinos(exomvourgou and panormou with almost 1/3 of their population being elderly) and Sikinos(28%). In general, one can observe a negative relationship between demographic ageing andtourist development/urbanization.
Journal of Regional Socio-Economic Issues, Vol. 7, Issue 1, January 201710Map 3: Elderly (65 ) as percentage of the total population. Cyclades 2011.Figure 1: Purchasing Power Standard (in Euros) per inhabitant. Greece and Cyclades 20002013.Source: Data from http://appsso.eurostat.ec.europa.eu/nui/show.do4. Indexes of economic and social development
11Journal of Regional Socio-Economic Issues, Vol. 7, Issue 1, January 2017There are several ways to measure economic development of an area. One of the mostcommon and widely used index is the annual per capita income of the population expressed aspurchasing power in a certain currency. Figure 1 shows that the average inhabitant of theCyclades was more than 20% richer than the average Greek in the period from 2000 to 2013.In certain years, like in 2005, the difference reaches 40%. It is not difficult to establish thatthis economic prosperity of the Cyclades is due to tourist development. According to the 2011census-returns 23.9% of the working population of the South Aegean (the Region which theCyclades belong to) is engaged in providing accommodation and food services, while therelevant percentage in Greece is only 7.8% (ELSTAT 2014).The importance of tourism to the economic development of the Cyclades is establishedby the data in table 1 as well. The service sector had a greater contribution in the Cyclades(compared to Greece) at least since 1995, while economic activities involving hotels andrestaurants were responsible for more than 20% of GDP in the Cyclades in 2005 versus only7% in Greece.Table 1: Contribution of certain sectors of economy to the Gross Domestic Product (GDP).Greece and the Cyclades 1995-2005.Industry andHotels andAgriculture as % constructions as Services as % of restaurants as % ofof GDP% of GDPGDPGDPYear Greece Cyclades Greece Cyclades Greece Cyclades Greece 19.215.576.081.07.021.2Source: http://www.economics.gr/AllMedia/ gr/An obvious index of tourist development is the number of professional tourist beds perinhabitant. Professional tourist beds are considered to be beds in hotels, rooms to let, andcamping. Beds in empty houses that are built as holiday houses for their owners and do notbear any profit to them are not included in the professional tourist beds. In general, theCyclades are the most tourist-oriented islands of Greece.
Journal of Regional Socio-Economic Issues, Vol. 7, Issue 1, January 201712Map 4: Professional tourist beds per inhabitant. Cyclades 2013.Map 5: Economically active men per 100 economically active women. Cyclades 2011.
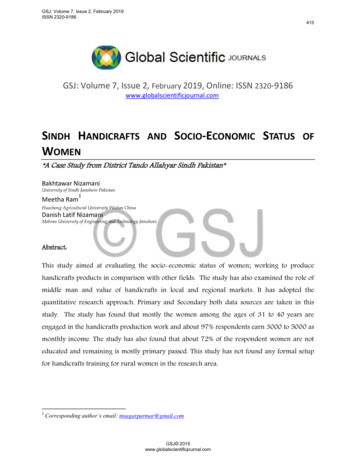
13Journal of Regional Socio-Economic Issues, Vol. 7, Issue 1, January 2017It is indicative that in 2013 there were 1.24 professional tourist beds per inhabitant inthe Cyclades, while in the same year in Rhodes there were 0.85, in Corfu 0.62 and in Crete0.35 professional tourist beds per inhabitant. Only in the island of Kos this ratio was higherthan in the Cyclades (1.55 per inhabitant). However, tourist development is not homogeneousamong the Cycladian islands. Map 4 shows the variation in the tourist development of theislands.The most tourist-oriented islands, according to map 4, are Ios, Santorini, Folegandros,Mykonos, Antiparos, Sifnos, Amorgos, Serifos and Paros, in this order if we consider asgeographical unit of analysis the Municipalities (Kallikratikoi Dimoi). In each of the abovementioned islands there were at least 1.5 professional tourist beds per inhabitant. However, inthe municipality of Naxos and Small Cyclades there were islets where the ratio ofprofessional tourist beds per inhabitant was excessively high: Ano Koufonisi and Herakliawith 3.6 and 2.3 professional tourist beds per inhabitant exceeded by far 0.87 which was theratio for the island of Naxos, and thus the municipality of Naxos and Small Cyclades as anentity presented a ratio of 1.1 professional tourist beds per inhabitant. Whether this kind oftourist development is related with the occupational status of the population is examined intable 2. In any case tourist development, even with only criterion the ratio of professionaltourist beds per inhabitant, constitutes a substantial economic and developmental feature ofthe Cyclades.4.1 Occupational StatusMore than 4 out of 10 inhabitants of the Cyclades (41.4%) were economically active in 2011,that is they were either working or seeking for a job (table 2). In the same year theeconomically active population of Greece as a whole was 42.4% of the total population. Thepercentage of economically active is an index of the participation of the population in thelabour force, i.e. in the official labour market. It is also an index of the dynamism of thepopulation as higher percentages of economic activity mean that a greater part of thepopulation is working in a paid job or is willing to do so. In the Cyclades, although theparticipation of the population in the labour market is at the same level as in Greece, there aregreat variations from one island to another. The islands with the highest participation of thepopulation in the labour force are Mykonos (54.8%), Santorini (49.3%), Ios (48.7%) andParos (44.3%). These four islands are among the most tourist oriented in the Cyclades andthey have a relatively young population (table 2 and map 3). On the other hand, the lowestpercentage of economically active population is observed in Kimolos (24.1%), followed by
Journal of Regional Socio-Economic Issues, Vol. 7, Issue 1, January 201714Sikinos (37%) and Sifnos (37.4%). In all likelihood the very low participation of theinhabitants of Kimolos in the labour force is due to its aged population: 41% of theinhabitants of Kimolos are elderly (65 years old), thus making Kimolos the most aged islandof the Cyclades. With few exceptions, the elderly neither work nor seek for a job, thusreducing the percentage of economically active in the population.It is also useful to examine the sex-specific differences in the percentages ofeconomically active. Women participate in the labour force in a smaller degree than men doin every Cycladic island and in Greece as well (map 5). However, women’s participation inthe labour force was greater in the Cyclades than in Greece as a whole. In the Cyclades therewere 74.6 economically active women per 100 economically active men, while in Greece thisratio was 66.7, according to the 2011 census. The islands with the smallest differences in theparticipation of men and women in the labour force were Kimolos, Anafi, Mykonos andSyros, where for every 100 economically active men there were 70-77 economically activewomen.As far as unemployment is concerned, the Cyclades in 2011 had lower unemploymentthan the national average (13.8% in the Cyclades versus 18.7 in Greece as a whole).Furthermore, no Cycladic island had greater unemployment than the national average, despitethe fact that variation of unemployment from one island to the other was not negligible (table2), fluctuating from 8% in the case of Kythnos to 16.7% in the case of Syros.5. Tourist development and occupational status.Tourist development increases the percentages of economically active population, though itdoes not necessarily decrease unemployment. This is inferred by examining table 2 and thecorrelation coefficients (Pearson’s r) between tourist development and the labour marketindexes. Pearson’s r between tourist development and economic activity is 0.61, meaning thatas the number of professional tourist beds per inhabitant is increasing, the percentage of thosewho are either working or seeking for a job is also increasing. On the other hand, therelationship between tourist development and unemployment, despite the fact that is negative(r -0.21), is not statistically significant (p-value 0.38) and therefore it cannot be inferred thattourist development reduces unemployment. Islands with low or medium tourist
15Journal of Regional Socio-Economic Issues, Vol. 7, Issue 1, January 2017development2 (if we regard as an index of tourist development the ratio of tourist beds perinhabitant), like the islands of Kimolos and Kea, had had a relatively low unemployment ratein 2011.Table 2: Labour market indicators and tourist development. Cyclades 2011-2013.%%Professional touristunemployed economicallybeds per inhabitantMunicipality2011active 2.40.78Kea9.340.20.83Naxos & Small 241.40.50Greece18.742.4Source: elaboration of census returns and data taken from http://archipelago.aegean.gr .Note: Pearson’s r (% unemployed * tourist beds per inhabitant) -0.213 p-value 0.381.Pearson’s r (% economically active * tourist beds per inhabitant) 0.615 p-value 0.005.On the other hand, islands where the tourist beds were more than the permanentinhabitants like the islands of Paros, Antiparos, Santorini and Mykonos had had anunemployment rate greater than 10%. The highest unemployment rate was recorded in Syrosand Naxos, island which, according to our criterion (professional tourist beds per inhabitant)are not tourist oriented, since the ratio of professional tourist beds per inhabitant is less thanone. Nevertheless, unemployment rates in the Cyclades are highly seasonal, because of theseasonality of the tourist period. One should keep in mind that the population census of 2011(from where the unemployment data have been taken) took place in May, in a month that2Islands with low or medium tourist development are considered those that have less than one professionaltourist bed per inhabitant.
Journal of Regional Socio-Economic Issues, Vol. 7, Issue 1, January 201716tourist businesses are just waking from the hibernation of the winter months and are understaffed. It is very likely that unemployment figures would have been lower, had the censustaken place in August.5.1 Educational level and tourist development.Education is considered a valuable asset and one of the milestones of civilization and progressin societal as well as in personal level. In the framework of this article, however, the topic ofour research is the contribution of education in local development. Educational systems areexpensive both for the authorities and for the individuals who decide to attend the highereducation. It is of utmost importance, therefore, to investigate the relationship betweeneducation and economic development in the Cyclades so as to understand the priorities of thelocal inhabitants as far as educational matters are concerned.Table 3: Highest educational level attained by percentages of the population. Greece and theCyclades 2011.Educational levelGreeceCycladesUniversity Graduates (plus16.7%11.5%post –graduates, PhD etc)Vocational training after4.6%4.4%finishing high schoolHigh school23.4%21.0%Mandatory education and13.2%15.2%vocational training withouthavingattendedhighschoolPrimary %Source: elaboration of census returns.In general, people in the Cyclades stop their formal education earlier than in Greece(table 3). There are proportionally more people who stopped their education in the primaryschool and in the Gymnasium (mandatory education since the age of 15) in the Cyclades thanin Greece. On the other hand, there are proportionally less Cycladians who attended highschool (lyceum in Greek) or vocational education after lyceum and even less who areuniversity graduates (compared to Greece’s population).None of the correlations between educational level and tourist development isstatistically significant. However, there seems to be a negative relation between tertiaryeducation and tourist development (table 5).
17Journal of Regional Socio-Economic Issues, Vol. 7, Issue 1, January 2017Table 4: educational level and tourist development in the Cyclades 2011-2013.(4) (3) %vocationaltourist beds(1) %(2) %hightrainingperuniversity vocational schoolwithoutinhabitantIslandgraduates traininggraduates high school .615.41.63Syros14.44.522.414.10.32Source: For the educational level: elaboration of census returns (table B06 of the 2011census). For the professional tourist beds per inhabitant https://archipelago.aegean.gr Note: data have been sorted in ascending order by column 1 (% university graduates).Table 5: Relationship between educational level and tourist development.(1)*(5) (2)*(5) (3)*(5) (4)*(5)Pearsons r:-0.20-0.130.160.30P-value0.374 0.541 0.393 0.408Source: correlations are based on data in table 4.
Journal of Regional Socio-Economic Issues, Vol. 7, Issue 1, January 201718Map 6: Sex ratio of university graduates. Cyclades 2011.Map 7: Sex ratio of those having a post-secondary vocational training certificate as highesteducational qualification. Cyclades 2011.
19Journal of Regional Socio-Economic Issues, Vol. 7, Issue 1, January 2017Map 8: Sex ratio of those having a high school certificate as highest educational qualification.Cyclades 2011.Map 9: Sex ratio of those who have attended compulsory education or vocational training(without having completed secondary education). Cyclades 2011.
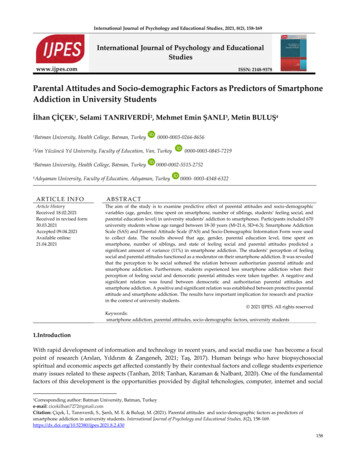
Journal of Regional Socio-Economic Issues, Vol. 7, Issue 1, January 201720The lowest percentages of university graduates are observed in the most touristoriented islands. It is plausible that young people in these islands prefer a career in the familybusiness (either this business has to do with the provision of accommodation through hotel,rooms to let etc, or with recreation activities and food services) to a university level degreewhich will not give them any practical aptitudes that are necessary for their job.An educational feature specific to the Cyclades is that women spend more years ineducation than men do. In the tertiary education (map 6) there are more graduate women thanmen in the Cyclades (100.3 women per 100 men). In Greece, on the other hand, there are farless women that have attended tertiary education than men (95.3 women per 100 men). Thisdifference between the Cyclades and Greece may be explained by the fact that in familieswith children of both sexes, it is the boy that takes over the family business. In the Cycladesthere are much more tourist businesses per inhabitant than in Greece as a whole. Many ofthese businesses do not require a university degree for their management and therefore themales who take over the businesses are not obliged to hold a university degree. Females, onthe other hand, by not having a secure job, regard tertiary education as more important.It is remarkable however, that women graduates of post-secondary vocational trainingoutnumber men of the same educational level in the Cyclades (map 7). In 2011 in theCyclades there were 115 women in this educational category per 100 men. On the other hand,in Greece there
like Kea, Kythnos, Serifos, Kimolos, Sikinos, Folegandros, Amorgos, Anafi, and the small Cyclades (Schinousa being an exception). On the other hand, Santorini, Syros, Mykonos, and Paros could be characterized as densely population islands (by the Cycladian standard), as they have more than 60 inhabitants per Km2. Between these two categories .