Transcription
Prof. M. E. Tuttle University of WashingtonStress Concentrations A “stress concentration” refers to an area in aobject where stress increases over a very shortdistance (i.e., where a high stress gradient exists) Stress concentrations typically occur due to somelocalized change in geometry (near holes, filets,corners, grooves, cracks, etc) These changes in geometry are often called “stressrisers”
Prof. M. E. Tuttle University of WashingtonStress Concentration Near a Circular Hole In 1898 Ernst Kirsch (a Germanengineer) published a solution forthe elastic stresses near a circularhole in an isotropic “infinitelylarge” thin plate (the Kirschsolution is derived in Sec 3.13 ofthe Shukla and Dally textbook) In practice, a thin plate can beconsidered to be “infinitely large”if the hole diameter is smallcompared to the in-plane platedimensions (if a/D 0.05, say)oD2ao
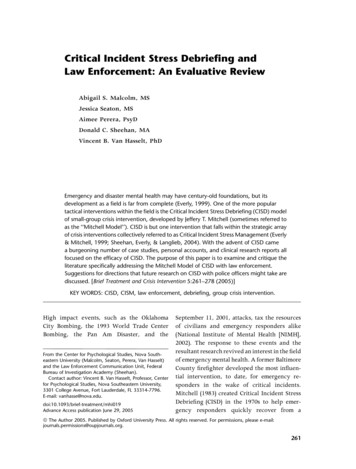
Prof. M. E. Tuttle University of WashingtonStress Concentration Near a Circular Hole Stresses along the x-axis in an infinite plate predicted by theKirsch solution:σ o a 2 3a 3σ rr σ xx 1 2 x 2 x 2σ o 3a 4 2 σ θθ σ yy 2 2 xx 4 a2τ rθ τ xy 0Figure 3.6: Distribution of σxx/σo and σyy/σoalong the x-axis
Prof. M. E. Tuttle University of WashingtonStress Concentration Near a Circular Hole Stresses at the edge of the hole (at x a):σ rr σ xx 0σ θθ σ yy 3σ oτ rθ τ xy 0 The stress concentrationfactor for a circular hole inan infinite plate:Kt σ yyσo 3Figure 3.6: Distribution of σxx/σo and σyy/σoalong the x-axis
Prof. M. E. Tuttle University of WashingtonStress Concentration Near a Circular Hole If a/D 0.05 then the plateis “finite” and the Kirschsolution is no longer valid Stress concentrationfactors for a circular holes infinite plates have been measuredexperimentally for a range ofa/D ratios (usually usingphotoelasticity), and tabulated inthe form of curve-fits in referencehandbooks required several yearsand many contributorsoD2ao
Prof. M. E. Tuttle University of WashingtonStress Concentration Near a Circular Hole Example: Wahl, A.M., and Beeuwkes, R.,“Stress Concentration Produced by Holes andNotches”, Transaction of the ASME; AppliedMechanics, Vol 56 (11) , 1930
Prof. M. E. Tuttle University of WashingtonStress Concentration Near a Circular Hole Two different definitions of thestress concentration factors arein common use:PD-based on the gross stress :maxσPyygKt where σ g t*Dσg(σg remains constant as a increases)2a-based on the net stress:σ maxyyPσnt * ( D 2a )(σn increases as a increases)K tn where σ n P
Prof. M. E. Tuttle University of WashingtonStress Concentration Near a Circular Holeo Example: fromRoark’s Formulas for Stressand Strain (2002):K tnD22a 2a 3.00 3.14 3.67 D D 32a 1.53 D 2ao
Prof. M. E. Tuttle University of WashingtonTabulated Stress Concentration Factors Stress concentration factors for many types of “stress risers”have been tabulated for example:-Young, W.C., and Budynas, R.G., Roark’s Formulas for Stress andStrain, 7th edition, McGraw-Hill, (2002)- online tabulations: http://www.amesweb.info/
Prof. M. E. Tuttle University of WashingtonStress Concentration Near an Elliptical Hole In 1913 Charles Inglis (a Britishmathematician) published asolution for the elastic stresses nearan elliptical hole in an isotropicinfinitely large thin plate (the Inglissolution is discussed in Sec 4.2) In this case the stress concentrationdepends on both the aspect ratio ofthe hole (a/b) and on the size of theplate
Prof. M. E. Tuttle University of WashingtonStress Concentration Near an Elliptical Hole For an infinite plate the stressesalong the x-axis(i.e., for x a, y 0) are given by:σ xx ( x) F1( s ) F2( s )σ yy ( x) F1( s ) F2( s )τ xy ( x) 0where:σ m 2 1 m 1 3s 2 m F2( s ) 1 1 2 22 s m s m s 2 m σ 2(1 m) F1( s ) 1 2 s2 m xx 2 s m2B 2B B 1( a b)2m a ba b
Prof. M. E. Tuttle University of WashingtonStress Concentration Near an Elliptical Hole For a finite plate:K tn2 2a 2a 2a C1 C2 C3 C4 D D D C1 1.000 0.000 a / b 2.000a / bC2 0.351 0.021 a / b 2.483a / bC3 3.621 5.183 a / b 4.494a / bC4 2.270 5.204 a / b 4.011a / b3
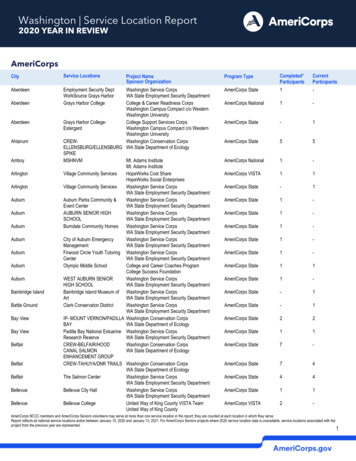
Prof. M. E. Tuttle University of WashingtonMeasuring Stress Concentrations Using StrainGages In general, even the smallestof commercial resistancestrain gages are too large tomeasure strain concentrationsnear stress risers:
Prof. M. E. Tuttle University of WashingtonMeasuring Stress Concentrations Using StrainGages
Prof. M. E. Tuttle University of WashingtonMeasuring Stress Concentrations Using StrainGageso In general, even the smallestof commercial resistancestrain gages are too large tomeasure strain concentrationsnear stress risers: a poor experimentalapproacho
Prof. M. E. Tuttle University of WashingtonMeasuring Stress Concentrations Using StrainGages Instead, use a commercial“strip gage” and extrapolateexperimental measurements toedge of stress riser
Prof. M. E. Tuttle University of WashingtonPseudo Lab #6: Stress and Strain Concentrations
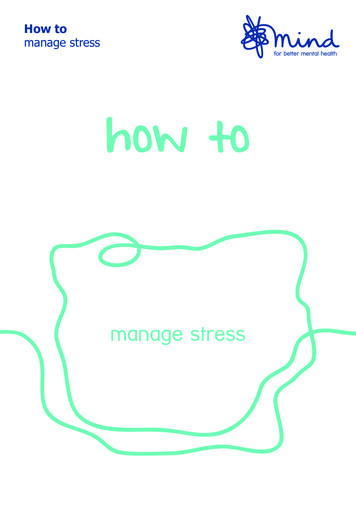
Prof. M. E. Tuttle University of WashingtonPseudo Lab #6: Stress and Strain Concentrations0.080 in(typical)0.065 inAxial gages12345678910M-M gage type SA-13-031PJ-120Gage factor 2.12, Kt 2.0%0.080 in(typical)0.065 inTransverse gages123456789M-M gage type EA-13-031MF-120Gage factor 2.09, Kt 1.2%10
Prof. M. E. Tuttle University of WashingtonCorrections for Biaxial Rosettes With DifferingTransverse Sensitivity Coefficientsεx εy (1 ν o K tx )ε mx (1 ν o K ty ) K tx ε my1 K tx K ty(1 ν o K ty )ε my (1 ν o K tx ) K ty ε mx1 K tx K tyε mx , ε my strains measured in the x- and y- directionsK tx , K ty Transverse sensitivity coefficients for gagesin the x- and y- directionsMM Tech-Note 509 “Errors Due to Transverse Sensitivity in Strain Gages”
Prof. M. E. Tuttle University of WashingtonPseudo Lab #6: Stress and Strain ConcentrationsGoals: To compare stress distributions measured near anelliptical hole in a finite thin plate to those predictedfor an infinite thin plate, and To compare the stress concentration factor measuredfor an elliptical hole in a finite thin plate to the valueexpected from a reference handbook.
Prof. M. E. Tuttle University of WashingtonPseudo Lab #6: Stress and Strain Concentrations“Official Data” – Axial Strains1200Axial Strains1000800Gage 1AStrain (µε)Gage 2AGage 3A600Gage 4AGage 5AGage 6A400Gage 7AGage 8A200Gage 9AGage 10A00-2005001000150020002500Applied Load (lbf)300035004000
Prof. M. E. Tuttle University of WashingtonPseudo Lab #6: Stress and Strain Concentrations“Official Data” – Transverse Strains60Transverse Strains4020Gage 1TStrain (µε)Gage 2TGage 3T005001000150020002500300035004000Gage 4TGage 5TGage 6T-20Gage 7TGage 8T-40Gage 9TGage 10T-60-80Applied Load (lbf)
Prof. M. E. Tuttle University of WashingtonPseudo Lab #6: Stress and Strain ConcentrationsGoal 1: Compare stress distributions measured near an ellipticalhole in a finite thin plate to those predicted for an infinite thin plate(Suggestion: compare normalized stresses)65Inglis SolutionNote: asmentionedduring classlecture, themeasuredvalues shownhere arefictitiousMeasuredσyy /σnet432100.750.850.951.051.151.25Position along x-axis (in)1.351.45
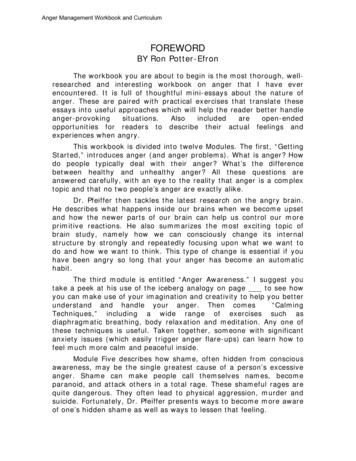
Prof. M. E. Tuttle University of WashingtonPseudo Lab #6: Stress and Strain ConcentrationsGoal 2: To compare the stress concentration factor measured for anelliptical hole in a finite thin plate to the value expected from areference handbook.(Suggestion: extrapolate a curve fit)Normalized axial stress54.543.532.521.510.5000.511.52
Prof. M. E. Tuttle University of WashingtonPseudo Lab #6: Stress and Strain ConcentrationsGoal 2: To compare the stress concentration factor measured for anelliptical hole in a finite thin plate to the value expected from areference handbook. .fit of fictitious data using a 2nd-order polynomial:Normalized axial stress54.543.5y 4.84x2 - 13.269x 10.14832.521.510.5000.511.52
Prof. M. E. Tuttle University of WashingtonPseudo Lab #6: Stress and Strain ConcentrationsGoal 2: To compare the stress concentration factor measured for anelliptical hole in a finite thin plate to the value expected from areference handbook. .fit of fictitious data using an exponential:Normalized axial stress54.543.5y 5.2287e -1.103x32.521.510.5000.511.52
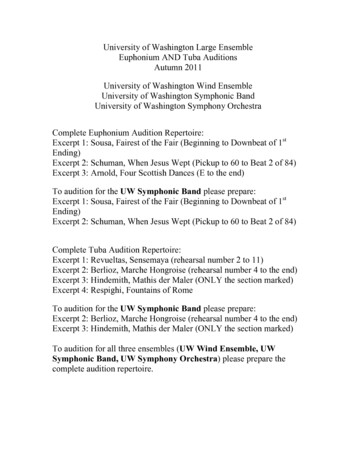
Prof. M. E. Tuttle University of WashingtonPseudo Lab #6: Stress and Strain ConcentrationsGoal 2: To compare the stress concentration factor measured for anelliptical hole in a finite thin plate to the value expected from areference handbook. fit of fictitious data using a power lawNormalized Axial Stress54.543.532.521.51y 1.7238x-1.3170.5000.511.52
Prof. M. E. Tuttle University of WashingtonPseudo Lab #6: Stress and Strain ConcentrationsGoal 2: To compare the stress concentration factor measured for anelliptical hole in a finite thin plate to the value expected from areference handbook. .fit of fictitious data using an polynomial and (1/normalizedstress)1/Normalized Axial Stress10.90.80.70.60.50.40.30.2y 1.2864x3 - 5.6909x2 8.6649x - 3.62610.1000.511.52
reference handbook. fit of fictitious data using a power law y 1.7238x-1.317 0 0.5 1 1.5 2 2.5 3 3.5 4 4.5 5 0 0.5 1 1.5 2 Normalized Axial Stress. Prof. M. E. Tuttle University of Washington Pseudo Lab #6: Stress and Strain Concentrations Goal 2: T