Transcription
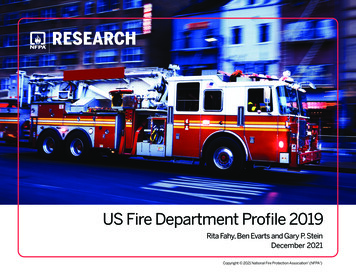
US Fire Department Profile 2019Rita Fahy, Ben Evarts and Gary P. SteinDecember 2021Copyright 2021 National Fire Protection Association (NFPA )
Key FindingsThere were an estimated 1,080,800 career and volunteer firefightersin the United States in 2019. There were 358,000 career firefightersin 2019, representing a decrease of 3 percent from the previous year.In addition, there were 722,800 volunteer firefighters, a decrease of3 percent from the previous year, but similar to recent years.In 2019, 88,800 firefighters were female (8 percent of allfirefighters). Of the career firefighters, 14,900 (4 percent) werefemale. There were also 73,900 volunteer firefighters who werefemale (10 percent of volunteer firefighters).Fifty percent of the firefighters are between 30 and 49 years old.Forty-two percent of the volunteer firefighters had more than 10 yearsof active service (tenure period).There were 29,537 fire departments in the United States in 2019. Ofthese, 18 percent were all-career or mostly career departments, and theyprotected 69 percent of the US population.Nationwide, 38 percent of fire departments provided no emergencymedical services, 46 percent provided basic life support (BLS), and17 percent provided advanced life support (ALS).From 1980 to 2019, local fire protection service expenditures(adjusted for inflation in 2019 dollars) tripled.Background and ObjectivesThis report provides an overview of local and municipal firedepartments in the United States. The analysis includes firefighters,fire departments, apparatus, and stations. The results are based ondata collected by NFPA’s Survey of Fire Departments for US FireExperience During 2019 and the NFPA fire service survey from2017–2019. An earlier report, Fire Loss in the United States During 2019,measured the national fire experience in terms of the number of firesthat fire departments responded to and the resulting civilian deaths, civilianinjuries, and property losses that occurred. Estimates of non-fire incidentswere also included.FirefightersThere were approximately 1,080,800 career and volunteer firefighters in theUS in 2019, according to estimates based on NFPA’s Survey of FireDepartments for US Fire Experience During 2019. This is a 3 percentdecrease from 2018, but in line with estimates from previous years.Career firefighters include full-time uniformed firefighters regardless ofassignments (e.g., suppression, prevention/inspection, administrative, etc.).For the purpose of this survey, the term career firefighters includes onlyfirefighters in municipal fire departments that protect people, residences,and public buildings; it does not include firefighters working in private firebrigades or for state and federal agencies.Volunteer firefighters include any active part-time (call or volunteer)firefighters. Active volunteers are defined as being involved in firefighting.Of the total number of firefighters in 2019, 358,000(33 percent) were career, while 722,800 (67 percent) were volunteers.1Most career firefighters (69 percent) work in communities that protect25,000 or more people. Most volunteer firefighters (95 percent) serve indepartments that protect fewer than 25,000 people. Approximately half(49 percent) of the volunteer firefighters are with small, rural departmentsthat protect fewer than 2,500 people.1 Note that these results are based on a sample survey and, as a result, there is a 95 percent confidence interval associated with each estimate. Based on the data reported by the fire departments that responded tothe 2019 national fire experience survey, NFPA is confident that the actual number of career firefighters falls between 346,600 and 369,400 and the actual number of volunteer firefighters falls between 703,100and 742,500.NFPA Research pg. 1
A good way to develop a sense of the size of departments relative tothe population they protect is to examine the rates of firefighters per1,000 people protected as shown in Table 3 and Table 4 in thesupporting tables sRate per 1,000People0.80.60.40.20.0Career fieivhers per 1,000 peopleNumber of Career FireightersFigure 2. Number of VolunteerFirefighters and Rate per 1,000 ghtersRate per 1,000people4.03.02.01.00.02 Figures are from the Labor Force Statistics from the Current Population Survey, Bureau of Labor Statistics, Washington DC. These numbers can change considerably from year to yearbecause of their small size and sample variability.NFPA Research pg. 2Volunteers per 1,000 peopleThe number of volunteer firefighters declined in the late 1980s and1990s, each time returning to the same level soon after. From 2005through 2009, the number of volunteer firefighters was stable at alevel slightly higher than any previously recorded other than in 1995(see Figure 2). After a dip in 2010 through 2011, the number ofvolunteers appeared to increase and was in the range of 783,300 to814,850, an increase of 4 percent. In 2018, the number of volunteerfirefighters increased to 745,000 but then dropped in 2019 to722,800. When the rates of volunteer firefighters per 1,000 peopleprotected for mostly-volunteer or all-volunteer departments areexamined, the rates show a downward trend and range from a high of8.05 in 1987 to a low of 5.8 in 2017 per 1,000 population protected.Figure 1. Number of CareerFirefighters and Rate per 1,000 PeopleNumber of Volunteer FirefightersFor mostly-career or all-career departments, the rates of careerfirefighters per 1,000 people protected have remained in the range of1.54 to 1.81 (see Figure 1). Even though the number of careerfirefighters has increased over time, the number of people protected bycareer firefighters has remained relatively consistent as the populationin the US has increased.11.6 percent of career firefighters were Hispanic or Latino8.5 percent of career firefighters were African-American1.3 percent of career firefighters were Asian3.3 percent of career firefighters were 0092010201120122013201420152016201720182019Since 1986, the number of career firefighters in the US has increasedfairly steadily from 237,750 in 1986 to 373,600 in 2017, an increase of57 percent (see Figure 1), before declining in each of the next two years.According to the Bureau of Labor Statistics in the US Department ofLabor, in 92010201120122013201420152016201720182019Number and Rates of Firefighters
NFPA estimates that in 2019, there were 14,900 female careerfirefighters and 73,900 female volunteer firefighters employed by localfire departments. 3Of the 1,080,800 firefighters, the age group accounting for the largestshare of firefighters was the 30–39 group, 27 percent of all firefighters(see Figure 3).It is important to note that the rates of firefighters per 1,000 populationare based on data reported to NFPA and do not reflect recommendedrates or some defined fire protection standard.Fire departments protecting fewer than 25,000 people had median ratesof 0.90 to 18.92 volunteer firefighters per 1,000 people. This widerange in median rates for smaller communities reflects the minimumnumber of firefighters needed to staff a department regardless of thecommunity size. Volunteer firefighters are often available on a parttime basis only; it may take more volunteers to ensure an adequateresponse to each alarm. The median rate for volunteer firefightersincreases as the population protected decreases.The length of the workweek and its effect on the rate of careerfirefighters per 1,000 population by size of the community is providedin Table 5 of the supporting tables document. Generally, longer workweeks correlate with fewer career firefighters per 1,000 populationprotected. Tables 6 and 7 of the supporting tables document providemedian rates for career and volunteer firefighters by region and size ofthe community.30%Percent of FirefightersFire departments protecting communities of 25,000 people or more hadmedian rates of 0.95 to 1.34 career firefighters per 1,000 people.Departments experience great variation in their specific circumstancesand policies, including the length of the workweek, unusual hazards,geographical dispersion of the community, and scope of servicesprovided (e.g., whether the department handles emergency medicalcalls, etc.).Figure 3. Number of Firefighters in the USby Age Group: 0–4950–5960 andoverAge group patterns did vary somewhat by the size of the populationprotected. Departments that protected fewer than 25,000 people andwere comprised mostly of volunteers tended to have higherproportions of firefighters in the under-30 age group, whiledepartments that protected 25,000 people or more and were comprisedmostly of career firefighters had higher proportions of firefighters inthe 30–39 and 40–49 age groups. Departments protecting fewer than2,500 people had the highest percentage of firefighters aged 50 andolder (32 percent).When age group patterns by year are examined between 1998–2019,there were slight changes over time (see Figure 4). The 30–39 and40–49 age groups showed decreases (15 percent and 14 percent,3 Note that these results are based on a sample survey and, as a result, there is a 95 percent confidence interval associated with each estimate. Based on the data reported by the firedepartments that responded to the 2019 national fire experience survey, NFPA is confident that the actual number of female career firefighters falls between 13,700 and 16,100 and theactual number of female volunteer firefighters falls between 70,000 and 77,800.NFPA Research pg. 3
Fire DepartmentsThere are an estimated 29,537 fire departments 4 in the United States. Ofthese, 2,789 (9 percent) are comprised solely of career firefighters 5 and19,067 (65 percent) are comprised of all volunteer firefighters. Anestimated 2,533 of the departments (9 percent) are mostly career, while5,148 (17 percent) are mostly volunteer firefighters.Fire departments categorized as all-career or mostly career representone-sixth (18 percent) of all the fire departments in the US and protectmore than two-thirds (69 percent) of the US population. Departmentscategorized as mostly volunteer or all-volunteer represent five-sixths(82 percent) of all the fire departments in the US and protect one-third(31 percent) of the US population.The number of all-career or mostly career departments increased from3,043 in 1986 to 5,322 in 2019, an increase of 75 percent, while thenumber of all-volunteer or mostly volunteer departments decreasedfrom 26,797 in 1986 to 24,215 in 2019, a decrease of 10 percent.The number of fire departments by community size is provided inTable 13 of the supporting tables document. The department typesvaried considerably based on the population protected. Forcommunities of 25,000 or more people, the percentage of departmentsclassified as all-career or mostly career ranged from 76 percent toFigure 4. Percent of Firefighters in the USby Age Group: 1998–2019Percent of FirefightersVolunteer firefighter tenure periods show that more than two of everyfive (42 percent) volunteers have more than 10 years of active service.Almost two-thirds (64 percent) of volunteer firefighters have more thanfive years of active service.100 percent, while for communities will fewer than 25,000 people, thepercentage of departments classified as all-volunteer or mostlyvolunteer ranged from 45 percent to 98 percent.403020100Age 16–19Age 20–29Age 30–39Age 40–49Age 50–59Age 60 Figure 5. Number of Volunteer Firefightersby Tenure PeriodNumber of Volunteer Firefightersrespectively), while the 50–59 age group showed a large increase(49 percent) and the 60 and over age group more than 150,000100,000157,10066,90050,0000Less than oneyear1–5 years6–10 years More than 10years4 A fire department is a public organization that provides fire prevention, fire suppression, and associated emergency and non-emergency services to a jurisdiction such as a county, municipality, or organizedfire district.5 Department type is broken into four categories. All-career departments are comprised 100 percent of career firefighters. Mostly career is comprised of 51 to 99 percent career firefighters, while mostlyvolunteer is comprised of 1 to 50 percent career firefighters. All-volunteer departments are comprised 100 percent of volunteer firefighters.NFPA Research pg. 4
Fire Department Apparatus and StationsFire Department CallsEstimates of the number of apparatus and fire stations in the UnitedStates during 2017–2019 indicate that there were 71,800 pumpers;7,500 aerial apparatuses; 80,600 other suppression vehicles (e.g.,pumpers less than 1,000 gpm, brush vehicles, tankers); 50,800 othervehicles (e.g., rescue, lighting, and ambulance vehicles); and57,000 stations. A breakdown of the average apparatus and stationrates by community size and trend data can be found in Table 15 andAppendix B of the supporting tables document.6During 2019, US fire departments responded to a total of 37,272,000calls, more than three times the 10,819,000 responses in 1980. SeeTable 20 of the supporting tables document for more information onthese responses. While the estimated number of fires has been cutalmost in half, there were nearly five times as many medical aid orrescue responses in 2019 as in 1980. There were more than five times asmany mutual aid responses. False alarms tripled over the same period.Two-thirds of the fire department responses in 2019 were medical aid orrescue calls, while fewer than 4 percent were actual fires.It is worth emphasizing what the indicated rates in Table 15represent. The numbers reflect apparatus averages and station ratesper 1,000 people by population protected as reported to NFPA. Theydo not represent recommended rates or some defined fire protectionstandard.The apparatus and station rates are higher for departments protectingsmaller communities (under 2,500) because it takes a minimumnumber of apparatus and stations to operate a fire departmentregardless of the number of people protected. For example, for adepartment protecting 1,000 people, you would expect, according toTable 15, an average of 1.14 pumpers, 1.81 other suppressionvehicles, 0.04 aerial apparatus, and 0.99 stations. The 0.99 stationsper 1,000 people is the highest rate shown in Table 15, but for thiscommunity size, it is equivalent to roughly one station perdepartment. In other words, for every 100 departments protecting1,000 people, you would expect approximately 114 pumpers,181 other suppression vehicles, 4 aerial apparatus, and 99 stations.The prevalence of pumpers, other suppression vehicles, aerial apparatus,and stations by community size is covered in Tables 16–19 in thesupporting tables document.Emergency Medical ServicesThe level of emergency medical service (EMS) provided by firedepartments by community size during 2017–2019 is provided inTable 21 of the supporting tables document.The larger the community, the more likely EMS service was provided.Nationwide, 46 percent of departments provided EMS with basic lifesupport, 17 percent of departments provided EMS with advanced lifesupport, and 38 percent of departments did not provide EMS.US Expenditures on Local Fire ProtectionTable 22 of the supporting tables document breaks down theexpenditures for local fire protection with and without adjustment forinflation. Note that these expenditures, when adjusted for inflation, havetripled from 1980 to 2019. Other municipal service costs like policeprotection have risen in a similar manner.Fire protection costs have risen 140 percent since 1986, while thenumber of career firefighters has increased 51 percent. (See Table 2 inthe supporting tables document). Because chiefs of fire departmentsserving larger communities continue to report problems with shrinkingbudgets or level budgets combined with increasing responsibilities, thisclear pattern of increasing fire department resources nationwide isdifficult to interpret. Some of the factors possibly contributing to thisNFPA Research pg. 5
increase in costs are a shorter workweek7 for some departments, whichresults in a need to increase staffing and apparatus or pay firefighters atovertime rates; increased EMS responsibilities that require increasedstaffing and, in some communities, a more frequent replacement ofapparatus; and the rising costs of retirement and health benefits.MethodsThis report is primarily based on two data sources: NFPA’s annualSurvey of Fire Departments for US Fire Experience and the NFPA fireservice survey.The Survey of Fire Departments for US Fire Experience utilizes asample of fire departments in the United States to make nationalprojections of the fire problem. The sample is stratified by the size ofthe community protected by the fire department. All US firedepartments that protect communities with a population of more than5,000 are included in the sample. The 8,672 departments in the eighthighest strata protect a population of 280 million, or 85 percent of theUS population as of July 2019.The remainder of the sample included 15,478 randomly selecteddepartments in the smallest communities (less than 5,000 populationprotected), for a total sample size of 24,150 departments, or 83 percentof all the fire departments known to NFPA in the United States.volunteer firefighters, the length of the workweek, the number ofapparatus and stations, etc. In recent years, the survey has had aresponse rate of between 13–16 percent from departments.The results in this report are based on local and municipal firedepartments. State and federal firefighting entities were not included inthis sample. In addition, no adjustments were made for private firebrigades, such as industrial or military installations.AcknowledgmentsThe authors would like to thank the fire departments whoparticipated in NFPA’s annual Survey of Fire Departments for USFire Experience and/or the NFPA fire service survey.The authors would also like to thank the members of the NFPA staffwho worked on the 2019 US fire experience survey, Frank Deely,Steve Belski, and Jay Petrillo, for editing the survey form andmaking follow-up calls to fire departments.To learn more about research at NFPA, visit nfpa.org/research.Email: research@nfpa.org.NFPA No. USS07A total of 2,432 departments responded to the Survey of FireDepartments for US Fire Experience During 2019. Nationalprojections are made by weighting sample results according to theproportion of the total US population accounted for by communitiesof each size. There is a confidence interval that measures thestatistical certainty (or uncertainty) of the estimate around anyestimate based on a sample survey. We are confident that the actualnumber of total firefighters falls within 5 percent of the estimate.The NFPA fire service survey is a three-year cycle survey that reachesabout one-third of the states in the country each year. The surveyincludes questions on the number of career firefighters, the number ofNFPA Research pg. 6
in 2019, representing a decrease of 3 percent from the previous year. In addition, t here were 722,800 volunteer firefighters , a decrease of 3 percent from the previous year, but similar to recent years. In 2019, 88,800 firefighters were female (8 percent of all firefighters). Of the career firefighters, 14,900 (4 percent) were female.
