Transcription
PDHonline Course M282 (4 PDH)Fire Dynamics Series: Fire Protection FundamentalsInstructor: Lawrence J. Marchetti, PE, CFPS2012PDH Online PDH Center5272 Meadow Estates DriveFairfax, VA 22030-6658Phone & Fax: 703-988-0088www.PDHonline.orgwww.PDHcenter.comAn Approved Continuing Education Provider
APPENDIX B. FUNDAMENTALS OF FIRE PROTECTIONThis appendix reviews some selected fundamentals and most relevant characteristics of firechemistry and physics (temperature, combustion products, smoke, toxicity, and fire extinguishingagents, etc.). Those inspectors who have never been exposed to fire protection will benefit fromstudying these fundamentals.B.1T-Squared (t2) Fire Power Law Heat Release RateB.1.1IntroductionThe primary mechanism driving the growth of a fire is the flame spreading across a fuel item orbetween multiple fuel items. This growing fire will continue until one or more of the followingconditions exist(s): Flashover occurs and all combustible materials are involved simultaneously.The fire cannot spread further due to lack of combustible materials.The fire uses all available oxygen for combustion.The fire is extinguished by intervention.B.1.2t 2 Heat Release RateFire development varies depending on the combustion characteristics of the fuel(s) involved, thephysical configuration of the fuel(s), the availability of combustion air, and the influences associatedwith the compartment. Once a stable flame is attained, most fires grow in an accelerating pattern,reach a steady state characterized by a maximum heat release rate (HRR), and then enter into adecay period as the availability of either fuel or combustion air becomes limited. Fire growth anddevelopment are limited by factors such as the quantity and arrangement of fuel, quantity ofoxygen, and effect of manual and automatic suppression systems.The primary parameter for describing fire growth is the HRR of the fire and how it changes withtime. The fire growth rate depends on the ignition process; flame spread, which defines itsperimeter; and the mass burning flux over the area involved. Once a combustible surface hasignited, the fire size increases as the flame spreads across the surface or as additional items in theroom become involved. An important aspect is that the time required for the fire to grow is drivenby the ignition source and the combustible or flammable materials present.For most materials, a local ignition eventually involves the entire fuel item by flame-spreadingprocesses. A typical sofa, for example, involves some combustion of horizontal, upward vertical,and downward vertical flame spread. For furniture and commodities, this complex fire growthprocess cannot be predicted by a simple formula. However, each item can have a characteristicgrowth time consistent with its composition and configuration. For example, a given item is ignited,it may achieve a heat release of 1 MW (1,000 kW) in 130 seconds, while another object might take80 seconds. A complete mathematical description of this process is quite involved and relativelyunpredictable given the range of ignition scenarios and the complexity of describing the burningitem(s).B-1
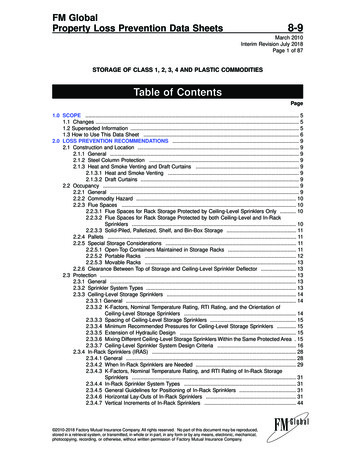
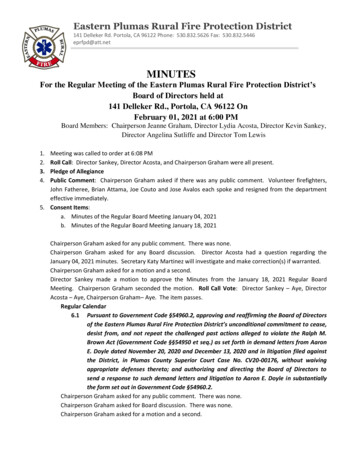
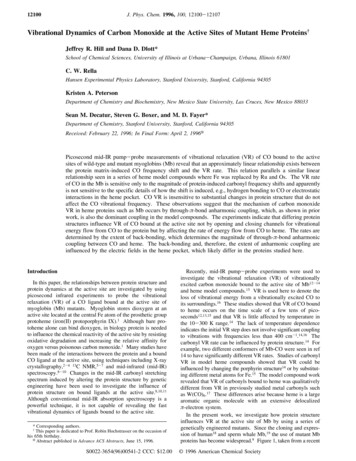
Nonetheless, testing has shown, that the overall HRR during the fire growth phase of many firescan often be characterized by simple-time dependent polynomial or exponential functions(Heskestad, 1997). The total heat release of fuel packages can be well approximated by the powerlaw fire growth model for both single item burning and multiple items involved in a fire. Testing hasalso indicated that most growing fires can be expected to grow indefinitely until intervention by firefighters, and the fires have an early incubation period where fire does not conform to a power lawapproximation, as shown in Figure B.1-1. That figure illustrates that following an incubation period,the HRR of the fire grows continuously, proportional to the square of time.Figure B.1-1 Fire Growth of t2 Fitted to Data(Heskestad, 1997, NFPA. With permission.)B-2
The proposed model of the environment generated by fire in an enclosure is dependent on theassumption that the fire grows according to the following equation:(B-1)Where: the heat release rate (HRR) of fire (kW)a a constant governing the speed of fire growth (kW/sec 2 )t the time (sec)The proposed model of the environment generated by fire in an enclosure is dependent on theassumption that the fire grows according to the following equation:(B-2)Where: the rate of heat release of fire (kW)a a constant governing the speed of fire growth (kW/sec 2 )t the time (sec)The growth rate approximately follows a relationship proportional to time squared for flaming andradially spreading fires, which are consequently called t-squared (t 2) fires. Such fires are classedby the speed of growth, identified as ultra-fast, fast, medium, and slow. W here these classes areused, they are defined on the basis of the time required for the fire to grow to a heat release rate(HRR) of 1,000 kW (1 MW). Table B.1-1 summarizes the fire intensity constant (a) and the growthtime (tg ) for each of these classes.Table B.1-1. Summary of t2 Fire ParametersClass of Fire Grow thIntensity Constanta (kW /sec 2)Growth Tim et g tra-Fast0.187675B-3
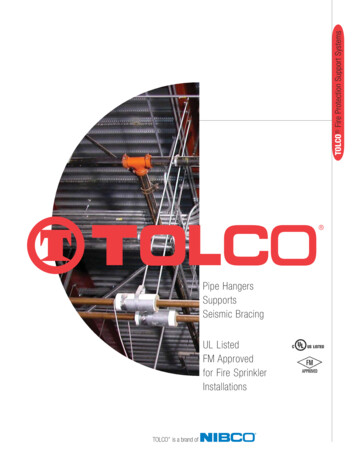
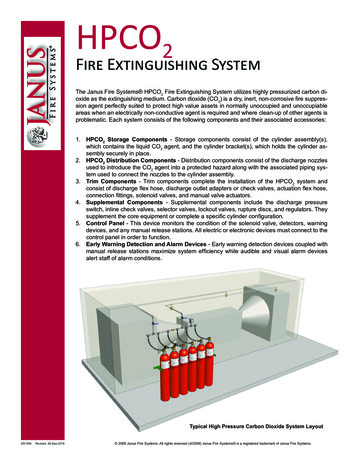
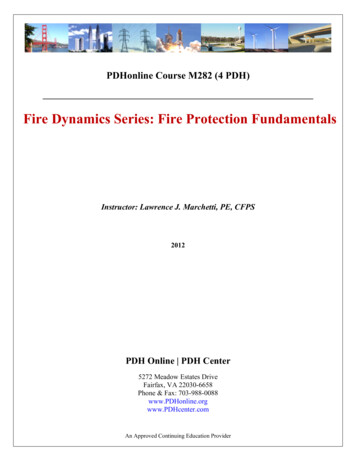
Figure B.1-2 plots the t 2 fire growth rate curves that have been developed. The t 2 relationship hasproven useful and has therefore been adopted into NFPA 72, “National Fire Alarm Code ,” tocategorize fires for siting of detectors as well as NFPA 92B “Guide for Smoke ManagementSystems in Mall, Atria, and Large Areas,” for design of smoke control systems.Figure B.1-2 Growth Rate Curves for t 2 Fire (NFPA, 72 and NFPA, 92B)A t 2 fire can be viewed as one in which the HRR per unit area is constant over the entire ignitedsurface and the fire spreads as a circle with a steadily increasing radius. In such cases, the burningarea increases in proportion to the square of the steadily increasing fire radius. Of course, fires thatdo not have such a conveniently regular fuel array and consistent burning rate might or might notactually produce a t 2 curve, but the t 2 approximation appears to be close enough for reasonabledesign decisions.B-4
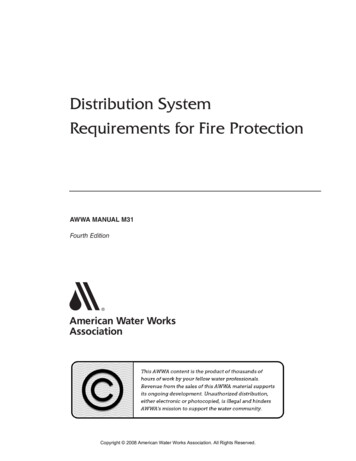
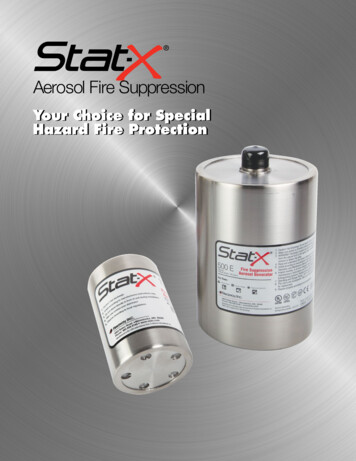
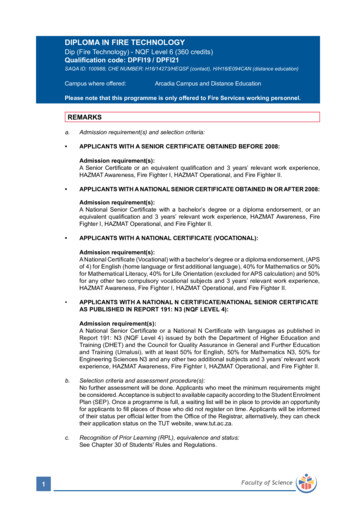
Figure B.1-3 provides the HRR results of various full-scale free burn tests performed at FactoryMutual Research Corporation (FMRC) (also reported by Nelson, 1987), superimposed on the t 2HRR curves, using various standard test commodities for fuel arrays. Figure B.1-4 relates theclasses of t2 fire growth curves to a selection of actual fuel arrays. Figure B.1-5 plots the HRRcurves for various upholstered furniture items. Figures B.1-3 to B.1-5 show that the actual firegrowth curves for many common fuel arrays tend to be greater than the medium fire growth curve.Figure B.1-3 Comparison of t2 Heat Release Rate with Full-Scale Free-BurnHeat Release Rate (Nelson, 1987)Figure B.1-4 Relation of t2 Heat Release Rate to Some Fire Tests (Nelson, 1987)B-5
Figure B.1-5 Comparison of t2 Heat Release Rateswith Full-Scale Furniture Heat Release RateTable B.1-2 tabulates the maximum HRR for various warehouse materials. As shown, the majorityof these materials exhibit fire growth rates in the fast or ultra-fast ranges. The preponderance ofactual fire testing over the 1990's has shown that common fuel arrays exhibit fire growth rates thattend to exceed the medium t2 fire growth rate.Table B.1-2. Maximum Heat Release Rates of Warehouse Materials(NFPA 72, 1999 Edition, Appendix B)W arehouse Material(See Notes 1 and 2)Grow thTim e(sec)Heat ReleaseW ood pallets, stacked, 1½ ft high(6% –12% moisture)150–310110Fast-MediumW ood pallets, stacked, 5 ft high(6% –12% moisture)90–190330FastW ood pallets, stacked, 10 ft high(6% –12% moisture)80–110600FastW ood pallets, stacked, 16 ft high(6% –12% moisture)75–105900FastMail bags, filled and stored 5 ft high19035MediumCartons, compartmented and stacked 15 ft high60200FastB-6Rate ()Fire Grow thClassification(Btu/sec-ft 2)(See Note 3)
Table B.1-2. Maximum Heat Release Rates of Warehouse Materials(NFPA 72, 1999 Edition, Appendix B)W arehouse Material(See Notes 1 and 2)Fire Grow thClassificationGrow thTim e(sec)Heat ReleasePaper, vertical rolls, stacked 20 ft high15–28-(See Note 4)Cotton (also PE, PE/cot, acrylic/nylon/PE), garmentsin 12 ft high racks20–42-(See Note 4)Cartons on pallets, rack storage, 15 ft–30 ft high40–280-Fast-MediumPaper products, densely packed in cartons,rack storage, 20 ft high470-SlowPE letter trays, filled and stacked 5 ft high on cart190750MediumPE trash barrels in cartons, stacked 15 ft high55250FastFRP shower stalls in cartons, stacked 15 ft high85110FastPE bottles, packed in item 685550FastPE bottles in cartons, stacked 15 ft high75170FastPE pallets, stacked 3 ft high130-FastPE pallets, stacked 6 ft–8 ft high30–55-FastMethyl alcohol-65-Gasoline-200-Kerosene-200-Diesel oil-180-Notes:(1)(2)(3)(4)Rate ()(Btu/sec-ft 2)(See Note 3)For SI units, 1 ft 0.305 m.FRP fiberglass-reinforced polyester; PE polyethylene; PS polystyrene;PP polypropylene; PU polyurethane; PVC polyvinyl chloride.The HRRs per unit floor area are for fully involved combustibles, assuming 100-percent combustionefficiency. The growth times shown are those required to exceed 1,000 Btu/sec HRR for developing fires,assuming 100-percent combustion efficiency.Fire growth rate exceeds design data.B-7
Madrzykowski (1996), compared HRR data for office work stations with standard t 2 HRR fire curves.Figure B.1-6 shows the HRR time history of the fire growth of a three-sided office work stationcompared to t 2 fire curves. Notice how the fire begins as a slow-medium growth rate fire, and thenthe slope increases to be representative of a fast-ultra-fast fire. As shown in Figure B.1-6, one canuse the t 2 fire growth model to determine the HRR of similar fuel packages.Figure B.1-6 Three-Sided Work Station Heat Release Rate CurveCompared with t2 Curves (Madrzykowski, 1996)B-8
Figure B.1-7 shows the relationship between t2 fire curves and six 1.2-m (4-ft) high stacks of mixedwooden pallets (8 to 9 pallets per stack) arranged in two rows of three stacks, with the three stacksin each row forming an unbroken line with 100-mm between the front and back rows. Figure B.1-7shows that both tests exhibited there was an incubation period following which the fire growth ratewas approximately parallel to the t2 fast fire growth curve.Figure B.1-7 Heat Release Rate Curve for Idle Pallets Compared with t 2 Curves(Garred and Smith, 1999, Interscience and Interflam. With permission.)B-9
Figure B.1-8 shows the relationship between t2 fire curves and six 12-m (4-ft) high stacks ofcardboard boxes arranged in two rows of three stacks, with no gaps between the stacks. The boxeswere ignited by setting light to a ball of crumpled newspaper pushed 100 mm under the front of thecentral stack in the front row of the array. Figure B.1-8 shows that both tests exhibited a longincubation period, as the ball of newspaper proved to be slow burning. However, the fire did breakinto the boxes immediately above the ignition source, and the flames eventually burst from the frontof those boxes and then rapidly up the front of the central (ignition) stack. Thereafter the fire growthrate was similar to the ultra-fast t 2 fire curve.Figure B.1-8 Heat Release Rate for Stacked Box Fires Compared with t 2 Curves(Garred and Smith, 1999, Interscience and Interflam. With permission.)B.1.3ReferencesGarred, G., and D.A. Smith, “The Characterization of Fires for Design,” Interflam 1999, ConferenceProceedings of the 8 th International Interflam Conference, Interscience Communication Limited,England, pp. 555–566, June-July 1999.Gross, D., “Data Sources for Parameter Used in Predictive Modeling of Fire Growth and SmokeSpread,” NBSIR 85-3223, U.S. Department of Commerce, National Bureau of Standards (NBS),Gaithersburg, Maryland, 1985.Heskestad, G. “Venting Practice,” Section 7, Chapter 7, NFPA Fire Protection Handbook, 18 thEdition, A.E. Cote, Editor-in-Chief, National Fire Protection Association, Quincy, Massachusetts,pp. 7–105, 1997.Madrzykowski, D., “Office Station Heat Release Study: Full Scale vs. Bench Scale,” Interflam 1996,Conference Proceedings of the 7 th International Interflam Conference, Interscience CommunicationLimited, England, Compiled by C.A. Franks, pp. 47–55, 1996.Nelson, H.E., “An Engineering Analysis of the Early Stages of Fire Development: The Fire at theDupont Plaza Hotel and Casino on December 31, 1986,” NBSIR 87-3560, U.S. Department ofCommerce, National Bureau of Standards (NBS), Gaithersburg, Maryland, May 1987.NFPA 72, “National Fire Alarm Code,” 1999 Edition, National Fire Protection Association, Quincy,Massachusetts.NFPA 92B, “Guide for Smoke Management Systems in Malls, Atria, and Large Areas,” 2000Edition, National Fire Protection Association, Quincy, Massachusetts.B-10
B.2Elements of Hydraulic and Electrical SystemsTable B.2-1 provides the basic elements of a hydraulic system along with the correspondingelements of an electrical system.Table B.2-1. Corresponding Elements of Hydraulic and Electrical Systems(NFPA 921, 2002 Edition)Elements of a Hydraulic SystemElements of an Electrical SystemPumpGeneratorPressureVoltage (potential or electromotive force)Pounds per square inch (psi)Volts (V)Pressure gaugeVoltmeterW aterElectronsFlowCurrentGallons per minute (gpm)Amperes (A)FlowmeterAmmeterValveSwitchFrictionResistance (Ohms)Friction lossVoltage dropPipe size (inside diameter)Conductor size (AW G No.)Hydraulic systems use a pump to create the hydraulic pressure necessary to force water throughpipes. The amount of hydraulic pressure is expressed in pounds per square inch (psi) and can bemeasured with a pressure gauge. By contrast, electrical systems use a generator to create thenecessary electrical pressure (voltage) to force electrons through a conductor. The amount ofelectrical
Figure B.1-2 Growth Rate Curves for t Fire (NFPA, 72 and NFPA, 92B)2 A t fire can be viewed as one in which the HRR per unit area is constant over the entire ignited2 surface and the fire spreads as a circle with a steadily increasing radius. In such cases, the burning area increases in proportion to the square of the steadily increasing fire radius. Of course, fires that do not have such a .