Transcription
The BrightScope/ICI Defined Contribution Plan Profile:A Close Look at 401(k) Plans, 2017AUGUST 2020The BrightScope/ICI Defined Contribution Plan Profile: A Close Look at 401(k) Plans, 2017 1
THE BRIGHTSCOPE/ICI DEFINED CONTRIBUTION PLAN PROFILEThe BrightScope/ICI Defined Contribution Plan Profile is a collaborative research effort between BrightScope and the InvestmentCompany Institute that analyzes plan-level data gathered from audited Form 5500 filings of private-sector defined contribution(DC) plans, providing unique, new insights into private-sector DC plan design. The research draws from information collectedin the BrightScope Defined Contribution Plan Database. The database is designed to shed light on DC plan design across manydimensions, including the number and type of investment options offered; the presence and design of employer contributions;the types of recordkeepers used by DC plans; and changes to plan design over time. In addition, industrywide fee information ismatched to investments in DC plans, allowing analysis of the cost of DC plans. The BrightScope/ICI Defined Contribution PlanProfile supplements existing plan sponsor surveys and research based on recordkept data, and it is designed to increase publicunderstanding in this critical area of retirement savings. This material is not intended for benchmarking the costs of specific plans tothe broad averages presented here.This report in The BrightScope/ICI Defined Contribution Plan Profile series focuses on private-sector 401(k) plans in 2017. Thisreport first analyzes large 401(k) plans in the Department of Labor 2017 Form 5500 Research File. Focus then shifts to more than55,000 audited 401(k) plans in the BrightScope Defined Contribution Plan Database, which have between four and 100 investmentoptions and typically 100 participants or more. Private-sector 403(b) plans have been excluded from this analysis; for analysis ofERISA 403(b) plans, see The BrightScope/ICI Defined Contribution Plan Profile: A Close Look at ERISA 403(b) Plans, 2016 (April2020), available at www.ici.org/pdf/20 ppr dcplan profile 403b.pdf.In the exhibits in this report, dollars and percentages may not add to the totals because of rounding.Suggested citation: BrightScope and Investment Company Institute. 2020. The BrightScope/ICI Defined Contribution Plan Profile: A CloseLook at 401(k) Plans, 2017. San Diego, CA: BrightScope and Washington, DC: Investment Company Institute. Available at www.ici.org/pdf/20 ppr dcplan profile 401k.pdf.Copyright 2020 by the Investment Company Institute and BrightScope. All rights reserved.
Contents711Key Findings7401(k) Plan Enrollment, Employer Contributions, and Use of Loans8401(k) Investment Menu Design9401(k) Plans Engage a Variety of Service Providers9401(k) Plan FeesIntroduction11 The Role of 401(k) Plans in US Retirement Planning13 The Department of Labor Form 5500 Research File14 The BrightScope Defined Contribution Plan Database17 Research Agenda for This Report19Chapter 1: 401(k) Plan Enrollment, Employer Contributions, and Use of Loans19 Employer Plan Design Choices30 401(k) Plan Activity Combinations31 401(k) Plan Activities by Presence of Automatic Enrollment33Chapter 2: 401(k) Investment Menu Design33 Number and Types of Investment Options41 Investment Vehicles41 Aggregate Asset Allocation43 Index Funds49Chapter 3: 401(k) Plans Engage a Variety of Service Providers49 Types of Recordkeepers52 Proprietary Funds55Chapter 4: 401(k) Plan Fees55 Total Plan Cost59 Mutual Fund Expenses69778385AppendixNotesGlossaryReferences
ExhibitsINTRODUCTION12 Exhibit I.1401(k) Plans Hold 6.4 Trillion in Assets13 Exhibit I.2Universe of 401(k) Plans14 Exhibit I.3BrightScope Audited 401(k) Filings and the Universe of 401(k) Plans by Plan Assets15 Exhibit I.4BrightScope Audited 401(k) Plans’ Share of the 401(k) Universe by Plan Assets16 Exhibit I.5BrightScope Audited 401(k) Filings and the Universe of 401(k) Plans by Number of Plan ParticipantsCHAPTER 1: 401(k) PLAN ENROLLMENT, EMPLOYER CONTRIBUTIONS, AND USE OF LOANS20 Exhibit 1.1Larger 401(k) Plans Are More Likely to Automatically Enroll Participants21 Exhibit 1.2Employers Make Contributions in Most Large 401(k) Plans22 Exhibit 1.3Larger 401(k) Plans Are More Likely to Offer Employer Contributions23 Exhibit 1.4Employers Make Significant Contributions to Large 401(k) Planss24 Exhibit 1.5Employer Contributions Are a Slightly Larger Share of Total Contributions in Larger 401(k) Plans25 Exhibit 1.6Employer Contribution Matching Formulas26 Exhibit 1.7Many Large 401(k) Plans Make Automatic Employer Contributions27 Exhibit 1.8Employers with Simple Matches Use a Variety of Matching Formulas28 Exhibit 1.9Eligibility and Vesting in BrightScope Audited 401(k) Plans
29 Exhibit 1.10Nearly All Larger 401(k) Plans Have Participant Loans Outstanding30 Exhibit 1.11Large 401(k) Plans with Selected Plan Activity Combinations31 Exhibit 1.12Large 401(k) Plans with Automatic Enrollment Are More Likely to Have Both Employer Contributions and Outstanding LoansCHAPTER 2: 401(k) INVESTMENT MENU DESIGN34 Exhibit 2.1Number of Investment Options in 401(k) Plans35 Exhibit 2.2Distribution of Number of Investment Options in 401(k) Plans36 Exhibit 2.3Consistent 401(k) Plans Have Increased the Number of Investment Options Offered37 Exhibit 2.4Equity and Bond Funds Are the Most Common Investment Options in 401(k) Plans38 Exhibit 2.5Average Number of Investment Options in 401(k) Plans by Type of Investment39 Exhibit 2.6Incidence and Number of Investment Options Offered in 401(k) Plans by Type of Investment40 Exhibit 2.7Average Number of Investment Options in Consistent 401(k) Plans41 Exhibit 2.8Types of Investment Vehicles in 401(k) Plans42 Exhibit 2.9The Largest Share of 401(k) Assets Is Invested in Equity Funds44 Exhibit 2.10Target Date Fund Use Has Increased in 401(k) Plans45 Exhibit 2.11Larger 401(k) Plans Tend to Be More Likely to Offer Target Date Funds46 Exhibit 2.12Index Fund Use Has Increased in 401(k) Plans47 Exhibit 2.13Index Fund Use Is Nearly Universal in Larger 401(k) PlansCHAPTER 3: 401(k) PLANS ENGAGE A VARIETY OF SERVICE PROVIDERS50 Exhibit 3.1Larger 401(k) Plans Are More Likely to Use Asset Managers for Recordkeeping51 Exhibit 3.2Types of Recordkeepers Used by 401(k) Plans53 Exhibit 3.3Proprietary Fund Use Varies with 401(k) Plan Size
CHAPTER 4: 401(k) PLAN FEES57 Exhibit 4.1Total Plan Cost by 401(k) Plan Assets58 Exhibit 4.2Distribution of Total Plan Cost by 401(k) Plan Assets59 Exhibit 4.3401(k) Mutual Fund Investors Tend to Pay Lower-Than-Average Expenses for Equity Mutual Funds61 Exhibit 4.4ICI and BrightScope Analyses of 401(k) Mutual Fund Expenses62 Exhibit 4.5Average Expense Ratios of Mutual Funds in 401(k) Plans, 201763 Exhibit 4.6Average Expense Ratios of Mutual Funds in 401(k) Plans, 200965 Exhibit 4.7Distribution of Mutual Fund Expense Ratios Paid by 401(k) Plan Participants66 Exhibit 4.8401(k) Plan Mutual Fund Fees in Consistent Plans Tended to Decrease Between 2009 and 201767 Exhibit 4.9Average Expense Ratios of Mutual Funds in Consistent 401(k) Plans by Plan Assets, 2009 and 2017APPENDIX69 Exhibit A.1401(k) Plan Activity Combinations70 Exhibit A.2Distribution of Participants by 401(k) Plan Activity Combinations71 Exhibit A.3Employer Contribution Activity in 401(k) Plans72 Exhibit A.4401(k) Contributions in the 401(k) Universe72 Exhibit A.5Employer Contributions as a Share of Total Contributions in the 401(k) Universe73 Exhibit A.6Conditional Average Number of Investment Options in 401(k) Plans by Type of Investment74 Exhibit A.7Detailed Distribution of Mutual Fund Expense Ratios Paid by 401(k) Plan Participants75 Exhibit A.8Sample Sizes
Key Findings401(k) Plan Enrollment, Employer Contributions, and Use of LoansEmployers choose the features to include in their 401(k) plans, including whether to automatically enroll participants, whether tooffer employer contributions, and whether to offer plan loans. This study analyzes automatic enrollment, employer contributions, andparticipant loans outstanding in a sample of more than 60,000 large private-sector 401(k) plans—typically plans with 100 participants ormore in 2017.» Larger 401(k) plans are more likely to report that they automatically enroll workers into the plan. More than half of large401(k) plans in the sample with more than 250 million in plan assets reported that they automatically enrolled their participants,and nearly six in 10 plans with more than 1 billion in plan assets did, compared with about 20 percent of plans in the sample with 10 million or less in plan assets.» Most 401(k) plans offer employer contributions. In 2017, 86 percent of large 401(k) plans covering more than nine outof 10 401(k) participants had employer contributions. Nearly all of the largest plans—about 95 percent of 401(k) plans with5,000 participants or more—had employer contributions. Employer contributions are also common even among smaller401(k) plans—86 percent of 401(k) plans in the sample with 100 to 499 participants had them in 2017.» Larger 401(k) plans are more likely to report participant loans outstanding. More than 90 percent of 401(k) plans inthe sample with more than 50 million in plan assets had participant loans outstanding, compared with about 76 percent of401(k) plans with 1 million to 10 million in plan assets and 32 percent of plans with less than 1 million. Overall, 78 percent of401(k) plans in the sample had participant loans outstanding, and 90 percent of participants were in those plans in 2017.» Larger 401(k) plans tend to be more likely to have employer contributions, participant loans outstanding, and automaticenrollment. About 40 percent of plans in the sample with 5,000 participants or more had employer contributions, participantloans outstanding, and automatic enrollment, compared with 12 percent of plans in the sample with fewer than 100 participants.Overall, 22 percent of 401(k) plans in the sample reported evidence of all three activities in 2017.» 401(k) plans with automatic enrollment are more likely to have both employer contributions and participant loansoutstanding than plans without automatic enrollment. In 2017, more than three-quarters of the large 401(k) plans in thesample with automatic enrollment also had both employer contributions and participant loans outstanding, compared with lessthan two-thirds of plans in the sample without automatic enrollment.The BrightScope/ICI Defined Contribution Plan Profile: A Close Look at 401(k) Plans, 2017 7
401(k) Investment Menu DesignWhen designing their 401(k) plans, employers choose the number and types of investment options in the plan, looking for a diverserange of options. This study also explores the investment menus that employers have chosen for 401(k) plans in the BrightScope DefinedContribution Plan Database and how investments vary by plan size. The BrightScope Defined Contribution Plan Database containsdetailed information from audited Form 5500 reports for more than 55,000 large private-sector 401(k) plans—plans with between fourand 100 investment options and typically 100 participants or more.» 401(k) plans offer participants a wide variety of investment options. In 2017, the average large 401(k) plan offered28 investment options, of which about 13 were equity funds, three were bond funds, and eight were target date funds. Nearly allplans offered at least one domestic equity fund, international equity fund, and domestic bond fund, and more than four-fifthsof plans offered target date funds. Funds include mutual funds, collective investment trusts (CITs), separate accounts, and otherpooled investment products.» Mutual funds were the most common investment vehicle in 401(k) plans. Mutual funds held 45 percent of large private-sector401(k) plan assets in the sample in 2017. CITs held 31 percent of assets, guaranteed investment contracts (GICs) held 7 percent,separate accounts held 4 percent, and the remaining 14 percent were invested in individual stocks (including company stock),individual bonds, brokerage, and other investments. Mutual funds accounted for at least half of the assets in all but the verylargest plans. CITs accounted for a larger share of assets in the largest plans than mutual funds.» Equity funds accounted for the largest share of assets in 401(k) plans. In 2017, 43 percent of large 401(k) plan assets wereheld in equity funds, 27 percent were held in balanced funds (with most of that being held in target date funds), and 7 percentwere held in bond funds. GICs and money funds accounted for 8 percent of assets.» Target date funds have become more common in 401(k) plans since 2006. In 2006, 32 percent of large 401(k) plans offeredtarget date funds; this had risen to 82 percent of plans in 2017. Similarly, the percentage of participants who were offered targetdate funds increased from 42 percent of participants to 81 percent between 2006 and 2017, and the percentage of assets investedin target date funds increased from 3 percent to 24 percent.» Index funds make up a significant component of 401(k) assets, holding more than one-third of 401(k) assets in 2017. Indexfunds held a greater share of assets in larger 401(k) plans, rising from 23 percent of assets in plans with less than 1 million inplan assets to 40 percent of assets in plans with more than 1 billion. Index funds are widely available across all plan sizes. Morethan 95 percent of 401(k) plans with more than 10 million in plan assets offered index funds in their plan lineups in 2017, while79 percent of 401(k) plans with less than 1 million did. Index funds, which tend to be equity index funds, generally have lowerexpense ratios than actively managed equity funds.8 The BrightScope/ICI Defined Contribution Plan Profile: A Close Look at 401(k) Plans, 2017
401(k) Plans Engage a Variety of Service ProvidersWhen employers offer a 401(k) plan to their employees, they engage service providers to help manage the operation of the plan. Drawingfrom the BrightScope Defined Contribution Plan Database, this study explores the types of recordkeepers used by large 401(k) plans andthe use of proprietary funds.» Employers choose from a range of providers for 401(k) plan recordkeeping. Insurance companies were the most commonrecordkeeper type for 401(k) plans, and were more likely to provide recordkeeping services for the smaller 401(k) plans in thesample. Asset managers, which include mutual fund companies, were the second most common recordkeepers across plans, andthey were more likely to provide recordkeeping services for larger plans. As a result, asset managers provided recordkeepingservices for 31 percent of plans but for 41 percent of participants and 55 percent of plan assets in 2017.» Most 401(k) plans offered investment options that included investment options proprietary to the plan’s recordkeeper,but proprietary investments accounted for a small share of total 401(k) assets. Plan sponsors choose a plan recordkeeperand select the investment lineup for the plan. Sixty-six percent of 401(k) plans included investment options proprietary to theplan’s recordkeeper in their investment lineups, and those investments accounted for a little more than one-quarter of total planassets in 2017.401(k) Plan FeesEmployers offering 401(k) plans typically hire service providers to assist in operating the plans, and those service providers charge feesfor their services. To better understand the impact of fees, BrightScope has developed a total plan cost measure that includes all fees onthe audited Form 5500 reports as well as fees paid through investment expense ratios. In addition, the fees paid on mutual funds heldin large 401(k) plans are analyzed. Total plan cost and mutual fund fee data are analyzed for large subsets of the BrightScope DefinedContribution Plan Database (401(k) plans with between four and 100 investment options and typically 100 participants or more) withsufficiently complete information.» The BrightScope measure of total 401(k) plan costs has decreased since 2009, based on snapshots of 401(k) plan fees.In 2017, the average total plan cost was 0.92 percent of assets, down from 1.02 percent in 2009. The average participant was in alower-cost plan, with a total plan cost of 0.58 percent of assets in 2017 (down from 0.65 percent in 2009), while the average dollarwas invested in a plan with a total plan cost of 0.37 percent in 2017 (down from 0.47 percent in 2009). BrightScope’s total plan costincludes administrative, advice, and other fees from Form 5500 filings, as well as asset-based investment management fees.» Mutual fund expense ratios in 401(k) plans tend to be lower in larger plans and have trended down over time. For example,the average asset-weighted expense ratio for domestic equity mutual funds (including both index and actively managed funds)was 0.79 percent for plans with less than 1 million in plan assets, compared with 0.34 percent for plans with more than 1 billionin plan assets in 2017. Mutual fund expense ratios also tended to decrease in 401(k) plans between 2009 and 2017.The BrightScope/ICI Defined Contribution Plan Profile: A Close Look at 401(k) Plans, 2017 9
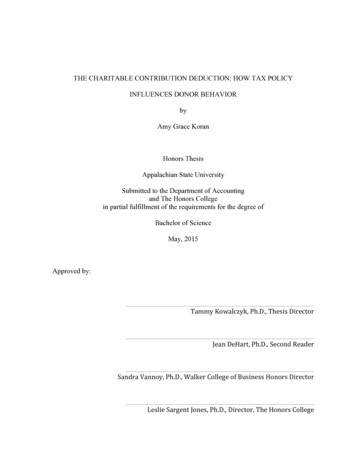
IntroductionThe Role of 401(k) Plans in US RetirementPlanningA 401(k) is an employer-sponsored defined contribution (DC)retirement plan that enables employees to make tax-deferredcontributions from their salaries to the plan. Employers offer401(k) plans as part of an overall compensation package of wagesand benefits in order to attract workers and provide them with abenefit package that helps them save for retirement. Employersdetermine the features their 401(k) plans will include, within rulesgoverning 401(k) plans, and typically engage service providers toadminister the plan and provide investment options.As the prevalence of private-sector defined benefit (DB) pensionplans has declined, DC plans (such as 401(k) plans) have becomea more important component of retirement savings for Americanworkers. Because of the tax advantages they provide and theirimportance for retirement, researchers and policymakers havean interest in understanding how workers are using 401(k) plansto prepare for retirement. Researchers and policymakers are alsointerested in how employers have structured their plans, includingthe incentives to participate, such as automatic enrollment oremployer contributions, plan loans, the number and types ofinvestment offerings, and the fees paid to operate the plan.Employers decide whether they will automatically enrollemployees or have employees sign up for the plan and whetherthey will allow access to 401(k) account assets through a loanfeature. They may also make employer contributions intoemployee 401(k) accounts. Typically, plan participants direct theinvestment of their accounts, choosing from the lineup of optionsoffered in the plan. With 6.4 trillion in assets at the end of 2019,401(k) plans have become one of the largest components of USretirement assets, accounting for nearly one-fifth of all retirementassets (Exhibit I.1).The BrightScope/ICI Defined Contribution Plan Profile: A Close Look at 401(k) Plans, 2017 11
EXHIBIT I.1401(k) Plans Hold 6.4 Trillion in AssetsTrillions of dollars, year-endAnnuities1Federal, state, and local government DB plans2Private DB plansIRAsOther DC plans3401(k) 2.328.82.26.73.511.0 201820191.6114.01.216.21.432.6Annuities include all fixed and variable annuities held outside of retirement plans and IRAs.Federal DB plans include US Treasury security holdings of the civil service retirement and disability fund, the military retirement fund, the judicial retirement funds,the Railroad Retirement Board, and the foreign service retirement and disability fund. These plans also include securities held in the National Railroad RetirementInvestment Trust. The reported assets of federal DB plans for 2017 are adjusted for US Treasury financing activities undertaken after the legal limit on federalgovernment borrowing was reached. These actions temporarily reduced the amount of Treasury securities reported on the balance sheet of the Civil Service Retirementand Disability Fund.Other DC plans include 403(b) plans, 457 plans, private employer-sponsored DC plans without 401(k) features, and the Federal Employees Retirement System (FERS)Thrift Savings Plan (TSP).Data are estimated.Sources: Investment Company Institute, Federal Reserve Board, Department of Labor, National Association of Government Defined Contribution Administrators,American Council of Life Insurers, Internal Revenue Service Statistics of Income Division, and Government Accountability Office; see Investment Company Institute2020b12 The BrightScope/ICI Defined Contribution Plan Profile: A Close Look at 401(k) Plans, 2017
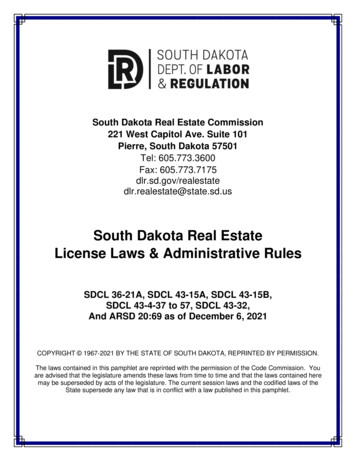
The Department of Labor Form 5500Research FilePrivate-sector 401(k) plans are required to file Form 5500 withthe US Department of Labor (DOL).1 The information in thosefilings includes the number of plan participants, assets held inthe plan, and other plan features. The DOL makes available notonly individual Form 5500 reports but also a comprehensivedatabase for the universe of 401(k) plans, which researchers cananalyze.2 Tabulations of the BrightScope Defined ContributionPlan Database find that there were nearly 570,000 401(k) plans,covering 69 million participants in 2017 (Exhibit I.2).3 Small,medium, and large employers in all industries and coveringdiverse workforces sponsor these plans, and they choose todesign their plans to meet their unique circumstances. Althoughmost plans are small (55.8 percent have less than 1 million inplan assets), most participants4 are in larger plans (59.3 percentare in plans with more than 50 million in plan assets).Therefore, this report will focus on plan design both from theplan perspective and from the participant perspective. Chapter1 will discuss plan design with respect to automatic enrollment,employer contribution, and participant loan use across401(k) plans.EXHIBIT I.2Universe of 401(k) PlansDistribution of 401(k) plans, participants, and assets by plan assets or number of plan participants, 2017PlansParticipantsAssetsPlan assetsNumberPercentThousandsLess than 1M317,86655.8%5,358.3 1M to 10M214,89337.713,217.919.1646.312.0 10M to 50M27,9764.99,575.013.9563.010.5 50M to 100M3,6950.64,422.56.4256.54.8 100M to 250M2,4560.46,619.09.6382.27.1 250M to 500M1,0530.25,019.87.3366.56.8 500M to 1B6230.14,526.16.5433.58.1More than 2100.05,369.5100.0All plansPlansPercent7.8%Billions of dollars 102.5ParticipantsPercent1.9%AssetsNumber of planparticipantsNumberPercentFewer than 100506,80289.0%10,650.1100 to 49949,0868.69,555.413.8583.510.9500 to 9996,1371.14,262.36.2280.05.21,000 to 4,9995,6041.011,674.116.9912.917.05,000 to 9,9998110.15,560.08.0524.49.810,000 or 4.2100.05,369.5100.0All plansThousandsPercent15.4%Billions of dollars 756.5Percent14.1%Note: Assets are fair market value at the year-end of the plan and include loans. The results exclude 403(b) plans with a 401(k) feature.Source: BrightScope Defined Contribution Plan DatabaseThe BrightScope/ICI Defined Contribution Plan Profile: A Close Look at 401(k) Plans, 2017 13
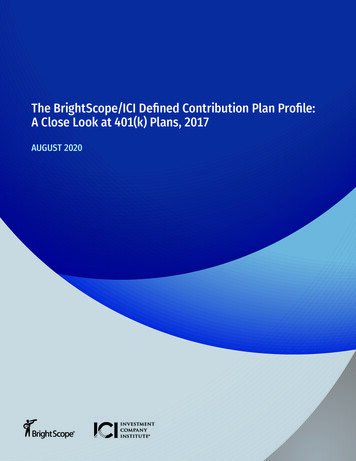
The BrightScope Defined Contribution PlanDatabaseTo better understand DC retirement plans, BrightScope hascreated the BrightScope Defined Contribution Plan Database,which is compiled by extracting information from audited reportsfiled annually by larger private-sector DC plans with the DOL.These audited filings supplement the DOL Form 5500 ResearchFile, providing additional detail for the larger plans. Generally,plans with 100 participants or more are required to file an auditedreport with the DOL.5 These reports generally contain informationon the investments offered by the plan, assets in theseinvestments, and employer contribution structures. BrightScopehas also included information from the Form 5500, whichprivate-sector sponsors of 401(k) plans (as well as other types ofprivate-sector employer-sponsored pension plans) are requiredto file with the DOL annually.6 These filings contain importantinformation about the plans, including the number of participantscovered, total plan assets, and total contributions to anddistributions from the plan. In addition, BrightScope has combinedthe audited data with outside data sources to incorporate the feespaid by 401(k) and other DC plan participants associated with theinvestments in their plans. For chapters 2, 3, and 4 of this report,the additional detailed data from audited Form 5500 filings formore than 55,000 large 401(k) plans are analyzed (Exhibit I.3).For 2017, the BrightScope Defined Contribution Plan Databasecontains audited information on 10 percent of 401(k) plans,covering 81 percent of 401(k) plan participants and 84 percent of401(k) plan assets (Exhibit I.4).7Because 401(k) plans with fewer than 100 participants aregenerally not required to file the audited reports required oflarger plans, the BrightScope Defined Contribution Plan Databasedoes not contain many small plans. Though most 401(k) plansare small plans, most participants and assets are in larger plans.For example, although the sample analyzed contains informationon more than 55,000, or 10 percent, of the nearly 570,000 plansin the DOL 401(k) universe in 2017, it contains 4.5 trillion, or81 percent, of the 5.4 trillion in assets (Exhibits I.3, I.4, and I.5).Coverage rates in the database are higher for larger plans—morethan 95 percent of plans with more than 50 million are included,but the database contains audited information on very few planswith less than 1 million in plan assets (Exhibit I.4). Coveragerates of 401(k) plans in the database grouped by number of planparticipants tell a similar story, with larger plans much more likelyto be included than smaller plans (Exhibit I.5).EXHIBIT I.3BrightScope Audited 401(k) Filings and the Universe of 401(k) Plans by Plan AssetsDistribution of 401(k) plans, participants, and assets by plan assets, 2017BrightScope audited 401(k) filingsPlan assetsLess than 1MPlansNumberParticipantsThousandsDepartment of Labor 401(k) universeBillions of sBillions of dollars2,975755.4 1.6317,8665,358.3 102.5 1M to 10M25,0726,513.6121.3214,89313,217.9646.3 10M to 50M19,3528,838.6424.927,9769,575.0563.0 50M to 100M3,5474,241.8246.93,6954,422.5256.5 100M to 250M2,3886,461.4371.92,4566,619.0382.2 250M to 500M1,0264,870.3357.51,0535,019.8366.5 500M to 1B6054,445.1421.06234,526.1433.5More than .84,509.8569,25769,124.25,369.5All plansNote: BrightScope audited 401(k) filings generally include plans with 100 participants or more. Plans with fewer than four investment options or more than 100investment options are excluded from BrightScope audited 401(k) filings for this analysis. Assets are fair market value at the year-end of the plan and include loans.Source: BrightScope Defined Contribution Plan Database14 The BrightScope/ICI Defined Contribution Plan Profile: A Close Look at 401(k) Plans, 2017
EXHIBIT I.4BrightScope Audited 401(k) Plans’ Share of the 401(k) Universe by Plan AssetsShare of Department of Labor 401(k) universe in BrightScope audited 401(k) filings by plan assets, 2017Percentage of plans97.296.097.497.197.869.20.9Less than 1M11.7 1M to 10M9.8 10M to 50M 50M to 100M 100M to 250M 250M to 500M 500M to 1BMore than 1B97.098.298.0All plansPlan assetsPercentage of participants97.692.395.9 10M to 50M 50M to 100M81.249.314.1Less than 1M 1M to 10M 100M to 250M 250M to 500M 500M to 1BMore than 1B97.197.9 500M to 1BMore than 1BAll plansPlan assetsPercentage of assets96.397.397.5 50M to 100M 100M to 250M 250M to 500M84.075.518.81.6Less than 1M 1M to 10M 10M to 50MAll plansPlan assetsNote: The sample is 55,645 plans with 56.1 million participants and 4.5 trillion in assets. BrightScope audited 401(k) filings generally include plans with 100 participantsor more. Plans with fewer than four investment options or more than 100 investment options are excluded from BrightScope audited 401(k) filings for this analysis.Source: BrightScope Defined Contribution Plan DatabaseThe BrightScope/ICI Defined Contribution Plan Profile: A Close Look at 401(k) Plans, 2017 15
EXHIBIT I.5BrightScope Audited 401(k) Filings and the Universe of 401(k) Plans by Number of Plan ParticipantsDistribution of 401(k) plans, participants, and assets by number of plan participants, 2017BrightScope audited 401(k) filingsNumber of llions of dollarsFewer than 1005,422392.8 47.6100 to 49937,2348,042.8519.6500 to 9995,9724,148.0275.51,000 to 4,9995,42711,322.2886.35,000 to 9,9997875,405.7513.010,000 or more80326,783.32,267.855,64556,094.84,509.8All plansAssetsDepartment of Labor 401(k) universePlansParticipantsAssetsNumber of planparticipantsNumberFewer than 100506,80210,650.1 756.5100 to 49949,0869,555.4583.5500 to 9996,1374,262.3280.01,000 to 4,9995,60411,674.1912.95,000 to 9,9998115,560.0524.410,000 or more81727,422.32,312.2569,25769,124.25,369.5All plansThousandsBillions of dollarsShare of Department of Labor 401(k) universe in BrightScope audited 401(k) filingsNumber of etsPercentFewer than 1001.1%3.7%6.3%100 to 49975.984.289.0500 to 99997.397.398.41,000 to 4,99996.897.097.15,000 to 9,99997.097.297.810,000 or more98.397.798.19.881.284.0All plansN
CHAPTER 4: 401 (k) PLAN FEES 57 Exhibit 4.1 Total Plan Cost by 401(k) Plan Assets 58 Exhibit 4.2 Distribution of Total Plan Cost by 401(k) Plan Assets 59 Exhibit 4.3 401(k) Mutual Fund Investors Tend to Pay Lower-Than-Average Expenses for Equity Mutual Funds