Transcription
INTERNATIONAL JOURNAL OF ENVIRONMENTAL & SCIENCE EDUCATION2016, VOL. 11, NO. 16, 9469-9481OPEN ACCESSExamining the Effectiveness of Augmented RealityApplications in Education: A Meta-AnalysisHakan Tekederea, Hanife GökeraaGaziUniversity, TURKEYABSTRACTIn this study, the purpose is examining the reviews released on augmented reality applicationsin education, merging the results obtained in the studies that are independent from eachother, and providing a new viewpoint for the studies that will be conducted in the future. Themeta-analysis method has been used in the study. 15 out of 171 reviews, whose effect size ofthe data may be calculated, and released between the years 2005 and 2015 have been includedin the meta analytic effect size analysis. The reviews were intended to examine the efficiencyof augmented reality applications in education and were selected after scanning the SCI andSSCI Indices. The names and the abstracts of the reviews were taken as bases in the classifyingaccording to the target audience and subjects. It was determined as a conclusion in the studythat the average effect size of the augmented reality applications in education was ES 0.677.In other words, it was determined that the applications performed by using the augmentedreality technology in education had a positive effects on students, and that this effect was atmedium level that could not be underestimated according to Thalheimer and CookClassification. At the end of the study, the development of the augmented reality applicationsused in education, the missing points in present studies, and the new study areas arementioned.KEYWORDSAugmented reality, meta-analysis, education,effectiveness.ARTICLE HISTORYReceived 13 July 2016Revised 10 September 2016Accepted 19 September 2016IntroductionEducational technologies are developing at a great speed in today’s world, andinfluencing students, teachers, learning environments, and learning processes.The integration of education and informatics technologies gave rise to theemergence of studies at different qualities, increase in the learning sources,differentiation in learning sources and teaching approaches. The changinglearning sources and differentiating teaching approaches are based on anCORRESPONDENCEHakan TEKEDEREtekedere@gazi.edu.tr 2016 The Author(s). Open Access terms of the Creative Commons Attribution 4.0International /) apply. The license permits unrestricted use, distribution, andreproduction in any medium, on the condition that users give exact credit to the original author(s) and the source,provide a link to the Creative Commons license, and indicate if they made any changes.
9470TEKEDERE & GÖKERunderstanding in which the learner is active and researching instead of passivelearning, thinking, and supporting independent learning (Glasgow, 1997). Thechanges in developing informatics technologies and teaching programs andmaterials make is necessary to prepare a rich learning environment that mayattract the attention of the z-generation. In this context, the learning materialsprepared by using the Augmented Reality (AR) technology offer a learningmedium that is close to the real world (Cai, Wang, & Chiang, 2014) and make itpossible for the students to play an active role in the learning process.AR technology is the one that includes the loading and merging of virtualobjects on real world images (video, sound, photograph, text, 3D models, etc.). ARis accepted as the extension of the virtual reality. Unlike virtual reality, AR offersthe users a perfect interface that brings the real and virtual world together. Theusers may interact with the virtual objects that are placed within the real scenesaround and experience the most natural and real human-computer interaction(Cai, Wang, & Chiang, 2014). Briefly, it is aimed in AR applications that a mediumwhich is close to the real world is offered to the users.The use of AR technology in education is accepted as the first one of theapplication fields whose future is bright (Wu, Lee, Chang, & Liang, 2013). TheNew Media Consortium released the Horizon Report in 2012 and stated that ARtechnology is the newest technology for teaching, learning and creative research(New Media Consortium, 2012). AR technology attracted attentions with itsproperties like making it possible to interact with virtual and real objects,ensuring learning by doing and learning by experience, and increasing theattention and motivation (Singhal, Bagga, Goyal, & Saxena, 2012). It is clear thatefficient results will be obtained from the real learning experiences that areprovided with Augmented Reality technology based on the consideration that thelearning in which more senses are involved within the learning process will bemore powerful (Seferoğlu, 2007). A real learning experience is always necessaryand the learning in which more senses are involved is powerful. In this context,AR appears before us as a new technology that is developing for learning processes(Lai & Hsu, 2011; Luckin & Fraser, 2011).It was observed in previous applications that using AR in education influencedthe learning process in a positive way (Ibáñez, Di Serio, Villaran, & Kloos, 2014;Cai, Wang, & Chiang, 2014). It was reported that AR technology may be moreinfluential in showing the astronomical events and dangerous experiments, whichare not possible in the real world, to students, making the abstract subjectsbecome concrete ones and making students gain experiences in subjects that arebased on practice (Shelton & Hedley, 2002). It has been determined that therehave been many studies in the past conducted on the use of AR technology inteaching chemistry (Cai, Wang, & Chiang, 2014), teaching mathematics andgeometry (Sommerauer & Müller, 2014; Kaufmann & Schmalstieg, 2003),teaching natural sciences (Chiang, Yang, & Hwang, 2014), teaching physics(Ibáñez, Di Serio, Villaran, & Kloos, 2014; Cai, Chiang, & Wang, 2013; Lin, Duh,Li, Wang, & Tsai, 2013), and in increasing the academic success levels andmotivations of students (Martin-Gutierrez & Fernandez, 2014; Di Serio, Ibanez,& Kloos, 2013; Ferrer-Torregrasa, Torralba, Jimenez, Garcia, & Barcia, 2015). Inthis context, there are a great number of studies conducted to examine the studies
INTERNATIONAL JOURNAL OF ENVIRONMENTAL & SCIENCE EDUCATION9471conducted on the field of education with meta-analysis method (Özcan & Bakioğlu,2010; Dinçer, 2015; Wu, Wu, Chen, Kao, Lin, & Huang, 2012; Kış & Konan, 2014).However, we did not find any studies conducted on examining the methods of thestudies on the use of AR in education and on calculating the influence quantity.In the light of the literature, which is summarized above, the methods of thestudies on the use of AR in education are examined. The issues of on which fieldsthese studies, which are independent from each other, are focused on aredetermined. When the results are combined together and when the influencequantity of the results obtained from these studies are determined, new targetswill be provided for future researchers.With this study, the studies scanned in the SCI and SSCI indices that areintended for the AR applications in education will be analyzed with meta-analysismethod, and the total effect size of these studies will be measured to provide newinsights to the studies conducted in this field. In this study, the purpose iscompiling the (a) studies that are conducted on how the AR technology is used ineducation; (b) classifying these studies according to the type of the subjects, years,target audience, the magazines they are published, and the efficiency levels; (c)combining the findings on the efficiency of the use of the AR applications ineducation with meta-analysis method, and measure the efficiency of theseapplications.METHODThe meta-analysis method was used in the study. Meta-analysis is the methodof compiling the digital data obtained in various studies that are independentfrom each other in a statistical manner, and inferring a general judgment on theresults of these studies (Gözüyeşil & Dikici, 2014). In a simple way, meta-analysisis the grouping of similar studies on the same subject under certain criteria, andinterpreting the quantitative findings of these studies. The number of samplingmay be increased in meta-analysis methods by combining the samplings of thestudies (Cumming, 2012) and the general impact of the studies may be measured.In order to apply this method, the effect size, variance and the weighted averagesof the effect size of each study must be calculated (Dinçer, 2014). The merging ofthe results of empirical studies and the quantitative data to enlarge the samplingof the studies increase the validity of the studies (Ellis, 2012).The number of the studies that are needed in order to perform a meta-analysisstudy is not fully clear yet. Dinçer (2013) stated that if the stable influences modelis used in the meta-analysis study, even only two studies would be sufficient.When the meta-analysis studies conducted so far are examined, it has beenobserved that generally the number of the studies included in the study varyaccording to the number of the studies that may be reached about the maincontents of the study. When the relevant literature is examined it was observedthat the number of the studies that were included in the meta-analyses in the pastwas as follows; 8 (Tavil & Karasu, 2013), 12 (Wecker & Fischer, 2014), 16 (Kış &Konan, 2014; Özcan & Bakioğlu, 2010), 67 (Merchant, Goetz, Cifuentes, KeeneyKennicutt, & Davis, 2014). Although the number of the studies included varies
9472TEKEDERE & GÖKERaccording to the subject matter, it is observed that the number of the studies wasat least 8 in practice.Data sourcesIn order to determine the studies that would be included in the meta-analysis,the reviews that were released in international journals that were indexed by SCIand SSCI were examined. The references given in these studies were alsoexamined to include the studies that could not be detected during the electronicscanning. The key words like education, augmented reality and augmented realityin education were used during the electronic scanning.The 171 reviews that were determined during the scanning were examined indetail by considering the following criteria. The criteria that were used indetermining the reviews were (a) being released in journals with SCI and SSCIIndex; (b) AR technology being used for educational purposes, (c) having thenecessary statistical data (d) the release date being between 2005 - 2015. Theempirical studies were focused on in the reviews; and firstly, the ones in whichpre-tests and post-tests were applied and in which there were comparisonsbetween the groups were selected for the study. The studies which did not havethe necessary variables (n, x, t, ss etc.) that were needed for meta-analysis wereexcluded from the study. 15 reviews which met the criteria were included in thestudy.The studies that met the criteria were classified according to their authors,release dates, dependent and independent variables, the number of theparticipants, the study method, age, gender, and result data.Data analysisThe effect size was calculated for each study and for general (general effect)overall influence for the statistical values of the study. The effect size is the basicunit of the meta-analysis study, and is a value that reflects the size of the relationbetween two variables or reflects the size of the effect size. The general effect, onthe other hand, is the weighted average value of the study effects (Dinçer, 2013).The Hedges’ g effect coefficient calculating formula was used in calculating theeffect size homogeneity coefficient.There are various classifications in examining the effect size in the literature(Cohen, 1988; Lipsey & Wilson, 2001; Thalheimer & Cook, 2002). The Thalheimerand Cook (2002) classification, which is more frequently used in the literature,and which has a more detailed classification than the other ones, has been usedin this study. The ranges used in this classification are given below:- 0.15 d 0.15 at an unimportant level0.15 d 0.40 at a low level0.40 d 0.75 at a medium level0.75 d 1.10 at a high level1.10 d 1.45 at a very important level
INTERNATIONAL JOURNAL OF ENVIRONMENTAL & SCIENCE EDUCATION94731.45 d at a perfect levelResults and discussion15 studies that had the necessary statistical data were determined for the metaanalysis study, which examined the efficiency of AR applications in education.The summary of the studies that were included in this study, whether there isbiasness in terms of the studies, the confidence between the raters, theuncombined findings of the influence quantities and the forest graphics,homogeneity test results, and the findings that were combined according to therandom influences model are given below:Inter-rater reliabilityIt is necessary in meta-analysis studies that the safety of the encoding form isensured (Card, 2012). 50% of the studies that were included in the meta-analysiswere encoded by two researchers separately, and the confidence between theencoders was calculated. By doing so, the issue of whether the data obtained inthe studies were included in the qualitative summary or not in an accuratemanner was checked. The confidence between two encoders was determined to be100%.The summary of the studiesThe number of the sampling of the 15 studies in the 15 studies that wereincluded in the study was 919, and the number of the sampling of the ControlGroup was 641, totally 1560. When the target audience of the studies that wereincluded in the study were examined it was observed that 3 of the AR studies wereconducted at primary school level, 2 at secondary school level, 1 both at primaryschool and secondary school level, 3 were at high school level, 5 were at universitylevel, and the remaining 1 at primary, secondary, high school, and universitylevels together. The field of the studies, the size of the sampling, the targetaudience and the results of these studies are summarized in Table 1 together withother properties.Table 1The summaries of the studies.Authors(Date ofRelease)Cai, Chiang,& Wang(2013)Chen & Tsai(2012)Di serio,Ibanez, &Kloos (2013)Name of theMagazineInternationalJournal ofEngineeringEducationComputers &EducationFieldNumberof theSamplingTargetAudienceExaminationReported SuccessYesVisual YesComputers &Education
TEKEDERE & , &Barcia(2015)Hsiao (2013)Hsio, Chen,& Huang(2012)Journal ofScienceEducationandTechnologyMultimediatools ise ess)YesLearningLevel(Success )YesIbanez, DiSerio,Villaran, &Kloos (2014)Computers &EducationPhysicsJee, Lim,Youn, & Lee(2014)MultimediaTools andApplicationsMathematics, English,socialsciences,and naturalscience56elementaryschoolsand middleschoolsKe & Hsu(2015)Internet uters &EducationPhysics(ElasticCollision)40Computers &GraphicsEngineeringInternationalJournal ofEngineeringEducationEngineering(Mechanical)Lin, Duh, Li,Wang, &Tsai Lopez, &Ortega(2010)MartinGutierrez faction,motivationYesAcademicSuccessYesSommerauer & Müller(2014)Computers ool,HighSchool,UniversityWei, Weng,Liu, & Wang(2015)Computers terest,trust,satisfactionYesZhang,Sung, Hou,& Chang(2014)Computers ccess )YesPublication biasThe most important problem in applying meta-analysis is the potential errorand bias that stem from the combination of different studies. This problem stems
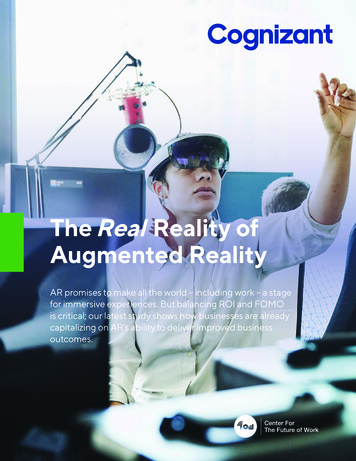
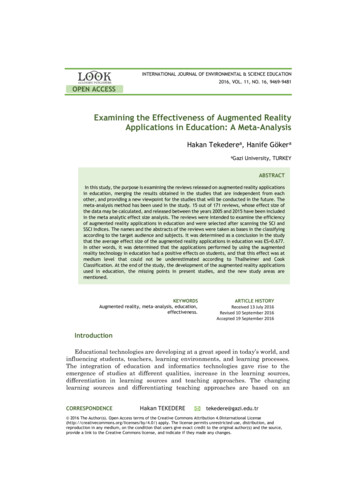
INTERNATIONAL JOURNAL OF ENVIRONMENTAL & SCIENCE EDUCATION9475from the combination of studies that are independent from each other. One of themethods used in testing the common publication bias is the Funnel ScatterGraphics. Funnel Graphics are simple scatter graphics of the effect size estimatedin each study against a unit of the size of sampling in studies (Üstün & Eryılmaz,2014). In Funnel Graphics, the graphic is similar to an upside-down funnel if thereare no bias; on the other hand, if there is publication bias, the graphic must bedistorted and asymmetric (Üstün, 2012). The Funnel Scatter Graphics used inthis study to test the publication bias is given in Figure 1.Figure 1. The funnel scatter graphic of the studies the contain effect size data.As it is observed in Figure 1, the 15 studies that are included in the study areplaced in both sides of the vertical effect size line in a symmetrical manner andare very close to the effect size that is symmetrical and merged. In case there isno publication bias, it is expected that they are distributed to both sides of thevertical line showing the merged effect size in a symmetrical manner, and if studyis outside the pyramid, they are expected to collect in the middle and upper partsof the figure. If there is publication bias, then, the majority of the studies arecollected in the bottom part of the funnel figure or only in one part of the verticalline (Üstün, 2012; Borenstein, Hedges, Higgins, & Rothstein, 2009). It is observedthat the 15 studies that are included in the study to determine the effect size aredistributed in a symmetrical manner, and only 2 of them are outside the pyramid.However, it is also observed that one of these 2 studies is in the middle part of thepyramid. This situation shows that there is no publication bias for the studies thatare included in this study. Moreover, except for the Funnel Graphics, the metaanalysis results may also become biased when low-quality studies are included inthe analysis (Çarkungöz & Ediz, 2009). For this reason, the studies that have highquality (the ones that are released in SCI and SSCI) are included in this study.Homogeneity test, Q and I2 statisticsThe Q, P or I2 values are used in the homogeneity tests of the studies. If the Qvalue of the studies is higher than the critical value in the X 2 table, it isheterogeneous, and if it is lower it is homogenous. The homogeneity of the studiesmay also be tested by checking the P value. If the P value is lower than .05, it isheterogeneous; and homogenous if it is higher. In interpreting the I 2, 25% showsheterogeneity at a low level; 50% shows heterogeneity at a medium level; and 75%shows heterogeneity at high level (Cooper, Hedges, & Valentine, 2009). If thestudies are heterogeneous, the Random Influence Model is used, is they are
TEKEDERE & GÖKER9476homogenous; the Stable Influence Model is used. The results of the homogeneitytest of the effect size distribution of the studies are given in Table 2.Table 2The results of the homogeneity test of the effect size distribution.Q ValuedfpI2 Value35.692140.00160.776The Q value was found to be 35.692 for the homogeneity test. Q being equal to23.68479 for 14 degree of freedom at 95% significance level from the X2 criticalvalue range table shows that the effect size distribution is heterogeneous.Meanwhile, the I2 value shows heterogeneity at a medium level with 60.776%. Forthis reason, the Random Influences Model was used in the study when the generalinfluence was calculated.The non-merged findings of the effect size analysis of the studies andthe forest plotThe effect sizes, the upper and lower limits according to 95% confidenceinterval and the p value of the studies that examine the efficiency of the ARapplications in education are given in Table 3.Table 3The effect sizes of the studies conducted on AR applications in education.StudiesCai, Chiang & Wang (2013)Chen & Tsai (2012)Di serio, Ibanez, & Kloos (2013)Ferrer-Torregrasa, Torralba,Jimenez, Garcia, & Barcia (2015)Hsiao (2013)Hsio, Chen, & Huang (2012)Ibanez, Di Serio, Villaran, & Kloos(2014)Jee, Lim, Youn, & Lee (2014)Ke & Hsu (2015)Lin, Duh, Li, Wang, & Tsai (2013)Martin-Gutierrez, Saorin, Contero,Alcaniz, Perez-Lopez, & Ortega(2010)Martin-Gutierrez & Fernandez(2014)Sommerauer & Müller (2014)Wei, Weng, Liu, & Wang (2015)Zhang, Sung, Hou, & Chang (2014)Effect Size(Hedges’s g)0.1160.2710.5510.663Effect SizeLower Limit-0.431-0.1010.0190.377Effect SizeUpper 000
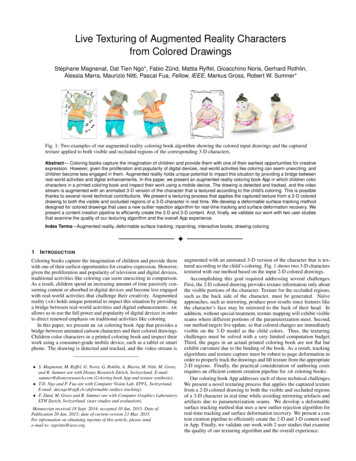
INTERNATIONAL JOURNAL OF ENVIRONMENTAL & SCIENCE EDUCATION9477The effect size calculated being positive was determined between 0.116 and1.968 (according to Hedges’s g). The effect size being positive shows that the valuesare in favor of the Study Groups in the studies conducted on the use of ARtechnology in education. The statistical significance was found as (p .05) in 11studies, while no differences were determined in 4 studies.The Forest Plot showing the Effect Direction of the Studies included in thisStudy are given in Figure 2 belowFigure 2. The forest plot showing the effect direction of the studies.The Forest Plot shows the general effect of the studies that are included in themeta-analysis and the general effects of the studies that are merged. According tothe Forest Plot in Figure 2, although the studies included in the study are inmedium level effect, it is observed that they are also distributed in lower effectlevel as well. In this context, it is also observed that the merged general effect levelof the studies is at the medium level.The findings of the combined effect size meta-analysis according to randomeffects modelThe combined effect size according to the Random Effects Model, standarderror, and the upper and lower limits according to 95% confidence interval onevaluating the AR applications in education are given in Table 4.Table 4Combined findings of the meta-analysis according to random effects model.ModelRandomEffects ModelCombinedEffect it0.863p.000According to Table 4, the data obtained in the 15 studies that were included inthe meta-analysis showed according to random effects model that the standarderror was 0.095, the upper limit of the 95% confidence interval was 0.863 and thelower limit was 0.491; and the effect size was ES 0.677 showing that the effect ofthe AR applications in education are high. Since the effect size value is between0.40 – 0.75 according to Thalheimer and Cook (2002) classification, the effect size
9478TEKEDERE & GÖKERis at medium level. In addition, it was reported that the result was statisticallysignificant with p .000. In other words, it was determined that the applicationsin which AR is used in education had positive effects on students, and that thiseffect was at a level that could not be underestimated.It has been observed in recent years that, although AR technology is relativelynew, the use of it in education has increased in the last five years. The interactiveAR books, educative AR games, discovery-based learning, object-modeling, andvocational skill training may be given as examples for the widespread use of ARtechnologies in education (Yuen, Yaoyuneyong, & Johnson, 2011). When the otherstudies conducted on the use of AR technologies in education are examined, it isobserved that the results are similarly positive. When the studies that areconducted on the use of AR technology in education are examined, it is reportedthat they increase academic success (Chiang, Yang, & Hwang, 2014), increasemotivation for the classes (Martin-Gutierrez & Fernandez, 2014; Di Serio, Ibanez,& Kloos, 2013.), making the abstract and symbolic concepts become concrete ones(Bai, Blackwell, & Coulouris, 2013), providing enjoyable game medium with ARgames (Squire & Jan, 2007), increasing imagination and creativity (Klopfer &Yoon, 2004) and showing the astronomical events and dangerous experiments,which are not possible in the real world (Shelton & Hedley, 2002), which supportthe findings of the present study. Among the studies that were examined, onlyDünser, Steinbügl, Kaufmann and Glück (2006) stated that the use of ARtechnology in engineering was not efficient.Conclusions and suggestionsIn meta-analyses, the analysis of the analysis is performed. In this metaanalysis study, the efficiency of the use of AR technologies in education has beeninvestigated. Since the Q value was determined as being bigger than the criticalvalue upon the homogeneity test (Q 35.692 23.68479), it has been determinedthat there was heterogeneity among the studies, and the Random Effects Modelwas used in the combination of the studies. After the combination, in the RandomEffects Model, the general effect size of the 15 studies that were included in themeta-analysis was calculated as ES 0.677 [0.491- 0.863]. According to Thalheimerand Cook (2002) classification, the effect size obtained was within the 0.40 d 0.75 range, and therefore, it was determined as being at medium level. This resultshows that the use of AR technologies in education is efficient, successful resultsare obtained, and that the results are statistically significant.The quality of the general effect obtained in meta-analysis studies depend onthe studies included in the analysis. Since the studies that were included in theanalysis were selected from the journals indexed in SCI and SSCI indices, it ispossible that the quality of the findings is high. In addition, it was determinedthat the application of AR technologies in education had positive effects onstudents, and that this effect is at a level. One of the benefits of the meta-analysisstudies is the expansion of the sampling size (Ellis, 2012). The size of the samplingbeing higher increases the validity and reliability of the studies (Cumming, 2012).In the end of this study, the sampling of the analysis increased to 1560 with thecombining of the previous studies conducted on the use of AR technologies ineducation. In addition, when the studies were examined one by one, statisticalsignificance was observed in 11 studies (p .05). No significant differences weredetermined in 4 studies. On the other hand, it was observed that the number of
INTERNATIONAL JOURNAL OF ENVIRONMENTAL & SCIENCE EDUCATION9479the studies in which the use of AR technologies in education were examined andreleased in SCI and SSCI indexed journals increased in recent years. It wasdetermined that these studies (171 studies) were mainly released in Computers &Education Journal (21 studies). This journal was followed by InternationalJournal of Engineering Education (9 studies), Neurosurgery (6 studies),Multimedia Tools and Applications (4 studies) and Universal Access in theInformation Society (4 studies). It was also determined that the number of thestudies that were published on this subject in other journals was between 1 and3.The analysis was made only with 15 studies out of 171 studies because thestatistical data needed for the calculation of effect coefficient (n, x, t, ss etc.) weremissing. For this reason, it is recommended that future studies that will beconducted on the subject will be examined in the future, and classified accordingto the outcomes of the AR applications in different classes (academic success,attitude, problem solving skills etc.), and also the results must be compared. Inaddition, when the subjects of the studies were examined it was observed that theAR applications in social sciences classes were limited (Cheng & Tsai, 2012), andthere are only a few studies on the use of AR applications in the education of thehandicapped (Bai, Blackwell & Coulouris, 2013; Lin & Chang, 2015). The fields ofSocial Sciences and the Education of the Handicapped are recommended for futureauthors who will examine AR applications.References11References marked with an asterisk indicate studies included in the meta-analysis.Borenstein, M., Hedges, L. V., Higgins, J. P. T., & Rothstein, H. R. (2009). Introduction to metaanalysis. West Sussex-UK: John Wiley & Sons Ltd.*Cai, S., Chiang, F. K., & Wang, X. (2013). Using the augmented reality 3D technique for a conveximaging experiment in a physics course. International Journal of Engineering Education, 29(4),856-865.Cai, S., Wang, X., & Chiang, F. K. (2014). A case study of augmented reality simulation systemapplication in a chemistry course. Computers in Human Behavior, 37, 31-40.Card, N. A. (2012). Applied meta-analysis for social science research. New York: The Guilford Press.*Chen, C. M., & Tsai, Y. N. (2012). Interactive augmented reality system for enhancing libraryinstruction in elementary schools. Computers & Education, 59(2), 638-652.Chiang, T. H., Yang, S. J., & Hwang, G. J. (2014). An augmented reality-based mobile learning systemto improve students’ learning achievements and motivations in natural science inquiryactivities. Journal of Educational Technology & Society, 17(4), 352-365.Cohen, J. (1988). Statistical power analysis for the behavioral sciences (2 nd. edition). New Jersey:Lawrence Erlbaum Associates, Inc.Cooper, H., Hedges, L. V., & Valentine, J. C. (Eds.). (2009). The handbook of research synthesis andmeta-analysis (2nd ed.). New York: Russell Sage Publication.Cumming, G. (2012). Understanding the new statistics. New York: Routledge, Taylor and FrancisGroup.Çarkungöz, E., & Ediz, B., (2009). Meta Analizi. Uludağ Üniversitesi Veteriner FakültesiDergisi, 28(1), 33-37.Dinçer, S. (2013). Meta-analize gir
INTERNATIONAL JOURNAL OF ENVIRONMENTAL & SCIENCE EDUCATION 2016, VOL. 11, NO. 16, 9469-9481 Examining the Effectiveness of Augmented Reality Applications in Education: A Meta-Analysis Hakan Tekederea, Hanife Gökera aGazi University, TURKEY ABSTRACT In this study, the purpose is examining the reviews released on augmented reality applications