Transcription
2Causes and Consequences of Polarization*Michael Barber and Nolan McCartyRarely these days does a news cycle pass without new stories of political dysfunction inWashington, DC. New reports of stalemates, fiscal cliffs, and failed grand bargains have begun toerode the public confidence in the ability of our representative institutions to govern effectively.In May 2013, only one American in six approved of the way Congress has handled its job.1 Sadly,that level of support was a major improvement from the previous summer, when wrangling overthe usually routine matter of raising the debt ceiling drove congressional approval down to 10%.The most common diagnoses of Washington’s ailments center on the emergence ofexcessive partisanship and deep ideological divisions among political elites and officeholders.In short, “polarization” is to blame. Consequently, the reform-minded have taken up the mantleof reducing polarization or mitigating its effects. In recent years, proposals for electoral reformto change electoral districting, primary elections, and campaign finance have been presentedas panaceas. Other reformers have focused on changing legislative procedures such as thoserelated to the filibuster, appropriations, and confirmation process to limit the opportunities forpolarization to undermine government.Although there has been intense public discussion about the causes of polarization, itsconsequences, and possible cures, social science research has only recently begun to help shapethose discussions. The intent of this chapter is to provide a more evidence-based foundation forthese debates.PreliminariesThe academic study on partisanship and polarization is based on a combination of qualitativeand quantitative research. Noteworthy qualitative accounts, which often combine historicalresearch and participant observation, include Rohde (1991), Sinclair (2006), Hacker and Pierson(2006), and Mann and Ornstein (2012).The starting point for many quantitative studies of polarization is the robust observation ofrising partisan differences in roll-call voting behavior in Congress. The bipartisan coalitions ofthe 1950s and 1960s have given way to the party-line voting of the twenty-first century. Although*This piece was shaped profoundly by discussions of the American Working Group of the APSA Task Force on NegotiatingAgreement in Politics. This group includes Andrea Campbell, Thomas Edsall, Morris Fiorina, Geoffrey Layman, James Leach, FrancesLee, Thomas Mann, Michael Minta, Eric Schickler, and Sophia Wallace. We also thank Chase Foster for his assistance with the ericans-down-congress-own-representative.aspx.Task Force on Negotiating Agreement in Politics19
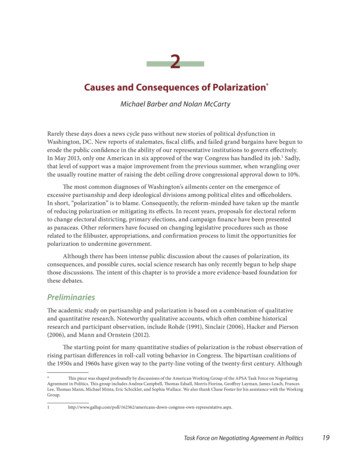
these trends are apparent in simple descriptive statistics about partisan divisions on roll calls,political scientists have developed more refined measures of partisan voting differences. A varietyof techniques uses data on roll-call voting to estimate the positions of individual legislatorson a set of scales.2 The primary scale—the one that explains most of the variation in legislatorvoting—generally captures partisan conflict. At the individual-legislator level, positions on thesescales reflect a mix of ideological positioning and constituency interest as well as party loyaltyand discipline. Political scientists continue to debate the exact weights of these factors. Somescholars argue that the scores primarily capture ideological differences (e.g., Poole 2007), whereasothers interpret them as measures of partisanship (e.g., Lee 2009). Without taking a position onthis debate, we refer to the primary roll-voting scale as the “party-conflict dimension.”3 However,consistent with common usage, we may also label positions on the scale as liberal, moderate, orconservative.All of these techniques for estimating the party-conflict dimension produce similarfindings with respect to polarization. Consequently, we focus on the DW-NOMINATE measuresdeveloped by McCarty, Poole, and Rosenthal (1997). Generally, these scores range from -1 to 1and are scaled so that the highest scores are those of conservative Republicans and the lowest arethose of liberal Democrats.Given the estimated positions of legislators on this scale, we can measure partisanpolarization by computing the difference in means (or medians) across the political parties,where a larger gap indicates a greater level of polarization. Figure 2.1 presents the difference inparty means on the party-conflict scale from 1879 through 2011.Figure 1: Polarization in Congress.6.2.4Polarization.81Average Difference on Party Conflict Scale18781894191019261942YearPolarization in House1958197419902006Polarization in SenateFigure 2.1: Average Distance between Positions across Parties. The y-axis shows the difference in meanpositions between the two parties in both the House of Representatives and Senate from 1879 to 2011 usingthe DW-NOMINATE measures. Congress is more polarized than it has been in over 125 years.From the 1930s until the mid-1970s, these measures of polarization were quite low. Notonly were differences between the typical Democratic and Republican legislators small, but there2See Poole and Rosenthal (1997); Groseclose, Levitt, and Snyder (1999); Clinton, Jackman, and Rivers (2004).3It is important, however, to distinguish these scores from party loyalty. Some members who have extreme positions on thesescales are not always loyal partisans (e.g., “Tea Party” Republicans).20American Political Science Association
also were significant numbers of conservative Democrats and liberal Republicans. Since the1970s, however, there has been a steady and steep increase in the polarization of both the Houseand Senate. Other measures of party conflict confirm the trend of increasing polarization in thepast 40 years.4Although conventional wisdom often asserts that polarization resulted from the changingbehavior of both parties (i.e., with Democrats moving to the left and Republicans to the right),the evidence shows that the behavioral changes are far from symmetric and are largely driven bychanges in the positioning of the Republican Party.5Figure 2.2 plots the average positions of the parties by region. In the past 40 years, themost discernible trend has been the marked movement of the Republican Party to the right (forqualitative evidence, see Hacker and Pierson 2006; Mann and Ornstein 2012). It is important tonote that the changes in the Republican Party have affected both its Southern and non-Southernmembers. The movement of the Democratic Party to the left on economic issues in the past50 years is confined to its Southern members—reflecting the increased influence of AfricanAmerican voters in the South. However, it is important that the implied asymmetry may pertainonly to the issues (primarily economic) that dominate the congressional agenda. It may well bethe case that on some social issues (e.g., gay marriage), polarization is the result of Democratsmoving to the left.Figure 2.2: Mean Party-Conflict Score by Party and Region. The y-axis shows the mean position of each party byregion. In this plot, the South is defined as AL, AR, FL, GA, KY, LA, MS, NC, OK, SC, TN, TX, and VA. There were noSouthern Republican Senators between 1913 and 1960 and only two before that.4Although Figure 2.1 shows a steady movement by the average Republican, the Republican caucus in Congress has not becomemore homogeneous in the same time period. The standard deviation of Republican ideal points has remained around 0.15 since the 1950s.Democrats, conversely, have become much more homogeneous in the same period with the disappearance of conservative southernDemocrats.5For a discussion of methodological issues underlying this claim, see Hare, McCarty, Poole, and Rosenthal 2012.Task Force on Negotiating Agreement in Politics21
Another important aspect of the increase in party polarization is the pronounced reductionin the dimensionality of political conflict. Many issues that were once distinct from the partyconflict dimension have been absorbed into it. Poole and Rosenthal (1997) and McCarty, Poole,and Rosenthal (1997) both noted that congressional voting can be increasingly accounted for bya single dimension that distinguishes the parties. This situation directly contrasts with that ofthe mid-twentieth century, when the parties divided internally on a variety of issues primarilyrelated to race and region. Figure 2.3 quantifies these changes, showing the percentage ofindividual roll-call vote decisions in the House that can be correctly classified by one- and twodimensional models. 6 The two-dimensional spatial model accounts for most individual votingdecisions since the late nineteenth century. Classification success was highest at the turn of thetwentieth century, exceeding 90 percent. However, the predictive success of the two-dimensionalmodel fell during most of the twentieth century, only to rebound to the 90% level in recent years.7Increasingly, most of the work is being done by the party-conflict dimension. In the periodfrom 1940 to 1960, adding a second dimension to account for intraparty divisions on race andcivil rights led to a substantial improvement to fit. A second dimension often explained anadditional 3% to 6% of the voting decisions in the House. However, in recent years, the seconddimension adds no additional explanatory value. In the 112th Congress, the second dimensionexplains only an additional 1,800 votes of the almost 600,000 cast by House members.Although polarization and the reduction in dimensionality tend to coincide, there is nonecessary logical connection between the two trends. One possibility is that partisan polarization6When legislators cast a vote in the way that is predicted by their estimated position on the scales, we say their vote is “correctlyclassified.” Therefore, the figure simply plots the total number of correctly classified votes divided by the total number of votes in a givencongressional session. Patterns for the Senate are similar.7The high rates of classification success that we observe do not result simply because most votes in Congress are lopsided votes,where members say “Hurrah.” On the contrary, Congress continues to have mostly divisive votes, with average winning majorities between60% and 70%.22American Political Science Association
might occur simultaneously across any number of distinct dimensions. For example, partiescould polarize on distinct economic and social dimensions. However, this would imply varyingintraparty disagreements on the different dimensions. To the contrary, the evidence points tosimilar intraparty cleavages on almost all issues. For example, the most anti-tax Republicanlegislators are generally the most pro-life, pro-gun, and anti-marriage equality. Similarly, theDemocrats most likely to support a minimum-wage hike are those most supportive of abortionrights and gay marriage. Using the terminology of Converse (1964), issue constraint at thecongressional level has expanded dramatically.A second logical alternative is that polarization might coincide with the displacementof the primary dimension of partisan conflict by another issue dimension, consistent with thetheory of realignments put forward by Schattschneider (1960), Burnham (1970), Sundquist(1983), and others. Such a situation also seems inconsistent with the data on roll-call voting. AsMcCarty, Poole, and Rosenthal (2006) documented, the partisan division on economic issueshas remained the primary dimension of conflict, and other issues—such as social, cultural, andreligious issues—have been absorbed into it.Although there is a broad scholarly consensus that Congress is more polarized than anytime in the recent past, there is considerably less agreement on the causes of such polarization.Numerous arguments have been offered to explain the observed increase in polarization, andthese causes can be divided into two broad categories: (1) explanations based on changes to theexternal environment of Congress, and (2) those based on changes to the internal environment.The external explanations provide arguments about how shifts in the social, economic, andelectoral environments have altered the electoral incentives for elected officials to pursuemoderation or bipartisanship. The internal explanations focus on how the formal and informalinstitutions of Congress have evolved in ways that exacerbate partisan conflict (or generate theappearance of such an increase). Although we think it is productive to divide the literature alongexternal-internal lines, it is important to note that explanations are not mutually exclusive.Indeed, many of the internal explanations presume a shift in the external environment thatstimulates revisions of legislature rules, procedures, and strategies.In the following sections, we review the current literature on each of these suggested causesand evaluate the evidence for and against each argument.External ExplanationsA Polarized ElectoratePerhaps the simplest explanation for an increasingly polarized Congress is one grounded inthe relationship between members of Congress and their constituents. If voters are polarized,reelection-motivated legislators would be induced to represent the political ideologies of theirconstituents, resulting in a polarized Congress. Evidence of voter-induced polarization is elusive,however.Empirical support for the voter-polarization story requires evidence for two specific trends.First, it requires that voters be increasingly attached to political parties on an ideological basis.Liberal voters should increasingly support the Democratic Party and conservative voters shouldincreasingly support the Republican Party. This process has been labeled partisan sorting. Second,Task Force on Negotiating Agreement in Politics23
the hypothesis requires that voters must be increasingly polarized in their policy preferences orideological identification. Extreme views must be more common so that the distribution of voterpreferences becomes more bimodal.There is considerable evidence for the first trend—voters have become better sortedideologically into the party system. Layman and Carsey (2002) and Levendusky (2009) found thatover time, voters have increasingly held political views that consistently align with the parties’policy positions. Using data from the National Election Study, Layman and Carsey (2002) foundevidence for a pattern of conflict extension, in which differences in the policy preferences ofpartisans have grown in economic as well as social and racial domains. Their results, updatedthrough 2004, are presented in Figure 2.4.The trends presented in Figure 2.4 are consistent with the finding that fewer voters todaythan in the past hold a mix of Democratic and Republican positions. As the parties become morecoherent in their policy positions, voters sort themselves accordingly. This may well accountfor the finding of Bartels (2000) that partisan identification is a better predictor of votingbehavior. Also, because the terms “Republican” and “Democrat” now represent increasinglydistinct clusters of policy positions, citizens who identify with one party expect the other party’sidentifiers to hold dramatically different political views. Consequently, party identifiers reportthat they dislike one another more than they did a generation ago (Shaw 2012) and state that theywould be less likely to feel “comfortable” with their child marrying someone who identifies withthe opposite party than was the case in the 1960s (Iyengar, Sood, and Lelkes 2012).24American Political Science Association
Fiorina (2013) argues that the patterns described herein reflect party sorting and notpolarization in voters’ policy positions. A lively debate has emerged about the mechanismsunderlying the better sorting of voters into parties. Sorting may improve for two distinctreasons. First, voters may shift their allegiance to the party that takes their policy position.Alternatively, voters may adjust their policy views to match those of the party with which theyidentify. Levandusky (2009) found evidence for both mechanisms but determined that positionswitching is more common than party switching. Carsey and Layman (2006) also found thatparty switching does occur, but that it is limited to those voters who have a salient position onone issue and are aware of the partisan differences surrounding it. However, Lenz (2012) findslittle evidence favoring the party-switching mechanism. Ultimately, however, both processes arefacilitated by greater polarization of partisan elites, suggesting that the trends in Figure 2.4 maybe the consequence of elite polarization rather than the cause. 8Whereas few scholars doubt that substantial voter sorting has occurred, the evidence forvoter-policy polarization is less clear. The emerging consensus is that most voters have beenand remain overwhelmingly moderate in their policy positions (Fiorina, Abrams, and Pope2005; Ansolabehere, Rodden, and Snyder 2006; Fiorina and Abrams 2008; Levendusky, Pope,and Jackman 2008; Bafumi and Herron 2010). In studies that produce estimates of voter-issuepositions that are comparable to legislator positions, representatives were found to take positionsthat are considerably more extreme than those of their constituents (Clinton 2006; Bafumi andHerron 2010).8McCarty, Poole, and Rosenthal (2006) and Gelman (2009) also found that voters have become better sorted into parties by income over time. The question of whether partisan voters are more sorted by geography is controversial (see Bishop 2009; Klinkner 2004).Task Force on Negotiating Agreement in Politics25
Figure 2.5 illustrates the main finding of Bafumi and Herron (2010). In the 109th Congress,almost every Senator was more extreme than the median voter of his or her state. The ideologicaldistance between representative and constituent may well have increased, but some distanceseems to have existed since the introduction of our earliest measurements. As early as 1960,McClosky and his colleagues found that delegates to the party conventions took positions thatwere more extreme than those of the voters identifying with each party.9 Recently, Abramowitz(2010) found a more bimodal distribution of preferences among those voters most likely toparticipate in politics compared to the average party identifier, with further polarization stillamong party activists and donors.10 The phenomenon of the more-and-more active beingmore-and-more extreme probably results in part from self-selection, with those having intensefeelings being more willing to spend time and money on politics, and in part from the dynamicof group polarization (Sunstein 2002), in which people who talk with one another in relativelyhomogeneous groups end up taking more extreme positions than the party’s median members.Regarding moderate voters, some have chosen middle-of-the-road positions for substantivepolicy reasons. Others, however, are uninformed, unengaged, or apathetic, checking off themiddle position on surveys due to lack of an opinion.Although the lack of evidence of voter polarization casts doubt on the simple link betweenvoter and elite polarization, a dynamic version may hold more promise. As voters sort inresponse to elite polarization, the incentives for parties to take positions that appeal to supportersof the other party will diminish. This leads to greater partisan polarization and greater incentivesfor voters to sort. Although this mechanism is not ruled out by existing evidence, it has not yetbeen subjected to formal tests.Southern RealignmentAlthough Americans still appear to remain overwhelmingly moderate, there is no denying thatdramatic changes have occurred in terms of policy sorting between the parties. The realignmentof the South from a solidly Democratic region to one dominated by Republicans is the starkestexample of the sorting of ideology and partisanship.Figure 2.6 places the Southern realignment in the context of the national story ofpolarization. The left-hand panel shows that since the 1970s, there has been a dramatic increasein the number of Republicans representing Southern districts in the House of Representatives.As these Republicans replace more moderate Democrats, we see two effects. First, the medianSouthern Democrat becomes more liberal. By the early 2000s, most of these Democrats wererepresenting majority-minority districts. At the same time, the new Southern Republicans werebecoming increasingly conservative. However, the right-hand panel in the figure shows that theconservative path of Southern Republicans is mirrored in non-Southern districts. Thus, to blamepolarization completely on the disappearance of conservative Democrats would be to ignore theconservative trajectory of non-Southern Republicans. The movement in the median ideologyof Democrats, however, can be nearly accounted for by the replacement of moderate SouthernDemocrats with Republicans.9See McClosky, Hoffman, and O’Hara (1960).10Based on surveys of convention delegates, Layman et al. (2010) found evidence consistent with activists taking more extremepositions over time.26American Political Science Association
Whereas much attention has been focused on the effects of the Southern realignmentfor the emergence of a conservative Republican party in the South, the post–Voting RightsAct increase in the descriptive representation of African Americans and Latinos in the Housealso had a discernible effect on polarization. Although the representatives of these groups arehardly monolithic, they are overrepresented in the liberal wing of the Democratic Party; anyleftward movement of the Democrats can be accounted for by the increase in the number AfricanAmerican and Latino representatives.11GerrymanderingScholars have long suggested that allowing state legislatures to draw congressional districts maylead to overwhelmingly partisan and safe districts that free candidates from the need to competefor votes at the political center (Tufte 1973; Carson et al. 2007; Theriault 2008a). However,the evidence in support of gerrymandering as a cause of polarization is not strong. First, weconsider the Senate and those states in which there is only one congressional district. In thesecases, gerrymandering is impossible because the district must conform to the state boundaries.Yet, in the Senate and in at-large congressional districts, we observe increasing polarization(McCarty, Poole, and Rosenthal 2006). Furthermore, McCarty, Poole, and Rosenthal (2009)generated random districts and determined the expected partisanship of representatives fromthese hypothetical districts given the demographic characteristics of the simulated district. Theresult was that the simulated legislatures generated by randomly creating districts are almostas polarized as the current Congress. This finding holds because polarization relates moreto the difference in how Republicans and Democrats represent moderate districts than theincrease in the number of extreme partisan districts. Therefore, an attempt to undo partisan11McCarty, Poole, and Rosenthal (2006) found that African American and Latino House members have more liberal DW-NOMINATE scores, even after controlling for party and the ethnic and racial composition of their districts. However, roll-call–based measuresof the positions of minority legislators may understate those members’ contribution to increasing the diversity of interests represented inCongress. The difference between white and minority legislators is larger on other legislative activities, such as oversight, bill co-sponsorship, and advocacy (Canon 1999; Tate 2003; Minta 2009; Minta and Sinclair-Chapman 2013; Wallace 2012).Task Force on Negotiating Agreement in Politics27
gerrymandering with moderate, competitive districts still leads to a polarized legislature, due tothe difference between rather than within the parties.Figure 2.7 illustrates this argument. The plot shows the ideal points of members of the111th House of Representatives and the 2008 Democratic percentage of the presidential votein that district. Scholars frequently use presidential vote shares as a proxy for district ideologybecause the vote shares allow for a unified measure of political preferences across the country atany one point in time. Thus, a district with a larger Democratic vote share is interpreted to havemore liberal constituents than a district that has a smaller Democratic vote share. Members ofCongress from the same party vote quite similarly, even though they represent districts withvastly different political preferences. This difference is illustrated by the regression lines drawnin the figure for each party. Democrats who represent districts that split almost evenly in thepresidential vote are not significantly more conservative than Democrats representing districtsthat overwhelmingly supported Obama in 2008. However, there is a dramatic difference in howrepresentatives of the opposing parties represent districts with identical presidential vote shares.This figure does not support the argument that gerrymandering is producing districts thatcontain heavy partisan majorities, thereby leading to extreme representatives. Rather, more ofthe observed polarization can be explained by the differences between the parties in relativelymoderate and competitive districts.Representative Ideal Point and Presidential Vote1.5RR RRR RRRRR RR RRR RRRRR RRRRRRRRRRRR RRR RRRRRRRRRRRRR RRRRR R RRRRRRRRR R RR R RRRRRRRRRRRRRR RRRRRRRRRRR RRR R RR RRR RDDDDDDDDDDDDDDDDDDD D DDDDD DDDDDDDDDDDDDDDD DDDDDD DDD DDDDDDDDDDDDDDDDDDDDDDDDDDDDDDDDDDDDDDDDDDDD DDDDDDDDDDDDDDDDDDDDDDDDDDDDDDDDDDDDDDDD DD DDDDDDD DDDDD DDDDDDDDDDD DDD DDDDDDDDDDDDDDDDDDDDDD DDDDDDDDDDDDDDDDDDDDD DD DD DDD DDDDDRepresentative Ideal Point1.00.50.0-0.5-1.0-1.502550751002008 Presidential Vote in Congressional DistrictFigure 2.7: Representative Position on the Party Scale and Presidential Vote Share. The x-axis shows the partisanship of thecongressional district as measured by the Democratic percentage of the 2008 presidential vote. The y-axis is the representative’sDW-NOMINATE score for the 111th House of Representatives. There are major differences in the way Republicans andDemocrats represent similar districts. These differences account for a larger share of the aggregate party difference than thedifferences in the types of districts that Democrats and Republicans represent.28American Political Science Association
Primary ElectionsGiven the extent to which voters are now ideologically sorted into political parties, someobservers suggest that only conservatives can win Republican primaries and only liberals canwin Democratic primaries.12 This suggested feature of contemporary politics has led reformersto focus on whether the rules governing participation in primaries might be altered to make itpossible for more moderate candidates to win nominations. The standard recommendation is tomove from closed partisan primaries to open primaries, which would allow the participation ofindependents. The state of California has recently gone one step further with the nonpartisan“top-two” primary, in which voters of both parties cast ballots for candidates of either party andthe top two vote-getters move to the general election.Based on the historical record, it is implausible that partisan primaries are a major cause ofpolarization. Polarization increased during the past 40 years despite the opening up of primariesto nonpartisans (McCarty, Poole, and Rosenthal 2006). The narrower question of whether openor nonpartisan primaries would reduce contemporary levels of polarization continues to be anactive area of research, but the evidence to date provides sparse support for the argument thatopening primaries to nonpartisans would reduce polarization.A few studies have found evidence for a polarizing effect of partisan primaries. Kaufmann,Gimpel, and Hoffman (2003) found that presidential primary voters in states with open primarieshold political ideologies similar to the general electorate, whereas in states with closed primaries,the two electorates are more ideologically distinct. Gerber and Morton (1998) found that thepositions of legislators nominated in open primaries hew more closely to district preferences,whereas Brady, Han, and Pope (2007) found that legislators who hew closely to the generalelection electorate suffer an electoral penalty in primaries.However, most of the research suggests that the effects of moving to open-primary systemsare modest at best. Hirano et al. (2010) studied the history of primary elections for the US Senate.Their findings cast significant doubt on the role of primary-election institutions in polarization.First, the introduction of primaries had no effect on polarization in the Senate. Second, despitethe common belief that participation in primaries has been decreasing, they found that primaryturnout has always been quite low. Thus, it is doubtful that changes in primary participationcan explain the polarizing trends of the past three decades. Third, they find no econometricevidence that either low primary turnout or low primary competition leads to the polarization ofsenators. Using a panel of state-legislative elections, Masket et al. (2013) investigated the effectsof changing primary systems and found little evidence that such switches affect polarization.Similarly, Bullock and Clinton (2011) investigated the effects of California’s short-lived movefrom a closed primary to a blanket primary, in which any registered voter can participate. Theyfound that the change did lead to more moderate candidates in competitive districts but thatthese effects were not observed in districts that were dominated by either of the parties. Thisresult suggests that the recent change in
20 American Political Science Association these trends are apparent in simple descriptive statistics about partisan divisions on roll calls, political scientists have developed more refined measures of partisan voting differences.