Transcription
International Journal of Computational Intelligence and Informatics, Vol. 6: No. 3, December 2016Forecasting Stock Trend Using Technical Indicatorswith RJ. Sharmila VaizM. RamaswamiDepartment of Computer ApplicationMadurai Kamaraj UniversityMadurai, Indiajsharmilavaiz@gmail.comDepartment of Computer ApplicationMadurai Kamaraj UniversityMadurai, Indiamrswami123@gmail.comAbstract- Technical analysis is a well proven method in monitoring the price action of free markets thathave broad participation in order to gain insight into the future price trend. This paper attempts to studyon the effectiveness of several technical indicators on share trading to assess the company financialperformance over period of time. The major technical indicators in Technical analysis includes MovingAverages, Moving Average Convergence/Divergence, Average Directional Index, Trend Detection Index,Aroon Indicator, Vertical Horizontal Filter, Relative Strength Index, Stochastic, Stochastic MomentumIndex, Williams %R, Commodity Channel Index, Chande’s Momentum Oscillator, Bollinger Bands,Average True Range, Donchain Channel, Chaikin Money Flow, On balance Volume and Money FlowIndex. This study will help the investors to gain knowledge about the usage of these technical indicators soas to increase their proportion of profitable trading and improve investment returns.Keywords - technical indicators, trend, momentum, volatility, volume, charts, price trend1. INTRODUCTIONForecasting the trend of future stock prices is most widely studied topic in many fields including stocktrading, finance, statistics and computer science. The motivation behind the forecasting is naturally to predictthe direction of future prices such that stocks can be bought and sold at profitable positions. The methods usedto analyze securities and make investment decisions fall into two very broad categories: fundamental analysisand technical analysis (Larsen, 2007). The fundamental analysis is traditional approach that attempts todetermine a security’s value by focusing on underlying factors that affect a company's actual business and itsfuture prospects. The technical analysis, on the other hand, is the evaluation of securities/assets by means ofstudying statistics generated by market activity, such as past prices and volume. Therefore, technical analysis isthe analysis of human mass psychology and it is also called behavioral finance. Experts of technical analysisstudy price charts for price patterns and use price data in different technical indicators assessment to forecastfuture price movements. The technical analysis paradigm is thus that there is an inherent correlation betweenprice and company that can be used to determine when to enter and exit the market.Despite all kind of exotic tools in stock market, technical analysis really studies supply and demand ina market in an attempt to determine what direction, or trend, will continue in the future (Dahlquist, 2011).Furthermore, technical analysis attempts to understand the emotions in the market by studying the market itself.If we are able to understand the benefits and limitations of technical analysis, it can give a direction or skills thatwill enable us to be a better trader or investor in stock market.Also, technical analysis is all about studying stock price graphs and a few momentum oscillatorsderived thereof. It must be understood that technical studies are based entirely on prices and do not includebalance sheets, P&L accounts, the assumption being that the markets are efficient and all possible price sensitiveinformation is built into the price graph of a security/index (Larsen, 2007). In this paper, we are discussingmajor technical indicators which are using most predominately and study its performances in trend analysis.2. REVIEW OF LITERATUREThe Dow Theory laid the foundations for the modern technical analysis (Theory, 2015). Of the manytheorems put forth by Dow, three stand out: Price Discounts Everything (www.ifcmarkets.com, 2013), Pricemovements are not totally random and “What” is important than “Why”. Technical analysts believe that thecurrent price fully reflects all information. Because all information is already reflected in the price, it representsISSN: 2349-6363206
International Journal of Computational Intelligence and Informatics, Vol. 6: No. 3, December 2016the fair value, and should form the basis for analysis. Most of earlier research studies on technical analysisfocused on selective indicators and limits themselves with five/six indicators in their study.The applicability of certain computational measures like Beta calculation, Relative Strength Index andSimple Moving average (R, 2011) were discussed in stock analysis and also suggested various factors likeGovernment of India budget, company performance, political and social events, climatic conditions etc., are tobe considered before any decision is made in stock trading.The effectiveness of technical tools like Relative Stock Index (RSI) and chart patterns (Dhutti, 2014)were discussed elaborately in taking the investment decisions whether to buy or sell the stocks of five ITcompanies viz: Tata Consultancy Services (TCS), Infosys Limited, Wipro, Hindustan Computers TechnologiesLimited (HCL), Satyam Computers Limited (now Mahindra Satyam) of IT sector during the period of Jan-Dec2012. Further the author illustrated how statistical methods like coefficient of variation and beta are used toanalyze the risk and return relationship of security with the market. Four enriched technical indicators- RelativeStrength Index, Bollinger Bands, Moving Average Convergence/Divergence and Simple Moving Average(Vasantha S, 2012) used to take a decision on whether to buy or sell the stocks of the IT sector. Also it wasobserved that Moving Average Convergence Divergence (MACD) value helps to identify the scripts that aretechnically strong or not (V, 2015)and also showed that how MACD facilitates investors to recognize thecurrent trend and risks associated with the script at par with the market. He also confirmed that technicalanalysis can be used neither the bull side nor the bear side of the stock market, but it is only the right side ofthe stock market when to buy/sell the script.In recent study on major technical indicators conducted by (C, 2014) revealed that Candlestick chart,Exponential Moving average, RSI, MACD indictors are very helpful in making decisions to earn profit whileselling/buying stocks of five companies Wipro, SBIN, Gail, ONGC and ITC. The authors (Zhu, 2014)explainedthe effectiveness of the derived technical indicator called volume weighted moving average (VWMA) againstMoving average value. Further he endorsed that need for inclusion of volume information to technical indicatorsand its advantages over various matters like issuing of more trading signals, increasing the proportion ofprofitable trading, reduction in the average draw down, and improving investment returns etc., A study wasconducted on selected stocks from Thai stock market data and performed clustering analysis on that data andidentified that a group of stocks that has the best trend and further the study highlighted that momentumcharacteristics of these stocks indicates the outperformance of the market will be more during a short timeperiod (Peachavanish, 2016).Based on the survey of research work done by various authors , we observed that limited technicalindicators alone used in their study and the role of other reliable stock market technical indicators are notdiscussed so for. As a result, the following objected are framed. To study the effectiveness of major technical indicators in Indian stock market.To analyze the TVS Motor stock of NSE Mid Cap using technical indicators.To make clear picture of market behavior by using Technical indicators so as to increase their profit.3. METHODOLOGYTechnical analysis refers to a broad field and the list of technical market indicators is almost infinite.Hence it is grouped under four categories such as Trend indicators, Momentum indicators, Volatility indicatorsand Volume indicators (mwlibtoolkit, 2011). Each indicator dominates the other in predicting the trend ofdifferent types of stocks. For example, RSI may lead WPR in predicting trend of TVS Motor Stock and WPRmay lead RSI in predicting trend of Tata Motors Stock. This study aims at analyzing the impact of major 22technical indicators altogether on NSE Mid Cap Stock TVS Motor. Six months daily data of TVS Motor ofNSE Mid Cap index from January 2010 to June 2010 is used in this study. TVS Motor OHLCV (Open, High,Low, Close, Volume) is retrieved from NSE websites and yahoo finance (TradingGeek, 2014). Twenty twotechnical indicators are derived from OHLCV (Ulrich, 2016) are used in our case study. The gorgeous effect of22 technical indicators which are available in TTR package is explained in an unsophisticated manner inpredicting trend of the market. As the study describes about each indicators and its uses, investors can use this as207
International Journal of Computational Intelligence and Informatics, Vol. 6: No. 3, December 2016a reference in making decisions whether to buy or sell stocks, thereby increase their profit in their investment.They can also observe combination of these indicators such as Trend, Momentum, Volatility indicators to makeaccurate decisions.Fast and flexible technical analysis can be done with TTR package in R (TradingGeek, 2014).Performance of all technical indicators against data set is depicted in 2-D plot. R is a language and environmentfor statistical computing and graphics. R provides a wide variety of statistical and graphical techniques, and ishighly extensible. R Packages is also easy to learn and have all dependencies being installed automatically. Thegraphical capabilities of R are outstanding, providing a fully programmable graphics language that surpassesmost other statistical and graphical packages. Because R is open source, unlike closed source software, it hasbeen reviewed by many internationally renowned statisticians and computational scientists. The brief details ofall technical indicators in each group are explained below.3.1. Trend IndicatorsTrend indicators are used to measure the direction and strength of a trend using some form of priceaveraging to establish a baseline. As price moves above the average, it is a buy signal. If it moves below theaverage, it is a sell signal.3.1.1. Moving AveragesMoving Averages are very popular indicators of technical analysis (Larsen, 2007). These measuresare used to eliminate noise and identify trends by smoothing the data. It is broadly used because of itssimplicity and possibility to combine several moving averages together. There are different types of movingaverages - Simple moving average, Exponential moving average, Weighted moving average, DoubleExponential Moving Average and Volume Adjusted Moving Average (TradingGeek, 2014).Simple Moving Average(SMA):Simple moving average gives all the days equal weight. It is the maindisadvantage of Simple moving average.SMA n price1(1)nExponential Moving Average (EMA): Exponential moving average, unlike SMA gives higher priorityto the actual data. The current values get higher importance in the EMA calculation compared to the furthestones.EMA EMA( 1) K x input EMA 1where K 2(n 1)(2)Weighted Moving Average (WMA): Weighted Moving average gives higher importance to actual daysand lower importance to the furthest days usually. But the trader has to take decision which day should be moreor less significant.WMA price n price 1 n 1 price 2 n 2 price n 1 1n!(3)Double Exponential Moving Average: Double Exponential Moving Average follows the price graphcloser than most of other moving averages, so the lag is lower and the curve is not so choppy.DEMA 2 EMA n EMA EMA n(4)Volume Adjusted Moving Average(VAMA): The Volume Weighted Moving Average is a weightedmoving average that uses the volume as the weighting factor, so that higher volume days have more weight. It isa non-cumulative moving average, in that only data within the time period is used in the calculation.VAMA n price volume1n volume1(5)208
International Journal of Computational Intelligence and Informatics, Vol. 6: No. 3, December 2016In all moving averages, when close price is above its moving average then it indicates buy signal, whenit is below its moving average it signals to sell. The price and moving average will be frequent so the movingaverage curve can be followed, if it is rising, it is a buy signal else it is a sell signal.3.1.2. Moving Average Convergence/Divergence (MACD) Indicator:MACD was proposed by Gerald Appel. MACD is a momentum oscillator that indicates the dynamicsand strength of the current trend and oscillates around the zero line in both directions. MACD consists of threemoving averages. Their normal settings are 9, 12 and 26 (V, 2015).Zero Line Crossover - The strategy is to buywhen the MACD crosses above the zero line, and sell when the MACD line crosses below the zero line. SignalLine Crossover – The strategy is to buy when the MACD line crosses above the signal line else sell.MACD line 12 day EMA 26 day EMASignal line 9 day EMA of MACD lineWhere EMA Exponential Moving Average(6)3.1.3. Average Directional Movement Index (ADX)The Average Directional Index (ADX) was developed by Welles Wilder (Labs, 2016). TheADX isused to measure the strength or weakness of a trend, not the actual direction. Directional movement is definedby DI and -DI. The indicators, Plus Directional Indicator ( DI) and Minus Directional Indicator (-DI),complement ADX by defining trend direction. The DI is the percentage of the true range that is up. The -DI isthe percentage of the true range that is down.Used together, chartists can determine both the direction andstrength of the trend. The strategy is to buy when DI is greater than –DI and the strategy is to sell when -DI isgreater. Crosses of these directional indicators can be combined with ADX form a complete trading system.The trend is strong when ADX is above 25 and no trend is present when below 20. There appears to be a grayzone between 20 and 25. The values range from 0 to 100, but rarely get above 60. High value of ADX indicatesa strong trend and low value indicates a weak trend.ADX ADX 1 n 1 DXnDX DI ( DI )(7) DI ( DI )3.1.4. Trend Detection Index(TDI)The trend detection index (TDI) is used to detect when a trend has begun and when it has come to anend. The TDI can be used as a stand-alone indicator or combined with others; it will perform well in detectingthe beginning of trends (Labs, 2016). An uptrend is signaled by a positive direction indicator value, whereas adowntrend is signaled by a negative value. If both TDI and direction indicator are positive it is a buy signal andif the TDI is positive and the direction indicator is negative, it is a sell signal.20 day Trend Detection Index TDI AV20 (Σ AM40) (Σ AM20)where, AV20 absolute value of the sum of 20 day momenta of the last 20 daysΣ AM40 Sum of 20 day absolute momenta of the last 40 daysΣ AM20 Sum of 20 day absolute momenta of the last 20 days(8)3.1.5. Aroon Indicator(Aroon)The Aroon indicator, developed by technician Tushar Chande (Labs, 2016)and the word aroon inSanskrit means "dawn's early light."The Aroon indicator attempts to show when a new trend is dawning. Theindicator consists of two lines (Up and Down) that measure how long it has been since the highest high/lowestlow has occurred within an n period range.When the Aroon Up is staying between 70 and 100 then it indicatesan upward trend. When the Aroon Down is staying between 70 and 100 then it indicates a downward trend. Astrong upward trend is indicated when the Aroon Up is above 70 while the Aroon Down is below 30. Likewise,a strong downward trend is indicated when the Aroon Down is above 70 while the Aroon Up is below 30. Alsolook for crossovers. When the Aroon Down crosses above the Aroon Up, it indicates a weakening of the upwardtrend.AroonUP 100 n PeriodSinceHighestHighnAroonDown 100 n PeriodSinceLowestLown(9)209
International Journal of Computational Intelligence and Informatics, Vol. 6: No. 3, December 20163.1.6. Vertical Horizontal Filter (VHF)The Vertical Horizontal Filter was developed by Adam White (Labs, 2016) and it determines whetherprices are trending. When the VHF is rising, it indicates the formation of a trend.Higher VHF values indicate astronger trend. When the VHF is falling, it indicates the trend is ending and price is becoming congested.VHF HighestHigh LowestLow(10)n close i close i 11close i 13.2. Momentum IndicatorsMomentum indicators help traders to identify the speed of price movement by comparing prices overtime. This type of indicator is typically applied to price and it is used to analyze volume.3.2.1. Relative Strength Index (RSI)The Relative Strength Index (RSI) was developed by J. Welles Wilder (TradingGeek, 2014) and itcalculates a ratio of the recent upward price movements to the absolute price movement. The RSI ranges from 0to 100. If RSI value is above 70 it indicates overbought and if it is below 30 it indicates oversold. If the price ismaking new highs/lows, and the RSI is not, it indicates a reversal.𝑅𝑆𝐼 100 𝑢𝑝𝑎𝑣𝑔(11)𝑢𝑝𝑎𝑣𝑔 𝑑𝑛𝑎𝑣𝑔where 𝑢𝑝𝑎𝑣𝑔 upavg n 1 updownavg n 1 dnand 𝑑𝑜𝑤𝑛𝑎𝑣𝑔 nn3.2.2. Stochastic Oscillator(stoch)The Stochastic Indicator was developed by George C. Lane. (Dahlquist, 2011). It measures relationbetween close and the recent trading range. The values range from 0 to 100. %D values over 75 indicate anoverbought condition; values under 25 indicate an oversold condition. When the Fast %D crosses above theSlow %D, it is a buy signal; when it crosses below, it is a sell signal. The Raw %K is generally considered tooerratic to use for crossover signals.%K 100 Close LowestLow (last n periods )HighestHigh(12)last n periods LowestLow (last n periods )%D Moving Average(%K)3.2.3. Stochastic Momentum Index(SMI)Stochastic Momentum Index was developed by William Blau (Labs, 2016). The SMI is considered arefinement of the stochastic oscillator. It is a more reliable indicator, less subject to false swings. It calculatesthe distance of the current closing price as it relates to the median of the high/low range of price.The SMI has anormal range of values between 100 and -100. Like the stochastic oscillator, the SMI is primarily used bytraders or analysts to indicate overbought or oversold conditions in a market. Traders also use the SMI as ageneral trend indicator, interpreting values above 40 as bullish trend and negative values greater than -40 asbearish trend.SMI 100 cmhl2,Signal EMA SMIwhere hl HighestHigh LowestLow, and 𝑐𝑚 𝑐𝑙𝑜𝑠𝑒 (13)ℎ𝑙23.2.4. William%R– Williams Percentage Range(WPR)Williams Percentage Range was developed by Larry Williams (Dahlquist, 2011). It is very similar to RSIand Stochastic so it shouldn’t be used in conjunction with them. It is used to identify the oversold andoverbought levels and the proper entry points. The default setting for Williams%R is 14 periods which can bedays, weeks, months or an intraday timeframe. Indicator value move in the range of 0 to -100. Values below 80 means that the asset is oversold and its value will probably rise. Values above -20 mean that the asset isoverbought and its value will probably fall. Some of the technical analysis prefer to use W%R with the settingsto -50 points upwards/downwards instead of -80/-20 values.210
International Journal of Computational Intelligence and Informatics, Vol. 6: No. 3, December 2016%R 100 HighestHigh (last n periods ) clos e(14)HighestHigh (last n periods ) LowestLow (last n periods )3.2.5. Chande’s Momentum Oscillator (CMO)The Chande’s Momentum Oscillator was developed by Tushar S. Chande (Labs, 2016). The ChandeMomentum Oscillator is a modified RSI. Where the RSI divides the upward movement by the net movement(up / (up down)), the CMO divides the total movement by the net movement ((up - down) / (up down)).Values over 50 indicates a buy signal and values below 50 indicatesa sell signal.CMO 100 ups i downs iups i downs iwhereupsi ii nup and downsi ii ndown(15)3.2.6. Commodity Channel Index(CCI)Commodity Channel was created by Donald Lambert (Dahlquist, 2011).It shows Trading CyclicTrends and detect beginning and ending market trends. The range is 100 to -100 and the values outside thisrange indicate overbought or oversold conditions. If the price is making new highs, and the CCI is not, thenreversal of trend may occur.CCI TP ATP0.015 MD, Typical Price TP close high n low n3(16)MD Mean Deviation of ATP(Average Typical Price)3.3. Volatility IndicatorsVolatility indicators provide useful information about the range of buying and selling that take place ina given market information that can help the traders determine potential points where the market may changedirection. The following are the volatility indicators:3.3.1. Bollinger Bands(BBands)Bollinger Bands were developed by John Bollinger. Bollinger Bands consist of three lines(TradingGeek, 2014). The middle band is a simple moving average (generally 20 periods) of the typical price(TP). The upper and lower bands are F standard deviations (generally 2) above and below the middle band. Thebands widen and narrow when the volatility of the price is higher or lower respectively.Bollinger Bands do notgenerate buy or sell signals; they are an indicator of overbought or oversold conditions. When the price is nearthe upper or lower band it indicates there may be trend reversal. The middle band becomes a support orresistance level. The upper and lower bands can also be interpreted as price targets. When the price bounces offof the lower band and crosses the middle band, then the upper band becomes the price target.MidBand SimpleMovingAverage TPUpperBand MidBand Price σ TPLowerBand MidBand Price σ(TP)(17)3.3.2. Donchian channelIt is an indicator used in market trading developed by Richard Donchian (Labs, 2016). The Donchianchannel is a useful indicator for seeing the volatility of a market price. If a price is stable the Donchian channelwill be relatively narrow. If the price fluctuates a lot the Donchian channel will be wider. If a security tradesabove its highest n day high, then a long is established. If it trades below its lowest n day low, then a short isestablished.Enter long when price crosses above 20-day upper donchain channel and exit when price reaches 10day lower donchain channel. Enter short when price crosses below lower donchain channel and exit when pricereaches 10-day upper donchain channel. To do safe trading 25 day/350-day can be used as a trend filter. Enterlong only When 25-day EMA is above 350 day EMA, enter short only 25-day EMA is below 350-day EMA.Upper Channel Line n days high; Lower Channel Line: n days low; andCenter Line: (n days high n days low)/2(18)211
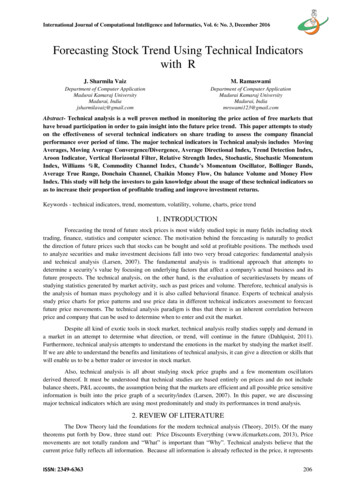
International Journal of Computational Intelligence and Informatics, Vol. 6: No. 3, December 20163.3.3. Average True Range (ATR)The ATR was developed by J. Welles Wilder (Labs, 2016). It is the moving average of the TrueRange.The ATR is a measure of volatility. High ATR values indicate high volatility, and low values indicate lowvolatility, and the price is flat.𝐴𝑇𝑅 𝑇𝑅 1 𝑛 1 𝑇𝑅𝑛𝑤ℎ 𝑒𝑟𝑒 𝑇𝑅 𝑇𝑟𝑢𝑒𝐻𝑖𝑔ℎ 𝑇𝑟𝑢𝑒𝐿𝑜𝑤(19)3.4. Volume IndicatorsVolume represents the amount of trading activity that occurs during a given interval, independent ofprice. As volume levels move above their average, it indicates the strengthening of a trend or confirmation of atrading direction. The strongest trends often occur while volume increases which leads to large movement inprice.3.4.1. Chaikin Money Flow(CMF)The Chaikin Money Flow indicator was developed by Marc Chaikin (Labs, 2016) and it compares thetotal volume over the last n time periods to the total of volume times the Closing Location Value (CLV) over thelast n time periods. The CLV calculates where the issue closes within its trading range.When the Chaikin MoneyFlow is above 0.25 it is a bullish signal, when it is below -0.25, it is a bearish signal. But rarely it reachesextremes. Buying and selling pressure can be measured using CMF. A move into positive territory indicatesbuying pressure, while a move into negative territory indicates selling pressure. The indicator oscillatesabove/below zero. Zero-line cross ends up with whipsaws. To reduce whipsaws the bullish/bullish threshold canbe set to 0.05/-0.05 instead of 0. This may reduce whipsaws.CLV close low (high close )(high low )CMFi ii n (CLV volume )ii n volume(20)3.4.2. On Balance Volume (OBV)The On Balance Volume was developed by Joseph Granville and OBV is a cumulative total of the upand down volume (mwlibtoolkit, 2011). When the close is higher than the previous close, the volume is added tothe running total, and when the close is lower than the previous close, the volume is subtracted from the runningtotal. If the price moves before the OBV, then it is a non-confirmed move. A series of rising peaks, or fallingtroughs, in the OBV indicates a strong trend. If the OBV is flat, then the market is not trending.IF Close Close 1 thenOBV OBV 1 VolumeElse If Close Close 1 thenOBV OBV 1 VolumeElseOBV OBV 13.4.3. Money Flow Index(MFI)The Money Flow Index calculates the ratio of money flowing into and out of a security (mwlibtoolkit,2011) and its values range from 0 to 100. Values above 80/below 20 indicate market tops/bottoms.MoneyRatioi ii nii nPositiveMoneyFlowNegativeMoneyFlowMoneyFlowIndex 100 and1001 MoneyRatio(21)4. RESULTS AND DISCUSSIONSWe have conducted preliminary study of 22 technical indicators which are classified into four majorgroups such as Trend Indicators, Momentum indicators, Volatility indicators and Volume indicators. To getclear view about all these 22 technicalindicators, a 2-D chart is plotted against each indicator andsignificance ofeach indicator is analyzed. For our complete study, we have taken TVSMOTOR security data for 6 monthsfrom January 2016 to June 2016 and 2-D plots are drawn with appropriate package that supports technical212
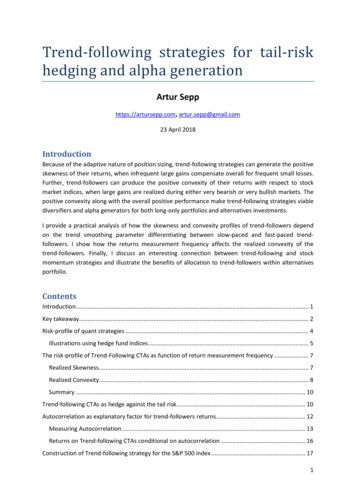
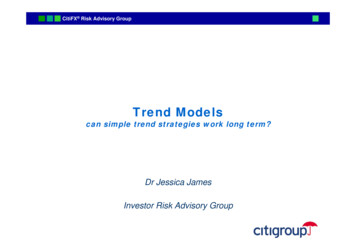
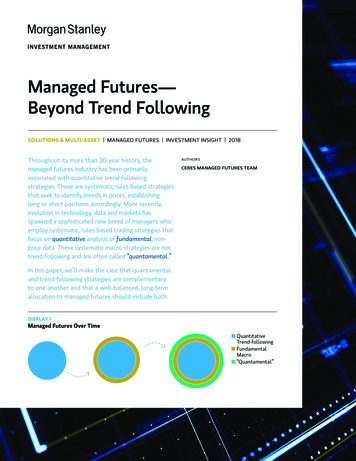
International Journal of Computational Intelligence and Informatics, Vol. 6: No. 3, December 2016analysis in R. R provides thousands of free open-source statistical, mathematical libraries andalgorithms.Traders can significantly cut down the time required to prototype and backtest trading strategiesusing R. All indicators are explained with the help TTR package in R.The Moving average indicator advised that when the price is above the moving average indicator valuethen themarket is in uptrend otherwise the market is in downtrend. Figure1 shows that 2-D plot of ExponentialMoving average (EMA) of TVSMOTOR security and that indicates that the market is in uptrend in March 2016and in May 2016 it is in downtrend. The behaviors of other trend indicators such as SMA, WMA, VWMA, andDEMA are same as EMA.Figure 1. Trend Indicator – Exponential Moving AverageThe Moving Average Convergence Divergence (MACD) indicator highlights that the market is inuptrend when MACD line crosses above the zero line or the MACD line crosses above the signal line. On theother hand, the market is in downtrend when MACD line crosses below the zero line or the MACD line crossedbelow the signal line. Figure 2reveals that the MACD line crosses above 0 during the month ofMarch 2016 andindicates the market is in uptrend and during the month of May MACD crosses below 0 indicating a downtrend.And also, the MACD line crosses above the signal line by the end of February indicating uptrend and it occursbefore the Zero crossover of MACD. Similarly the downtrend is also indicated earlier by signal line crossoverbefore the zero crossovers.Figure 2. Trend Indicator –Moving Average Convergence/Divergence(MACD)The Average Directional Movement Index (ADX) indicator signal a strong trend if ADX value isabove 25 points along with the direction of the trend DI and –DI on either side. That is, when DI crossesabove –DI it indicates buy signal and when DI crosses below –DI it indicates sell signal. In Figure3 ADXindicator chart of TVSMOTOR security, ADX value is above 25 in March and indicates strong trend and also DI crosses above -DI indicates bearish market. In February, ADX value is less than 20 indicating the price isflat. So, if the trend is strong, buy/sell direction can be decided using DI and –DI.213
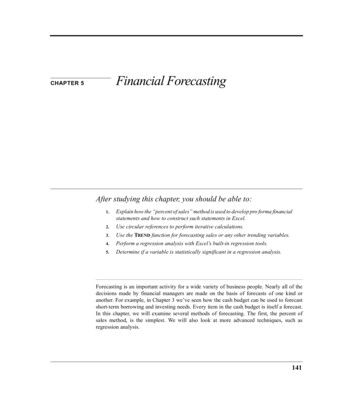
International Journal of Computational Intelligence and Informatics, Vol. 6: No. 3, December 2016Figure 3. Trend Indicator –Average Directional Movement Index (ADX)The trend detection index (TDI) is used to detect when a trend has begun and when it has come to anend. If the values of TDI and direction of indicator is positive it signals that there is a bullish market and if TDIis positive and the direction indicator is negative then there will be a bearish market. In Figure 4TDI chart ofTVSMOTOR security indicates that in-betweenlast week of March and first week of May, both TDI and DI ispositive indicating uptrend, whereas in middle of May TDI is negative and DI is positive indicating a downtrend.Figure 4. Trend Indicator –Trend Detection index (TDI)The strategy followed in Aroon indicator is, the Aroon up value between 70 and 100 indicates uptrendand Aroon down value between 70 and 100 indicates downtrend. If Aroon up is above 70 and Aroon down isbelow 30 it indicates strong uptrend and if Aroon down is above 70 and Aroon up is below30 indicates strongdowntrend. In Figure5 Aroon indicator chart of TVSMOTOR security, the Aroon up indicator value is above 70and Aroon up crosses above Aroon down value in March showing the market is in uptrend. Similarly, during themonth of May Aroon down value is above 70 and the Aroon up crosses below the Aroon down, indicatin
technical indicators are derived from OHLCV (Ulrich, 2016) are used in our case study. The gorgeous effect of 22 technical indicators which are available in TTR package is explained in an unsophisticated manner in predicting trend of the market. As the study describes about each in