Transcription
39. HISTORY OF HYDROTHERMAL SEDIMENTATION AT THE EAST PACIFIC RISE, 19 S 1Mitchell W. Lyle, College of Oceanography, Oregon State UniversityRobert M. Owen, Department of Atmospheric and Oceanic Science, The University of MichiganandMargaret Leinen, Graduate School of Oceanography, The University of Rhode Island2ABSTRACTThe rate at which hydrothermal precipitates accumulate, as measured by the accumulation rate of manganese, canbe used to identify periods of anomalous hydrothermal activity in the past. From a preliminary study of Sites 597 and598, four periods prior to 6 Ma of anomalously high hydrothermal activity have been identified: 8.5 to 10.5 Ma, 12 to16 Ma, 17 to 18 Ma, and 23-to-27 Ma. The 18-Ma anomaly is the largest and is associated with the jump in spreadingfrom the fossil Mendoza Ridge to the East Pacific Rise, whereas the 23-to-27-Ma anomaly is correlated with the birth ofthe Galapagos Spreading Center and resultant ridge reorganization. The 12-to-16-Ma and 8.5-to-10.5-Ma anomalies arecorrelated with periods of anomalously high volcanism around the rim of the Pacific Basin and may be related to otherperiods of ridge reorganization along the East Pacific Rise. There is no apparent correlation between periods of fastspreading at 19 S and periods of high hydrothermal activity. We thus suggest that periods when hydrothermal activityand crustal alteration at mid-ocean ridges are the most pronounced may be periods of large-scale ridge reorganization.INTRODUCTIONThe sediments west of the East Pacific Rise (EPR) at19 S are primarily mixtures of calcium carbonate andhydrothermal precipitates derived from ridge crest hotsprings (see, e.g., Lyle, this volume).Despite the large proportion of calcite in the Leg 92sediments, the biogenic input of material is low. Calciteis a significant fraction of the sediments only becausemuch of the region, unlike the North Pacific central gyreregion, is above the calcite compensation depth. Sedimentation rates in the Leg 92 cores range from 1.5 cm/103 yr. to less than 0.01 cm/103 yr. (Knüttel, this volume; Table 1). The rates correlate with paleodepth andthus with calcite preservation in the sediment, with highest rates when sites were shallowest and calcite was bestperserved (see also Rea and Leinen, this volume). Typicalsedimentation rates in the region are as slow or slowerthan rates measured in the North Pacific gyre, despitethe better preservation of calcite. Another indication ofthe lack of biogenic input is that the Leg 92 sedimentslack opaline biogenic tests. Neither diatom frustules norradiolarian tests were observed during smear slide analysis or during examination of coarse fractions sievedfrom core-catcher material.The region also lacks large inputs of organic matterto the sediments, and thus the postdepositional modification of the sediments by early diagenesis is at a minimum. For example, Gieskes et al. (this volume) foundno evidence for even reductive remobilization of mangaLeinen, M., Rea, D. K., et al., Init. Repts. DSDP, 92: Washington (U.S. Govt. Printing Office).2Addresses: (Lyle) College of Oceanography, Oregon State University, Corvallis, OR97331; (Owen) Department of Atmospheric and Oceanic Science, The University of Michigan, Ann Arbor, MI 48109; (Leinen) Graduate School of Oceanography, The University ofRhode Island, Narragansett, RI 02882.nese, the most redox sensitive of the common transitionmetals. The input of continental detritus is also very low.Bloomstine and Rea (this volume) have noted that theeolian detrital component has accumulated 1 to 2 ordersof magnitude more slowly than in similar regions of theNorth Pacific gyre.The drilling transect for Leg 92 was located at 19 Spartly because of the large proportion of hydrothermalprecipitates in the sediments of the region. Boström andPeterson's (1966) analysis of the sediments in the general vicinity provided the first chemical evidence of hydrothermal activity at mid-ocean ridge crests. Later studies (e.g., Cronan, 1973; Dymond, 1981) have shown thatmetalliferous sediments are common just above basalticbasement in DSDP cores and that the distribution andcomposition of these sediments suggest a large source atthe EPR. From these studies it has become apparent thatof the deposits associated with hydrothermal activity,metalliferous sediments are the most widespread; in theSouth Pacific, they extend hundreds of kilometers fromthe EPR crest. Very little is known about changes in thedistribution of hydrothermal precipitates with time, however. The purpose of this study is to examine the historyof hydrothermal sedimentation at the Leg 92 drill sites,to relate the accumulation of hydrothermal precipitatesto the processes now occurring at the EPR crest, and torelate changes in hydrothermal accumulation to tectonicevents in the eastern Pacific Ocean. We have confinedour analysis to two of the Leg 92 sites, 597 and 598.Both of these sites are located in areas of subdued topography, and basement is covered with a typical pelagic drape of sediments. There is no evidence eitherthrough analysis of the seismic reflection records orthrough analysis of the cores themselves for ponding orthe preferential deposition of sediments at either site.There is also no evidence for a local source of hydro-585
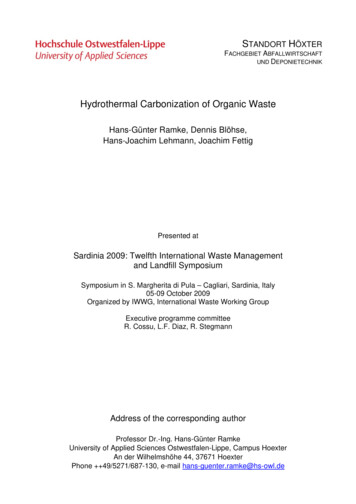
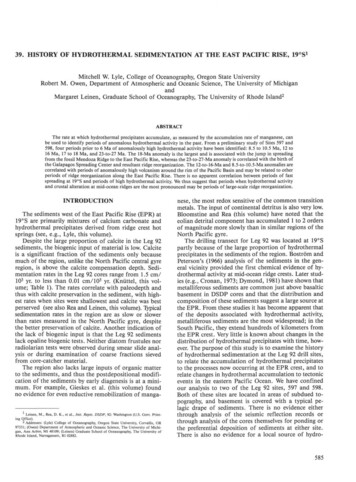
M. W. LYLE, R. M. OWEN, M. LEINENTable 1. Mass accumulation rate information for Leg 92 nrate(m/m.y.)Dry bulkdensity(g/cm 3 ) bMassaccumulationrate(mg/[cm 2 103 yr.])cHole 8049672825Hole -17.017.0-29.729.7-52.426321264422542Hole 40.257.53.4Hole 6010-8.08.0-8.98.9-10.510.5-20.40.568.011.0j* Time intervals compiled from Knüttel (this volume) and Romine (this volume).Dry bulk density from shipboard measurements.Mass accumulation rate is the total burial flux of sediment in the core. An accumulation rate of a single element or sedimentary component can be obtained by multiplying the mass accumulation rate by the weight fraction of that component in thesediment.cthermal precipitates (there are no nearby seamounts orislands). We decided not to include Site 599 in this preliminary study even though chemical analyses have beendone (Lyle, this volume), because the shipboard examination of the Site 599 sediments (Site 599 chapter, thisvolume) showed that turbidites have been deposited atthe site. Other, more subtle redeposition may also haveoccurred.The tectonic history of the EPR between 20 N and40 S is complicated by the relatively frequent and largeridge jumps that have occurred. At the present time theEPR at about 25 S is in the process of jumping about400 km to the east (Handschumacher et al., 1981). In thepast, large ridge jumps have isolated fossil rises on boththe Pacific and Nazca plates (Herron, 1972; Mammerickxet al., 1980), and major reorganizations of spreading ledto the birth of the Galapagos Spreading Center (Hey,1977). Mammerickx et al. (1980) interpret the magneticanomalies in the 19 S region as indicating that the present EPR began spreading at about 18.5 Ma to the westof the then-active Mendoza Rise. As we will show later,586this event has been preserved in the sediments of Hole597. Rea (1981) has noted asymmetric spreading on asmaller scale in the 20 S area. He suggests that the spreading may have occurred either continuously or as manydiscrete westward rise jumps of only a few kilometerseach.MODELING OF HYDROTHERMALMANGANESE ACCUMULATIONSince crustal heat loss by hydrothermal activity is primarily concentrated at rise crests, it is not surprising thathydrothermal sediments are also concentrated near theEPR crest. Figure 1 and Table 2 show the present accumulation pattern of manganese, one of the major components of the hydrothermal precipitates. The accumulation rate of hydrothermal precipitates decreases in aroughly exponential fashion away from the EPR crest;this distance effect must be taken into account when pasthydrothermal activity at the rise crest is reconstructedfrom sediments that were deposited at some distance fromthe rise. Iron, the other major component of hydrothermal precipitates (Dymond, 1981), accumulates in a similar pattern away from the rise crest and can also be usedto reconstruct past hydrothermal activity. We chose touse only manganese because there is no evidence of manganese remobilization in the sediments and because using iron produces the same trends (Table 2).The pattern of hydrothermal accumulation is due tothe combined effects of the injection into seawater ofhydrothermal precipitates at hydrothermal vent areas, theslow horizontal transport of these precipitates by bottom currents away from the EPR crest, and precipitatesettling. We used these parameters to model the rate ofaccumulation of hydrothermal manganese and other hydrothermal components as a function of distance fromthe EPR. In this model we assume that hydrothermalparticles of a constant composition and grain-size distribution are injected into a hydrothermal plume at a height/ above the bottom. We then assume that the hydrothermal particles drift westward at a mean current velocity,V, normal to the EPR and settle to the bottom byStokes law settling. To simplify the model, we ignore aggregation processes (which are discussed by McCave,1984), resuspension processes, bottom boundary layerturbulence, and the change in depth of the bottom awayfrom the rise crest. We also ignore ponding and othernon-uniform sedimentation processes.We assume that hydrothermal precipitates are injected to a height of approximately 200 m above the bottom, as has been observed in 3He and manganese profiles at 21 N (Lupton et al., 1980) and in radon profilesand temperature anomalies at the Endeavour Ridge (Kadko and Lupton, 1984; Lupton and Delaney, 1984). Wealso assume that the grain-size distribution of the injected particles is log normal, as has been observed by Lambert et al. (1981), for all classes of sedimentary particles(including aluminosilicates, Fe-rich oxyhydroxides, andorganic particles. Lambert et al. have formulated thelog-normal distributions they observed as follows:dN áDTVexp[-l/2(In D - In Dm \2
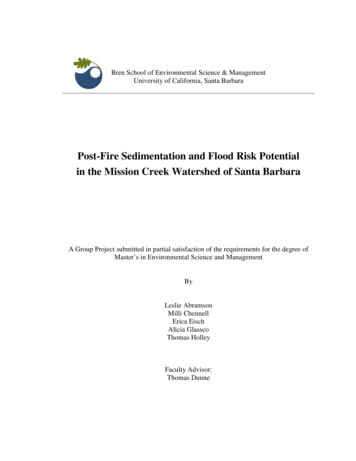
HISTORY OF EAST PACIFIC RISE HYDROTHERMAL SEDIMENTATION10080 -800400where D is particle diameter, Dm is median particle diameter, N is the total number of particles, and σ is thestandard deviation about Dm, in log units because ofthe style of formulation. Examples of the shape of thisgrain-size distribution for different standard deviationsare shown in Figure 2. Observed grain-size distributionsfor deep-sea particles have standard deviations that rangefrom 0.23 for organic particles to 0.71 for aluminosilicates (Lambert et al., 1981). We have chosen in our modeling to hold this parameter constant at 0.65, a valuesimilar to that observed for grain-size distributions foraluminosilicates and Fe-rich oxyhydroxide particles.We have also assumed that particulate hydrothermalmaterial settles from the plume by Stokes law settling,according to which the vertical (settling) velocity of aparticle is proportional to the square of its diameter. Thetime that a hydrothermal particle takes to settle to thesediment from a hydrothermal plume can thus be calculated from its injection height and grain diameter, andthe distance that the particle has traveled normal to theridge before settling on the bottom can be calculated byaccounting for mean current velocity as follows:Distance (km)100Dist B80 17 SD 1 9 to 20 S60.940HydrothermalMn production 1 / 3 of that at 17 S20800400Distance (km)Figure 1. Accumulation rates of manganese in core tops from twotransects of the East Pacific Rise at 17 (filled squares) and at 19 to20 S (open squares). Data are listed in Table 2. Figures 1A and IBshow attempts to fit both data sets by using the injection-settlingmodel of hydrothermal accumulation developed in the text. Thedistribution of the hydrothermal particles injected is assumed to belog normal, and particles are assumed to have a median diameterof 2 µm, with a standard deviation of 0.65. Figure 1A attempts tofit both data sets by varying only the velocity of the current thatcarries the hydrothermal particles away from the rise crest. Whennear-crest accumulation rates fit, distal Mn accumulation rates arebadly overestimated. Figure IB attempts the fit by holding the velocity of the current constant at 1.3 cm/s and varying hydrothermal activity at the rise crest. The two sets of data can be fit if hydrothermal activity (Mn production) at 19 to 20 S is one-third theactivity at 17 S.(2)where Dist is the distance normal to the rise crest, / isthe injection height, Kis the current velocity normal tothe rise crest., D is grain diameter, and K is the Stokesconstant. The Stokes constant is (g/\%v) [(pg — pw)/pw], where g is gravitational acceleration, v is the dynamic viscosity of seawater at the temperature of bottom water, and pg and pw are the densities of the grainand of water, respectively.The mass of hydrothermal particles sedimented as afunction of distance from the rise crest can also be calculated for different mean current velocities through theuse of equations (1) and (2) and by multiplying the number of particles deposited at a given distance by theirvolume and density:Mass1200VIK Iß ( H pg áN(3)where D is the mean diameter of particles deposited atsome distance interval from the rise crest (equation 2),pg is the grain density of the hydrothermal particles,and áN is the number of particles deposited in the distance interval from a combination of equations (1) and(2). Mass per unit time or the accumulation rate of particles can be calculated if the rate of production of particles is assumed or fit to measurements. The accumulation rate of a hydrothermal element, such as manganese,can also be calculated if the concentration of the element in a hydrothermal particle is known.Figure 1 shows typical results of the modeling for meancurrent velocities between 1 and 5 cm/s and a mediangrain size of 2 µm. We chose this range of current velocities because it includes the velocities that are consideredto be typical of the deep Pacific Basin on the basis of587
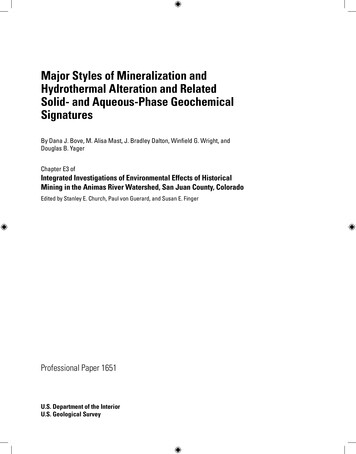
M. W. LYLE, R. M. OWEN, M. LEINENTable 2. Present manganese accumulation rates at the East Pacific Rise, 17 S and 19 to 20 S.Core/SiteManganeseaccumulationrate(mg/[cm 2 X 10³ yr.])Ironaccumulationrate(mg/[cm 2 103 yr.])Latitude(S)Longitude(W)Distance fromrise crest(km)*i7 or17 02'17 00'16 57'16 56'113 31'113 54'114 H'116 18'121 21'1961883108408628192.00.632408273103.819 15'20 00'18 56'19 27'19 00'113 35'114 31'116 51'119 53'124 41'5873406401130367.71.20.410.20120223.42.40.6817 S transectV19-53 bV19-54CV19-55 bV19-61CV19-64C19 to 20 S transectOC73-3-20P dOC73-3-25P dSite 600Site 599Site 598Error in distance, 20 km.Determined from sedimentation rates in Moser (1979) and elemental analyses in Dymond (1981).From Dymond and Veeh (1975).From Moser (1979).6000σ 0.3550004000300020001000Medium particlediameter (true forall values of σ)246Particle diameter (µm)Figure 2. Log-normal particle distributions. The median particle diameter is 2 µm in each, but the standard deviation of particle size varies. We used the 0.65σ curve for the modeling shown in Figure 1.the MANOP projecfs 3-year-long. records of near-bottom current velocities (Fischer, 1984, for MANOP sitesM and H; J. Dymond, unpubl. data for MANOP SiteC). The (directionless) mean velocity in each of the threerecords we inspected was 4 to 6 cm/s, near the upperrange of the mean velocities we used in the model. Because bottom currents rarely travel in a constant direction, the long-term mean velocity in one direction ismuch lower than the directionless velocity. Even for a re-588cord where the current is relatively constant, as picturedin the record from the EPR at 9 N (MANOP Site M,Fig. 3), the mean velocity in the direction of most consistent flow is only 1.8 cm/s, as compared with 4.1 cm/sfor the directionless flow. The other two current recordshad even lower velocities along the direction of most common flow and were less than 1 cm/s on the average.From the simple theory of hydrothermal sedimentation we have outlined here, we can obtain, from a rela-
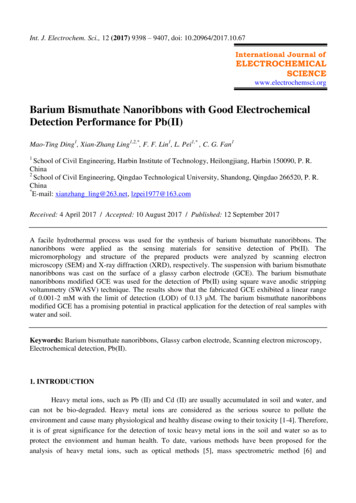
HISTORY OF EAST PACIFIC RISE HYDROTHERMAL SEDIMENTATION100T-100100--400 -500EDistance (km)Figure 4. Result of attempting to fit measured manganese accumulation rates at 17 S and 19 to 20 S by assuming a log-normal particle size distribution for a median particle diameter of 6 µm and astandard deviation of 0.65. Particle size distributions for which median particle diameter is greater than 2 µm fit the observed profilespoorly.-600J-B-700Mean.20.18.16.14121 08.06.04.02.0068Current speed (cm/s)101214Figure 3. A. Summed vector diagram of currents 200 m above the bottom at MANOP Site M (8 45'N, 104 W; 3100 m water depth; 10Sept. 1980 to 18 Oct. 1981). B. Frequency histogram of currentspeeds. The figure illustrates that although the average velocity ofthe bottom current may be relatively fast (here 4.1 cm/s), the velocity measured in one particular direction may be much slower. Inthis case, the mean velocity in the direction of maximum travel isonly 1.8 cm/s.tively small amount of data, large amounts of information about hydrothermal production, the median grainsize of the hydrothermal particulates, and mean currentvelocity. For example, Figure 4 shows an attempt to fitmeasured Mn accumulation rate profiles at 17 S and 19to 20 S by using a median grain diameter of 6 µm, whilevarying the mean current velocity between 1 and 5 cm/s.As can be seen from the figure, it is impossible to fitboth near-crest and distal accumulation rate data withthis particular grain size by using this size distribution.Either the near-crest accumulation rates are severely overestimated, or the Mn accumulation rates in the distal tailare severely underestimated by using this median diameter. After a series of tests, including tests of the effectsof changing the magnitude of the standard deviation ofthe particle distribution upon the accumulation rate pattern, we have concluded that a hydrothermal particle distribution with a median grain size of 2 µm and a standard deviation of 0.65 best fits the observed accumulation rate data (Fig. 1). The larger the median grain sizeof the particles, the greater the proportion of the totalmass in quickly falling larger-diameter particles, becausethere are more large particles and because the mass carried in each particle increases as the cube of the particlesize. If one attempts to fit the accumulation rate distribution with distance from the rise crest, median grainsizes greater than about 2 µm lead to either large overestimates of the Mn accumulation rate near the rise crest,large underestimates of the Mn accumulation rate awayfrom the rise crest, or unreasonably fast bottom currents to achieve the proper accumulation rate distribution. In a similar fashion, increasing the standard deviation of the particle distribution overconcentrates the accumulation of manganese near the rise crest, becausethe total number of large high mass particles increasessignificantly.One of the greatest difficulties about fitting theoretical curves to the measured Mn accumulation rate datahas been that the two different transects of the EPR reveal different patterns of manganese accumulation (Fig.1, Table 2). Figure 1 illustrates the problem. The 17 Sdata have been fitted to a theoretical curve with a mean589
M. W. LYLE, R. M. OWEN, M. LEINENcurrent velocity of 1 cm/s and a 2-µm median particlediameter. Although the 17 S data are fit very well, thedata from 19 to 20 S are fit poorly. If the initially injected hydrothermal particulate material has the samesize distribution everywhere, either current speed or thehydrothermal output of manganese must change between17 and 19 S. An increase in mean current velocity toabout 2.5 cm/s between 17 and 19 S could lower theaccumulation rate sufficiently at the rise crest (Fig. 1A),but because the mass of hydrothermal material being produced at the rise crest remains the same, larger amountsof manganese must be deposited away from the rise crest.A current velocity sufficient to lower the Mn accumulation rate to the observed rate at the rise crest thus leadsto an overestimate of Mn accumulation rate by a factorof almost 4 at a distance of 340 km from the rise (4.1mg/[cm2 103 yr.] estimated vs. 1.2 observed). FigureIB shows the fit of the two profiles that results by assuming a constant current speed of 1.3 cm/s in bothtransects and by assuming that the hydrothermal discharge of particulates (and presumably the discharge ofhydrothermal fluid) at 17 S is a factor of 3 greater thanat 19 to 20 S. The fit for both profiles is very good, andthe quality of the fit suggests that significant variationsof hydrothermal output occur along strike at the EPR.Although there are no other estimates for hydrothermalactivity in these two regions, we point out that the risecrest at 17 S is significantly broader and more shallowthan at 19 S, as one would expect in a region of morevolcanic activity and higher hydrothermal activity.We can thus explain the pattern of Mn accumulationrate with increasing distance from the EPR, providedthat the median grain size of the hydrothermal particlesis small ( 2 µm), the grain-size distribution is log normal, and the mean current between 17 and 20 S flowswest at about 1 cm/s. Although there are no publishedstudies of particle size distributions of hydrothermal particles to test the model, there is evidence of hydrothermal flow westward from the EPR at these latitudes.By studying mantle-derived 3He, Lupton and Craig(1981) have discovered the existence of a hydrothermalplume in the vicinity of 20 S that extends west of theEPR crest for over 1000 km. The plume may define theregion to which the transport of hydrothermal materialis possible. Stommel (1982) suggested that the injectionof hot hydrothermal waters may in itself drive the plume.He argues that a simple model shows that the injectionof hydrothermal waters provides sufficient energy to generate a westward flow; the maximum flow is at 10 S.The existence of the plume has also been confirmed byReid (1982). He develops estimates based on temperature and salinity profiles that indicate that a westwardgeostrophic flow of 0.2 to 0.3 cm/s (relative to the 35OO-mdecibar surface) exists in the plume. He cautions, however, that the flow estimate is not very well constrained.If his velocity estimate is nearly correct, however, themedian grain size of the hydrothermal particulate material may be significantly smaller than we estimate.In the next sections of this paper we use the modelingwe have developed of the present manganese accumulation rate-distance distribution to look for periods of590anomalous manganese accumulation and anomalous hydrothermal activity in the past. We consider periods ofanomalous manganese accumulation to be times whenthe manganese accumulation rate is either too high ortoo low to be explained by varying current velocity between 1 and 5 cm/s. We use as initial conditions the optimal fit particle size distribution (2 µm, σ 0.65) andthe hydrothermal output at 20 S (see Fig. 1).THE RECORD OF THE MENDOZA RISE-EASTPACIFIC RISE JUMP AT SITE 597Site 597 is the only one of the Leg 92 coring sites thatis located on crust formed at a fossil spreading center. Itis thus the only Leg 92 site that could possibly recordthe rise jump from the Mendoza Rise to the East PacificRise.Figure 5 is an illustration of the variation with age ofthe manganese accumulation rate at Site 597. Manganese accumulation rates were determined by combiningthe linear sedimentation rates from Knüttel (this volume),the dry bulk densities estimated from shipboard measurements of physical properties (Table 1), and the major element compositions reported in Lyle (this volume).The distances of Site 597 from the rise crest throughtime were calculated from the spreading rates for theEPR-Mendoza Rise at 19 S (reported in Rea and Leinen,this volume). Since, as it ages, each DSDP site movesaway from the rise crest where it was produced, one wouldexpect the pattern of change in manganese accumulation rates upcore to resemble the modern pattern ofchange in accumulation rates with increasing distancefrom the EPR crest (Fig. 1). The oldest (basal) sediments should have the highest manganese accumulationrates, and the younger sediments (those deposited whenthe site lay farther from the rise crest) should have drastically lower Mn accumulation rates. With the exceptionof an age interval between 17 and 18.7 Ma, this is precisely the pattern observed at Site 597 (Fig. 5). The basalsediments have manganese accumulation rates of approximately 20 mg/(cm2 103 yr.), and the rates decrease to about 5 mg/(cm2 103 yr.) by 24.7 Ma. Atthis time, Site 597 was at a distance from the MendozaRise crest of 200 km (a distance based upon the spreading rates estimated by Rea and Leinen [this volume!from magnetic anomalies). At distances greater than500 km from the rise crest (ages less than about 19 Ma),the accumulation rate of manganese at Site 597 fell toless than 1 mg/(cm2 103 yr.).During the time interval bounded by the CN2 nannofossil biostratigraphic Zone (17.0 to 18.7 Ma; Knüttel,this volume), the accumulation rate of manganese increased from these low background values to a peak ofalmost 20 mg/(cm2 103 yr.). The timing of this eventsuggests that it may be correlated with the EPR rise jumpat 18.5 Ma proposed by Mammerickx et al. (1980; seeFig. 6). We have sufficient evidence to show that theevent is real and not a product of our data manipulation. Elemental accumulation rates, because they are derived by multiplying the average mass of sediments deposited in a time interval by the weight fraction of theelement in the sediment, are very sensitive to errors in
HISTORY OF EAST PACIFIC RISE HYDROTHERMAL SEDIMENTATION30140012001000Distance from Site 597 to rise crest (km)800600400 .,400200Figure 5. Manganese accumulation rates versus age (distance from the rise crest) at Site 597. The patternof accumulation rate change with increasing distance from the rise crest is similar to the pattern thatexists at present. In order to discern anomalous events, the typical decrease of manganese accumulationrate with distance from the rise crest must be removed.18.5 Ma20 Ma23 MaLiSite 597 \ v )Figure 6. Mammerickx et al.'s (1980) interpretation of the tectonic history of the 19 S region between 23and 18.5 Ma. Active spreading ridges are marked by heavy solid lines. Heavy dashed lines mark magnetic Anomaly 7 (26 Ma). The following abandoned spreading ridges are marked by letters: G Gallego Rise; M Mendoza Rise; R Roggeveen Rise; S Selkirk Rise.the time scale. The interval from 17.0 to 18.7 Ma, whichencloses the Mn spike, is marked by a seven- to tenfoldincrease in the total deposition of sediments as compared with the time intervals before and after it. Conceivably, then, there could be a major error in estimating the time interval boundary, and such an error couldproduce a spurious spike in Mn accumulation rate. Twolines of evidence show that the spike is not due to stratigraphic error, however. First, the peak accumulation rateof manganese is about 20 times as high as the Mn accumulation rates in the surrounding time intervals. Thischange in rate is at least 1 order of magnitude greaterthan the maximum possible time-scale-associated error.(The maximum possible error can be determined by assuming that the zone boundaries lie immediately adjacent to samples within the zone instead of placing thezone boundaries between samples.) Second, the sedimentcomposition, which is independent of the time scale cho-591
M. W. LYLE, R. M. OWEN, M. LEINENsen, becomes more hydrothermal in character during thisinterval. As illustrated by the Mn/Al ratio (Fig. 7), theSite 597 sediments become much more manganese richat 18 Ma, a change that is consistent with the sediment'sreceiving a larger hydrothermal component at this time.The Mn/Al ratio also decreased with time after about17.5 Ma. This change can be interpreted either as the result of the site's moving farther away from a hydrothermal source or as a decrease of hydrothermal output fromthe two-ridge hydrothermal source region. In eithercase, the spike in Mn production is real, and it leads usto suggest that the EPR started producing crust at 19 Sat about 18 Ma.The magnitude of the 18-Ma spike is surprising, evenwhen the rise jump is taken into account. Immediatelybefore the jump in spreading to the EPR, Site 597 wasapproximately 550 km from a hydrothermal source atthe Mendoza Rise, and it accumulated manganese atabout the same rate as present-day sediments at an equivalent distance from the EPR (0.5 to 1.0 mg/[cm2 103yr.]). The EPR started spreading 220 km to the west ofthe then-active Mendoza Rise (a distance based upona comparison of the actual distance of Site 597 from theEPR and the distance to the Mendoza Rise crest determined by adding the spreading rates). Site 597 thuschanged from being 550 km away from an active ridgecrest to being 330 km away. If we use the present-dayMn accumulation rates as an indication of what the Mnaccumulation rate profile at 18 Ma should be, manganese accumulation should have incr
39. HISTORY OF HYDROTHERMAL SEDIMENTATION AT THE EAST PACIFIC RISE, 19 S1 Mitchell W. Lyle, College of Oceanography, Oregon State University Robert M. Owen, Department of Atmospheric and Oceanic Science, The University of Michigan