Transcription
Guide to Prioritization TechniquesIntroductionDespite the many accomplishments of local public health, we continue to see emerging population-widehealth threats as we forge ahead into to the 21st Century. We are in an economic climate where LHDpersonnel are facing dire budget cutbacks while simultaneously dealing with issues like H1N1, chronicdiseases, and natural disasters. Because LHDs are the backbone of the public health system, the recentmovement to establish a national system of accountability for governmental health agencies isparticularly timely. The Public Health Accreditation Board (PHAB) is developing a voluntary nationalaccreditation program which is grounded in continuous quality improvement. As LHDs work towardmeeting accreditation standards and implementing quality improvement efforts, they are faced with aninfinite number of competing health issues to address, while keeping in mind several externalconsiderations such as urgency, cost, impact and feasibility, to name just a few. Fortunately, a numberof prioritization methods specifically designed to assist agencies with this very challenge have beendeveloped and widely used in a range of industries including public health. When faced with thesetough decisions, employing a defined prioritization technique can provide a structured mechanism forobjectively ranking issues and making decisions, while at the same time gathering input from agencywide staff and taking into consideration all facets of the competing health issues.This document serves as a guide and provides five widely used options for prioritization includingguidance on which technique best fits the needs of your agency, step-by-step instructions forimplementation, and practical examples.Getting StartedPrior to the implementation of any prioritization process, preliminary preparations are necessary toensure the most appropriate and democratic selection of priority health issues:i1. Community assessment – Conducting assessments will determine the current status and detectgaps to focus on as potential priority areas. LHDs engaging in the Public Health AccreditationBoard (PHAB) accreditation process must conduct a community health assessment (CHA) as aprerequisite for eligibility. A CHA provides data on the overall health of a community anduncovers target priority areas where a population may have increased risk for poor healthoutcomes.2. Agency self-assessment - As part of the national accreditation process, LHDs must use the PHABagency self-assessment tool to evaluate agency performance against nationally recognizedstandards. Post-assessment, LHDs can analyze their results and determine strengths and areasfor improvement to address through continuous quality improvement efforts. Prioritizationmethods can be used to help select areas for improvement from a CHA or PHAB selfassessment.3. Clarify objectives and processes – Before beginning the process, LHD leadership must ensurethat all team members have a clear understanding of the goals and objectives along with thechosen prioritization process.4. Establish criteria - Selection of appropriate prioritization criteria on which to judge the merit ofpotential focus areas is important to avoid selection based on bias or hidden agendas andensure that everyone is ‘on the same page.’ Table 1.1 below identifies criteria commonly usedin prioritization processes:
Table 1.1: Commonly Used Prioritization CriteriaiiCriteria to Identify Priority ProblemCost and/or return on investmentAvailability of solutionsImpact of problemAvailability of resources (staff, time, money,equipment) to solve problemUrgency of solving problem (H1N1 or airpollution)Size of problem (e.g. # of individuals affected)Criteria to Identify Intervention for ProblemExpertise to implement solutionReturn on investmentEffectiveness of solutionEase of implementation/maintenancePotential negative consequencesLegal considerationsImpact on systems or healthFeasibility of interventionPrioritization in PracticeThe following section highlights five prioritization methods:1.2.3.4.5.Multi-voting TechniqueStrategy GridsNominal Group TechniqueThe Hanlon MethodPrioritization MatrixEach sub-section includes step-by-step instructions on implementation followed by examples illustratingpractical application. It is important to remember that no right or wrong method of prioritization exists.Although the provided examples in this document are useful in gaining an understanding of how to useprioritization techniques, they are not meant to be prescriptive but rather, should be tailored to theneeds of individual agencies. Additional information on prioritization processes can be found in theAssessment Protocol for Excellence in Public Health (APEXPH).Multi-voting Technique iiiMulti-voting is typically used when a long list of health problems or issues must be narrowed down toa top few. Outcomes of Multi-voting are appealing as this process allows a health problem which maynot be a top priority of any individual but is favored by all, to rise to the top. In contrast, a straightvoting technique would mask the popularity of this type of health problem making it more difficult toreach a consensus.Step-by-Step Instructions:1. Round 1 vote – Once a list of health problems has been established, each participant votes fortheir highest priority items. In this round, participants can vote for as many health problems asdesired or, depending on the number of items on the list, a maximum number of votes perparticipant can be established.2. Update list - Health problems with a vote count equivalent to half the number of participantsvoting remain on the list and all other health problems are eliminated (e.g. if 20 participants arevoting, only health problems receiving 10 or more votes remain).3. Round 2 vote – Each participant votes for their highest priority items of this condensed list. Inthis round, participants can vote a number of times equivalent to half the number of healthproblems on the list (e.g. if ten items remain on the list, each participant can cast five votes).
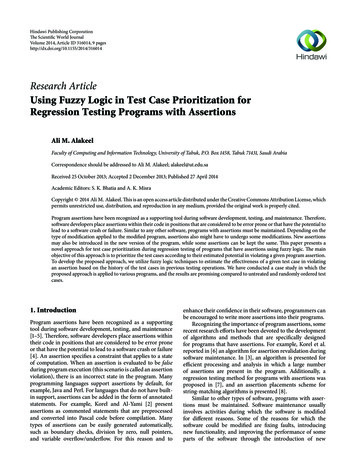
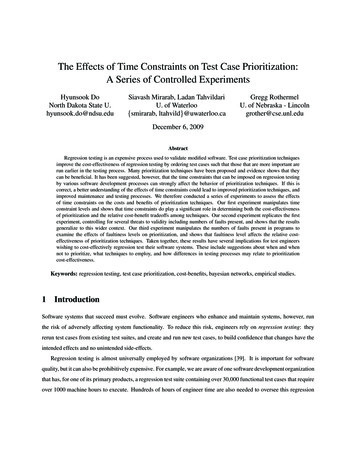
4. Repeat – Step 3 should be repeated until the list is narrowed down to the desired number ofhealth priorities.Multi-voting Example: The following example illustrates how an LHD used the Multi-voting technique tonarrow down a list of ten health problems, identified by an agency self-assessment, to one priority focusarea for a quality improvement (QI) project. Table 2.1 illustrates the results of a three-round multivoting process implemented by a group of 6 project directors using the following steps:1. Round-one vote – On a note card, all participants anonymously voted for as many priority focusareas as desired.2. Update list – All votes were tallied and the six health indicators receiving three or more voteswere posted for the group to view.3. Round-two vote – All participants voted up to three times for the remaining health indicators.4. Update list – All votes were re-tallied and the three health indicators receiving less three ormore votes were posted for the group to view.5. Round-three vote - All participants voted up to two times and the only item with three or morevotes, “Effective Media Strategy,” was the chosen focus area for a QI project.Table 2.1: Three-Round Multi-voting ExampleJane Doe County Health Department wanted to prioritize one health problem to address with fundsfrom a small grant. They began with a list of 12 health problems, which they identified throughstandards and measures where they scored poorly on PHAB’s self-assessment tool. The directorconvened the management team and implemented the multi-voting method to select the priority area.Health IndicatorRound 1 VoteRound 2 VoteCollect and maintain reliable, comparable, and validdata Evaluate public health processes, programs, andinterventions.Maintain competent public health workforce Implement quality improvement of public healthprocesses, programs, and interventionsAnalyze public health data to identify healthproblemsConduct timely investigations of health problems incoordination with other governmental agencies andkey stakeholdersDevelop and implement a strategic planProvide information on public health issues andfunctions through multiple methods to a variety ofaudiencesIdentify and use evidence-based and promisingpracticesConduct and monitor enforcement activities forwhich the agency has the authorityConduct a comprehensive planning processresulting in a community health improvement planIdentify and implement strategies to improve access Round 3 Vote
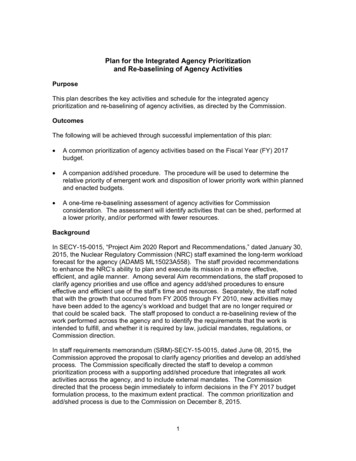
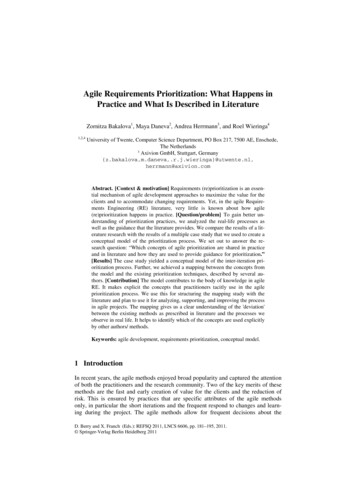
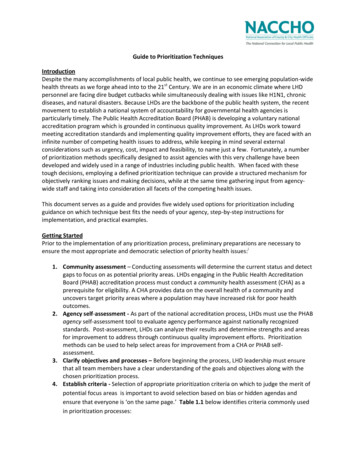
to healthcare servicesRed Round 1 EliminationGreen Round 2 EliminationBlue Round 3 EliminationStrategy Grids ivStrategy grids facilitate agencies in refocusing efforts by shifting emphasis towards addressingproblems that will yield the greatest results. This tool is particularly useful when agencies are limited incapacity and want to focus on areas that provide ‘the biggest bang for the buck.’ Rather than viewingthis challenge through a lens of diminished quality in services, strategy grids can provide a mechanism totake a thoughtful approach to achieving maximum results with limited resources. This tool may assist intransitioning from brainstorming with a large number of options to a more focused plan of action.The strategy grid below provides an example of an LHD’s effort to refocus efforts towards programs thatwill feasibly result in the greatest impact. Refer to the example strategy grid below while workingthrough the step-by-step instructions.Step-by-Step Instructions:1.Select criteria – Choose two broad criteria that are currently most relevant to the agency (e.g.‘importance/urgency,’ ‘cost/impact,’ ‘need/feasibility,’ etc.). Competing activities, projects orprograms will be evaluated against how well this set of criteria is met. The example strategy gridbelow uses ‘Need’ and ‘Feasibility’ as the criteria.2. Create a grid – Set up a grid with four quadrants and assign one broad criteria to each axis.Create arrows on the axes to indicate ‘high’ or ‘low,’ as shown below.3. Label quadrants – Based on the axes, label each quadrant as either ‘High Need/High Feasibility,’‘High Need/Low Impact,’ ‘Low Need/High Feasibility,’ ‘Low Need/Low Feasibility.’4. Categorize & Prioritize - Place competing activities, projects, or programs in the appropriatequadrant based on the quadrant labels. The example below depicts ‘Need’ and ‘Feasibility’ asthe criteria and items have been prioritized as follows:High Need/High Feasibility – With high demand and high return on investment,these are the highest priority items and should be given sufficient resources tomaintain and continuously improve.Low Need/High Feasibility – Often politically important and difficult toeliminate, these items may need to be re-designed to reduce investment whilemaintaining impact.High Need/Low Feasibility – These are long term projects which have a greatdeal of potential but will require significant investment. Focusing on too manyof these items can overwhelm an agency.Low Need/Low Feasibility – With minimal return on investment, these are thelowest priority items and should be phased out allowing for resources to bereallocated to higher priority items.
Strategy GridhighFeasibilityLow Need/High FeasibilityHigh Need/High FeasibilitySixteen parenting classes in aprimarily aging community witha low teen pregnancy rateHigh blood pressure screeningprogram in a community withrapidly increasing rates ofstrokeLow Need/Low FeasibilityHigh Need/Low FeasibilityInvesting in health educationmaterials in Spanish in acommunity with 1% nonEnglish speaking populationAccess to dental care in acommunity with a largelyuninsured population.lowlowNeedhighNominal Group Technique vThe Nominal Group Technique (NGT) has been widely used in public health as a mechanism forprioritizing health problems through group input and information exchange. This method is useful inthe early phases of prioritization when there exists a need to generate a lot of ideas in a short amountof time and when input from multiple individuals must be taken into consideration. Often, the Multivoting Technique is used in conjunction with NGT whereby NGT can be used to brainstorm ideas andcreate a broad list of possibilities and Multi-voting can be used to narrow down the list to pinpoint thetop priorities. One of the greatest advantages of using this technique is that it is a democratic processallowing for equal say among all participants, regardless of position in the agency or community.Step-by-Step Instructions:1. Establish group structure – Establish a group of, ideally, 6-20 people to participate in the NGTprocess and designate a moderator to take the lead in implementing the process. Themoderator should clarify the objective and the process.2. Silent brainstorming – The moderator should state the subject of the brainstorming and instructthe group to silently generate ideas and list them on a sheet of paper.3. Generate list in round-robin fashion – The moderator should solicit one idea from eachparticipant and list them on a flip chart for the group to view. This process should be repeateduntil all ideas and recommendations are listed.
4. Simplify & clarify –The moderator then reads aloud each item in sequence and the groupresponds with feedback on how to condense or group items. Participants also provideclarification for any items that others find unclear.5. Group discussion – The moderator facilitates a group discussion on how well each listed itemmeasures up to the criteria that was determined by the team prior to the NGT process.6. Anonymous ranking – On a note card, all participants silently rank each listed health problemson a scale from 1 to 10 (can be altered based on needs of agency) and the moderator collects,tallies, and calculates total scores.7. Repeat if desired – Once the results are displayed, the group can vote to repeat the process ifitems on the list receive tied scores or if the results need to be narrowed down further.John Doe County Health Department: Nominal Group Technique ExampleThe John Doe County Health Department (JDCHD) implemented NGT to choose one priority focus areafor a QI project. In an effort to remain objective, the process was facilitated by an external consultantand the decision making team was a large group of 27 program and division managers and staff fromthroughout the agency. The goal of the exercise was to identify a focus area for a QI project based onthe following criteria: 1) areas of weakness determined by agency self-assessment results; 2) the degreeto which the health department is used for a particular service; and 3) the level of impact the healthdepartment can make to bring forth an improvement. In preparation for the exercise, the group wasalso provided with a detailed report of findings from the agency self-assessment to read prior to thedecision-making process. From this point, the following steps were followed to identify a primary focusarea for improvement:1. Silent brainstorming – Two weeks in advance of the meeting, team members were providedwith results of the self-assessment for review and to individually brainstorm ideas on whichhealth issues should be the focus of a QI project.2. Generate list – At the start of the meeting, the facilitator collected potential health issues fromall group members, one by one, and recorded them on a flip chart. The list was simplified bycombining and grouping similar items, resulting in the 6 potential health indicators shown inTable 3.1.3. Group discussion – The facilitator led a discussion where everyone was given the opportunityto provide input on how each of the 6 priorities measured up against the criteria previouslyestablished.4. Anonymous voting – Following the meeting, all group members individually completed an online ranking for their top three choices by assigning a number of 1-3 next to each option, with 1being the last choice and 3 being the first choice.5. Calculate priority score – The total priority scores were calculated by adding scores given byevery group member for each item on the list Table 3.1 shows a compilation of the rankingsfrom the 27 group members with improved communication and coordination betweendivisions and programs within the health department as the top priority:Table 3.1: Count of Staff Responses to QI Focus AreasPriority Health Indicator1stChoiceScore 32nd ChoiceScore 23rd ChoiceScore 1Total ScoreImprove communication and coordinationbetween divisions and programs within health46630
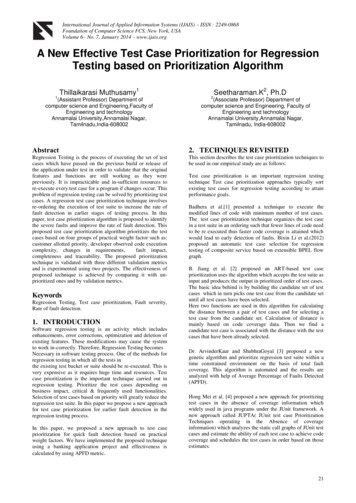
departmentEngage policymakers and community to supporthealth department initiativesPromote understanding of public health ingeneral and health department as anorganization among stakeholders (may includeinternal and external stakeholders)Better utilize data and best practices to informhealth department program decisions and togenerate community support and understandingof the health department’s role and contributionto public healthEstablish a health department presence andrecognition at a level comparable to other majorCity departments16318316172462045527The Hanlon Method viDeveloped by J.J. Hanlon, the Hanlon Method for Prioritizing Health Problems is a well respectedtechnique which objectively takes into consideration explicitly defined criteria and feasibility factors.Though a complex method, the Hanlon Method is advantageous when the desired outcome is anobjective list of health priorities based on baseline data and numerical values.Step-by-Step Instructions:1. Rate against specified criteria – Once a list of health problems has been identified, on a scalefrom zero through ten, rate each health problem on the following criteria: size of healthproblem, magnitude of health problem, and effectiveness of potential interventions. It isimportant to remember that this step requires the collection of baseline data from thecommunity such as from a community health assessment. Table 4.1 illustrates an examplenumerical rating system for rating health problems against the criteria.Table 4.1The Hanlon Method: Sample Criteria RatingRating9 or 107 or 85 or 63 or 41 or 20Guiding considerationswhen ranking healthproblems against the 3criteriaSize of Health Problem(% of population w/healthproblem) 25%(STDs)10% - 24.9%1% - 9.9%.1% - .9%.01% - .09% .01%(Meningococcal Meningitis)Size of health problemshould be based onbaseline data collectedfrom the individualcommunity.Seriousness of HealthProblemEffectiveness of InterventionsVery serious(e.g. HIV/AIDS)Relatively SeriousSeriousModerately SeriousRelatively Not SeriousNot Serious(teen acne)Does it requireimmediate attention?Is there public demand?What is the economicimpact?What is the impact on80% - 100% effective(e.g. vaccination program)60% - 80% effective40% - 60% effective20% - 40% effective5% - 20% effective 5% effective(access to care)Determine upper and lowmeasures for effectivenessand rate health problemsrelative to those limits.For more information onassessing effectiveness of
quality of life?Is there a highhospitalization rate?interventions, visithttp://www.communityguide.org to view CDC’s Guide toCommunity PreventiveServices.*Note: The scales in Table 1 are arbitrary models of how numerical scales are established and are not based on realepidemiological data; LHDs should establish scales that are appropriate for the community being served.2. Apply the ‘PEARL’ test - Once health problems have been rated by criteria, use the ‘PEARL’ Test,to screen out health problems based on the following feasibility factors:Propriety – Is a program for the health problem suitable?Economics – Does it make economic sense to address the problem? Are thereeconomic consequences if a problem is not carried out?Acceptability – Will a community accept the program? Is it wanted?Resources – Is funding available or potentially available for a program?Legality – Do current laws allow program activities to be implemented?Eliminate any health problems which receive an answer of “No” to any of the above factors orproceed with corrective action to ensure that potential health priorities meet all five of thefeasibility factors.3.Calculate priority scores – Based on the three criteria rankings assigned to each health problemin Step 1 of the Hanlon Method, calculate the priority scores using the following formula:D [A (2 x B)] x CWhere:D Priority ScoreA Size of health problem rankingB Seriousness of health problem rankingC Effectiveness of intervention ranking*Note: Seriousness of health problem is multiplied by two because according to the Hanlon technique, it is weighted asbeing twice as important as size of health problem.4.Rank the health problems – Based on the priority scores calculated in Step 3 of the HanlonMethod, assign ranks to the health problems with the highest priority score receiving a rank of‘1,’ the next high priority score receiving a rank of ‘2,’ and so on.McLean County Health Department - The Hanlon Method Example:As a part of the Illinois Project for Local Assessment of Needs (IPLAN), a community health assessmentand planning process, the McLean County Health Department (MCHD) used the Hanlon Method toprioritize health problems in the community. After determining the top eight health problems from thecommunity health assessment data, MCHD used the Hanlon Method to establish the top three focusareas the agency should address. The following steps were taken to implement the prioritizationprocess:
1. Rate against specified criteria – To rate each health problem, MCHD used the followingconsiderations for each Hanlon criterion. Table 3.2 illustrates the top three of the eight healthproblems and corresponding ratings for each criterion.Size of the problem – the percentage of the population with the problem, with anemphasis on the percentage of the population at risk for the problemSeriousness of the problem – morbidity rates, mortality rates, economic loss, and thedegree to which there is an urgency for interventionEffectiveness of the intervention – the degree to which an intervention is available toaddress the health problem2. Apply the ‘PEARL’ test – After long discussion, all eight health problems passed the ‘PEARL’ testas the interventions for each problem were judged to be proper, economical, acceptable,feasible based on available resources, and legal.3. Calculate the priority scores – Priority scores were calculated by plugging in the ratings fromColumns A through B into the formula in Column D. The calculations of the top three priorityscores are illustrated in Table 3.2Table 4.2: MCHD Hanlon Priority ScoringHealth ProblemCancerCerebrovascularDiseaseHeart Disease10CEffectiveness ofIntervention6DPriority Score(A ngston County Department of Health - The ‘PEARL’ Test Example:Often, the ‘PEARL’ component is pulled out of the Hanlon Method and applied on its own or used inconjunction with other prioritization techniques. The following example illustrates how the LivingstonCounty Department of Health (LCDOH) in New York applied the “PEARL” test to assist in the selection ofa QI project in preparation for accreditation.The LCDOH accreditation team was comprised of the agency’s center directors and supervising staff andthe process was facilitated by an external consultant to ensure objectivity and minimization of bias.Initially, the team completed a scoring matrix to identify areas of weakness and came up with thefollowing focus areas: engaging in research, connectedness to universities, strategic planning, anddevelopment and maintenance of an effective performance appraisal system. Once the team reached aconsensus on these potential focus areas, a ‘process of elimination’ tactic was employed by utilizing the‘PEARL’ Test. The facilitator led the group through a discussion allowing all team members to provideinput on how well each focus area measured up to the ‘PEARL’ feasibility criteria. Upon consideration ofthe criteria, LCDOH initially eliminated engagement in research and connectedness to universitiesbecause the group felt that, at that time, any time or resources put into these issues would yieldminimal results. Additional focus areas were also eliminated until, ultimately, the group agreed thatimproving and maintaining an effective performance appraisal system passed all ‘PEARL’ criteria. Sincethe previous system lacked basic core competencies, as a part of a QI project, LCDOH went on to
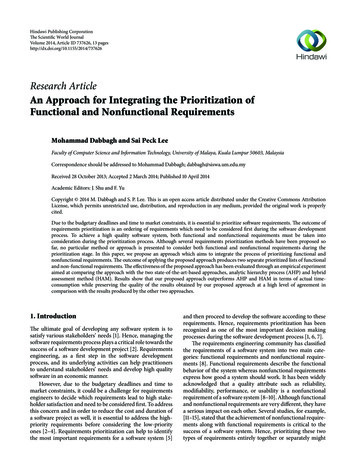
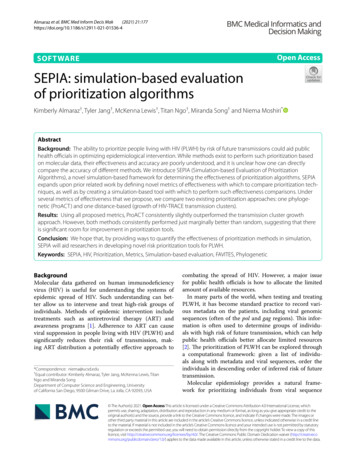
develop a new performance appraisal system which incorporated eight fundamental core competencieswhich all staff are expected to meet. The new system was tested and changes were made based onfeedback provided from the staff. In an effort to continually improve the system, each center isdeveloping more specific competencies for particular job titles.Prioritization Matrix ivA prioritization matrix is one of the more commonly used tools for prioritization and is ideal whenhealth problems are considered against a large number of criteria or when an agency is restricted tofocusing on only one priority health issue. Although decision matrices are more complex thanalternative methods, they provide a visual method for prioritizing and account for criteria with varyingdegrees of importance.Step-by-Step Instructions:The following steps outline the procedure for applying a prioritization matrix to prioritize health issues.While working through each step, refer to Table 4.1 below for a visual representation:Table 5.1: Example Prioritization MatrixCriterion 1(Rating X Weight)Health Problem A 2 X 0.5 1Health Problem B 3 X 0.5 1.5Health Problem C 1 X 0.5 0.5Criterion 2(Rating X Weight)1 X .25 .252 X .25 0.51 X .25 .25Criterion 3(Rating X Weight)3 X .25 .752 X .25 0.51 X .25 .25Priority Score22.511.Create a matrix – List all health issues vertically down the y-axis (vertical axis) of the matrix andall the criteria horizontally across the x-axis of the matrix so that each row is represented by ahealth issue and each column is represented by a criterion. Include an additional column for thepriority score.2. Rate against specified criteria – Fill in cells of the matrix by rating each health issue against eachcriterion which should have been established by the team prior to beginning this process. Anexample of a rating scale can include the following:3 criterion met well2 criterion met1 criterion not met3.Weight the criteria – If each criterion has a differing level of importance, account for thevariations by assigning weights to each criterion. For example, if ‘Criterion 1’ is twice asimportant as ‘Criterion 2’ and ‘Criterion 3,’ the weight of ‘Criterion 1’ could be .5 and the weightof ‘Criterion 2’ and ‘Criterion 3’ could be .25. Multiply the rating established in Step 2 with theweight of the criteria in each cell of the matrix. If the chosen criteria all have an equal level ofimportance, this step can be skipped.4. Calculate priority scores – Once the cells of the matrix have been filled, calculate the finalpriority score for each health problem by adding the scores across the row. Assign ranks to thehealth problems with the highest priority score receiving a rank of ‘1.’
Lawrence-Douglas County Health Department: Example Prioritization MatrixPrior to beginning the prioritization process, Lawrence-Douglas County Health Department (LDCHD)developed a decision-making team which was comprised of ten people including directors andcoordinators from throughout the department. Next, upon completion of an agency self-assessment,LDCHD identified areas of weakness and created a list of three potential health indicators to improveupon, along with five criteria found to be most relevant in pinpointing which health indicator will proveto have the greatest impact on the needs of Lawrence-Douglas County. Once these variables weredetermined, the groundwork was in place and LDCHD was ready to use a prioritization matrix to weighthe identified health indicators against each criterion to make a final decision on a focus area for a QIproject. The following steps were used to implement the process:1. Create a matrix – LDCHD used the prioritization matrix shown in Table 4.2, with the chosenhealth indicators listed on the Y-axis and each criterion listed across the X-axis:Table 5.2: LDCHD Prioritization MatrixEvaluative CriteriaProposed Area forImprovement Based onLHD Self-AssessmentMedia strategy &Communications to raisepublic health awarenessWork within network ofstakeholders to gather andshare data and informationContinuously developcurrent information onhealth issues that affect thecommunityLinkage toStrategicVision(.25)Do weneed toimprovethis area?(.25)What chance isthere that changeswe put into placewill make adifference?(.5)Likelihood ofcompletionwithin thetimeframe wehave(.5)Importance toCustomer (customer isthe one who wouldbenefit; could bepatient or community)(.75)Total Score3 X (.25)4 X (.25)4 X (.5)3 X (.5)3 X (.75)7.52 X (.25)3 X (.25)2 X (.5)1 X (.5)1 X (.75)3.54 X (.25)2 X (.25)3 X (.5)1 X (.5)2 X (.75)5*Note: The numerical rankings in Table 3.1 are meant to serve as an example and do not reflect the actual rankings fromLDCHD’s prioritization process.2. Rank each health indicator against criteria – Each member of the decision-making team wasgiven this prioritization matrix and asked to fill it out individually based on the following ratingscale:4 High priority3 Moderate priority2 Low priority1 Not priorityAfter completing the matrix, each team member individually discussed with the facilitators ofthe process the reasoning behind how the health indicators were rated.3. Weight the criteria – Although LDCHD weighted each criterion equally, (i.e. each criterion wasassigned a multiplier of 1) the numbers in red provide an arbitrary example of how an agency
could assign weights to the criteria based on per
This document serves as a guide and provides five widely used options for prioritization including guidance on which technique best fits the needs of your agency, step-by-step instructions for implementation, and practical examples. Getting Started Prior to the implementation of any prioritization process, preliminary preparations are necessary to