Transcription
2021 Q3 Crypto TradingIndustry ReportTokenInsight ResearchOct. 2021TokenInsight.com
Table of ContentsF I N D , C R E AT E , A N D S P R E A D VA L U E I N B L O C K C H A I N .2Market Overview3Spot: Trading Volumes and CEXes9Spot: Trading Volumes and DEXes10Spot: DEXes VS CEXes11Perpetual Swaps: Overview13Perpetual Swaps: Exchanges14Perpetual Swaps: Open Interests15Futures: Overview17Futures: Exchanges18Futures: Open Interest19Options: Overview21Options: Exchanges22Options: Products & Put/Call Ratio23Options: Block Trades24Searching Trends27Summary and Outlook28 Cryptos’ market cap once doubled from bottom, and recovered from regulatoryshock. The 30% drop in trading volume has not stopped people's enthusiasm for cryptoderivatives investment. The overall spot market was recovering during this quarter, but the total tradingvolume was still less than the previous quarter. CME continues to take over the market share of exchanges with Chinesebackgrounds such as OKEx and Huobi. Bitcoin's popularity has being surpassed by Ethereum in some regions.Looking for Research Analysts to buidl together. If you are a crypto expert,and enthusiastic about DeFi, Web3.0, NFTs, GameFi, etc, welcome reachingout to us.Email us: research@tokeninsight.com
Market Overview
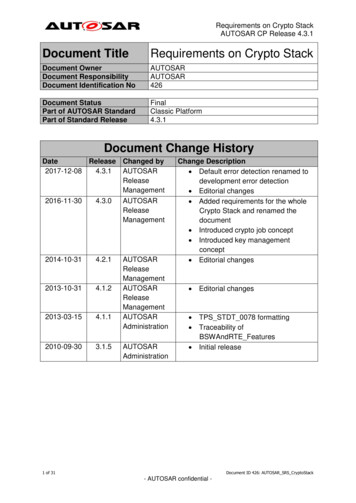
Market OverviewThe market is recovering from the bottom.F I N D , C R E AT E , A N D S P R E A D VA L U E I N B L O C K C H A I N . 600bTotal Trading Volume (Left)BTC Price (Right)2021-07-20FTX raised the largestfunding round in cryptohistory ( 900m). And it’svaluation rose to 18bafter this.2021-08-06Binance restrictedDerivatives ProductsOfferings in Hong Kong.2021-07-30 ed inJapan.Central bank of China issued anotice on further preventing anddisposing of crypto trading.Binancediscontinuedits services inNorway.2021-09-26Huobi Global to gradually clear upexisting mainland China users.Unavailability of Futuresand Derivatives Products inGermany, Italy, and theNetherlands. 400b 51,2502021-07-19Binance completed the16th quarterly BNB tokenburn of 1,296,728 BNB. 42,500 200b 33,7502021-09-28BitMart to stop servingmainland China users.2021-08-26FTX invested 120m in Japaneseexchange 1/8/182021-09-30CoinEx to remove allmainland users in e: Coinmarketcap, Coingecko, gvol.io, skew, TokenInsight. Date: 2021.09.30
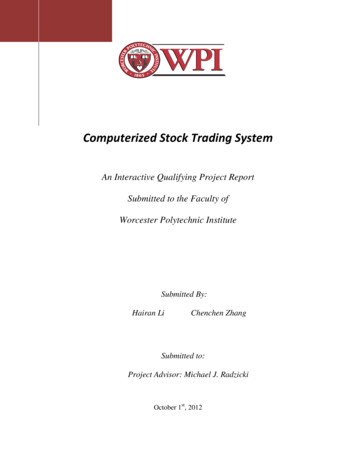
Market OverviewThe 30% drop in trading volume has not stopped people's enthusiasm for cryptoderivatives investment.F I N D , C R E AT E , A N D S P R E A D VA L U E I N B L O C K C H A I N .Trading Volumes of Spot and Derivatives in 2021Q3Spot / Derivatives Trading Volume Ratio in 2021Q3SpotDerivativesSpot / Derivatives Trading Volume Ratio2.5091.472 21.1tSpot: -39.70%0.9270.8470.717Derivatives: -31.01%0.627 16.5t 15.2t2020Q2 14.6t 14.0t Q3 Regulatory and the withdrawal of investors in mainland Chinamay be the main reasons for the decline in trading volume. Interestingly, although the regulatory impact continued, thespot/derivatives trading volume ratio reached a new low record(0.627), which means that investors’ enthusiasm for cryptoderivatives has not declined due to changes in the macroenvironment. 4.0t 2.2t2021Q1In 2021Q3, the crypto market's trading volume shrank by morethan 30%. The spot trading volume fell to 9.1t, and thederivatives trading volume fell to 14.6t, a decrease of 39.70%and 31.01% respectively compared with 2021Q2. 5.4t 2.7t2020Q4 9.1t 5.4t2020Q35Source: Coinmarketcap, Coingecko, TokenInsight. Date: 2021.09.30
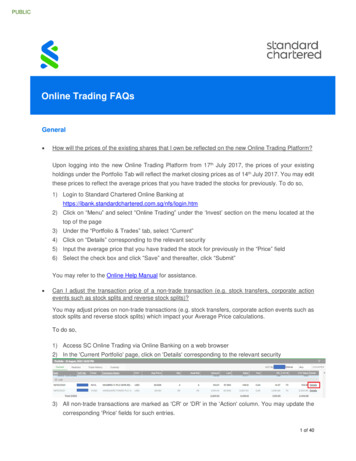
Market OverviewCryptos’ market cap once doubled from bottom, and recovered from regulatory shock.F I N D , C R E AT E , A N D S P R E A D VA L U E I N B L O C K C H A I N .Trading Volumes and Market Cap Changes in 2021Q3 3,000bTotal Market CapTotal Trading Volume 2,700b 2,400b The trough of crypto market ended in late July. OnJul 20, the total market value of the crypto marketreached the lowest point of 1.19t, but then roseall the way to 2.38t on Sept 7, nearly doubled. The liquidation of derivatives leverage in thecrypto market in Sept had a certain downwardimpact on the market cap, and the regulatoryfallout in mainland China at the end of Septembercaused the market cap to drop to around 1.91t atthe end of 2021Q3. However, from the perspective of monthly data,both the market cap and the crypto market tradingvolume are recovering significantly. The cryptomarket has come out of its trough.Sep 7: 2,376bJul 1: 1,420b 2,100b 1,800bJul 20: 1,192bSep 30: 1,908b 1,500b 1,200bTotal TradingVolume: 8,549b 900b 600b 300b2021/7/1Total TradingVolume: 9,141bTotal TradingVolume: 6,038b2021/7/312021/8/302021/9/296Source: Coinmarketcap, Coingecko, TokenInsight. Date: 2021.09.30
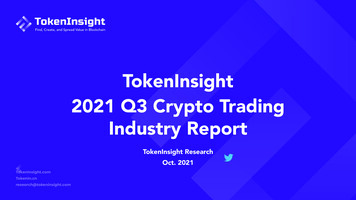
Market OverviewPerpetual is still the most popular product, while the proportion of spot trading volumebroke through 40% again at the end of 2021Q3.F I N D , C R E AT E , A N D S P R E A D VA L U E I N B L O C K C H A I N .Proportion of Different Crypto Products Trading Volume in 2021Q3PerpetualOptionsSpot41.73%Spot In 2021Q3, the trading volume of perpetualcontracts accounted for 56.5%, while the tradingvolume of other derivatives declined. The totaltrading volume of options and futures justexceeded 5% of the crypto market. Spot trading is one of the main driving forces inthe recovery period of the crypto market, and itsproportion has increased from 36.9% in Jul to40.38% in Sep, while the proportion of monthlytrading volume in perpetual contracts has declinedmonth by month. The enthusiasm of the NFT market has boosted thedemand for ETH and investment in related projecttokens, while the anti-inflation demand haspromoted the spot trading of BTC, which may besome of the reasons for the increase in spot rce: Coinmarketcap, Coingecko, TokenInsight. Date: 2021.09.30
Spot
Spot: Trading Volumes and CEXesThe overall spot market was recovering during this quarter, but the total tradingvolume was still less than the previous quarter.F I N D , C R E AT E , A N D S P R E A D VA L U E I N B L O C K C H A I N .9Trading Volumes of Spot and Top15 Spot CEX* in 2021 Q3 & Q2Total Trading Volumeof Spot in Q3RatingsAA 2,055.62b -42.50%BinanceBBBOKEx 505.42b -42.37%AHuobi 474.11b -58.96%AA 1,155b 293.57b -36.92%Coinbase 465b 184.80b 14.43%FTXACrypto.comAKuCoinBBBKraken 89.82b -57.69%BBBBinance US 70.80b -33.06%AGate.io 58.44b -58.32%BBBitstamp 36.68b -56.65%BBMEXC Global 36.11b -67.35%Phemex 32.53b -43.24%BBBBBAAXGemini* including more than 210 spots exchanges thatTokenInsight are tracking. 877bABB 9,139.33b 3,575b The spot trading industry was gradually recovering from thebearish of the last quarter, as the volume of spot tradingmaintained an uptrend during Q3. However, the volume ofQ3 is still less than Q2, dropping about 39.43%. This mainlycorresponds to the decline in the market heat, followed by thetightening of supervision and diversion from decentralizedexchanges. The spot trading volume of most centralized exchanges(among the top 15 CEX) decreased in the third quarter exceptfor FTX, crypto.com, and AAX. A series of Chinese-based exchanges such as Huobiannounced to clear up existing Chinese users due to China’sregulatory policies. Although the influence of these events didnot show up in the September volume, it might cause adecline in the trading volume of Q4. 161b 138.08b 313.82%Trading Volume in 2021Q3Trading Volume in 2021Q2 33b 129.49b -25.00% 173b 212b 106b 140b 85b 6,596b 5,523b 111b 2,969b 57b 3,222b 3,690b 2,227b 17.71b 226.96% 5b 16.99b -41.05% 29bAprMayJunJulAugSep*Screening criteria: first sort the spot exchanges according to TokenInsight’s exchange ratings from high to low, and then rank the exchanges again according to the trading volume.Source: Coingecko, TokenInsight. Date: 2021.09.30
Spot: Trading Volumes and DEXesThe DEXes on Solana were taking advantages of the fast-growth of Solana Ecosystem. 42b104.45b50.61%10JulAug 70bApr May15.56b33.66%*Uniswap V3 reached 104.45 billion in trading volume forthe third quarter, which is 50.61% higher than the secondquarter. Meanwhile, the trading volume of Uniswap V2 inthis quarter was reduced by 68.57%. In Q3, the two Solana DEXes, Raydium and Serum keptgrowing with the explosion of Solana, and the tradingvolume of the two exchanges increased around 36.66%and 6.8% respectively. The trading volume of MDEX declined about 72.51% inQ3, and its monthly trading volumes represented a downtrend in this quarter.rncelaBamRaydiueshiCurvapisw4.72b-48.35% DEXes showed the same trend as CEXes, since the spottrading volume was increasing during the Q3, and the totalvolume is less than the last m 8bisw Aug .57% 105b 113b 106b 93b 17bCompared to the previous quarter, the trading volumes ofthe majority of the top 10 decentralized exchangesdecreased in Q3 in addition to Uniswap V3, Raydium, andSerum. 206bnc 25b63.64b-30.65%Ba63.72b-72.51% Sep 34bUnF I N D , C R E AT E , A N D S P R E A D VA L U E I N B L O C K C H A I N .Trading Volumes of Top10 Spot DEX* in 2021 Q3 &Q2**Screening criteria: first sort the decentralized exchanges according to TVL ranking of Defi Llama from high to low, and then rank the exchanges again according to the trading volume.*The value labels on the bars shows the trading volumes of each DEX in Q3, and the percentage values represent the percentage changes of each DEX’s trading volume between Q2 and Q3.*The quarterly volume change of Raydium is for reference only since the trading volume between April 1st to April 13th is not available.Source: Coingecko, Token Terminal, Defi Llama, TokenInsight. Date: 2021.09.30
Spot: DEXes VS CEXesThe Proportion of Top 10 CEXes’ Trading Volume Is Diverted By DEXes And OtherCEXes.Exchange Token’s Performance in 2021 CSTFTORCT Most of exchange tokens shown in the graphs have a positive price change in this quarter, except for HT, MDX, and BAL. The price of HT and MDX fell the most, about 24.64% and 25% respectively,which was influenced by the regulations of China. Due to the bloom of Solana Ecosystem, the tokens of two Solana’s DEXes (Raydium and Serum)witnessed remarkable growth, accounting for 103.15% and 173.16% respectively. The prices of FTT and MX also went up a lot, which might indicate the expansion of FTX and MEXCGlobal.Others52.37%The top 10 DEXes was gaining more share of thespot market, while the market share of the top 10CEXes was diverted from the DEXes and otherCEXes.HNBSpotDX-25.00%-24.64% 34.91%14.79%TOP10 CEXes43.77%Top10 DEXes3.86%46.06%45% 33.31%TOthers51.80%83.13%NTop10 DEXes1.84%103.15%91.87%90%173.16%BTOP10 CEXes46.36%BF I N D , C R E AT E , A N D S P R E A D VA L U E I N B L O C K C H A I N .Trading Volumes of DEXes11Source: Coingecko, TokenInsight. Date: 2021.09.30
Perpetual Swaps
Perpetual Swaps: OverviewPerpetual trading volume in 2021Q3 declined 28.79% compared with 2021Q2.F I N D , C R E AT E , A N D S P R E A D VA L U E I N B L O C K C H A I N . 60,000The Trading Volume of Perpetuals in Q39.7:Trading Volume: 294.17bBTC Change: -19.10% 50,000* including the 47 derivatives exchanges thatTokenInsight continues to track. 200b 30,000 Overall Cryptocurrency Market Trading Volumeshrank in 2021Q3. The trading volume ofperpetual in Q3 declined 28.79% ( 5,429b)compared with Q2. However, it is still 8.37%( 1,037b) more than the total trading volume ofderivatives in 2020. There is an upward trend in the monthly tradingvolume of perpetual in Q3. Among them,September has the highest volume ( 9,929b)and July has the lowest ( 3,499b). Perpetualtrading volume in September rose 101.56%compared with August. The fall of the price gave the perpetual tradingvolume power in a bull market. On September7, the bitcoin price fell 19%, while tradingvolume reached a short-term peak ( 294.17b)that day. 100b2021/7/12021/7/3120 Q12020 (All Derivatives) 13,428.40b 300b 40,00020 Q220 Q32021/8/3020 Q421 Q121 Q22021/9/2921 Q3 10,000b 2,112b 2,168b 2,716b 5,395b101.56%32.45% 7,500b2021 Q1 (Perpetual) 14,322.16b40.78% 5,000b2021 Q2 (Perpetual) 9,929b 18,857.24b 2,500b 4,926b 3,499b2021 Q3 (Perpetual)13BTC Price (Left)Daily Trading Volume(Right)Total Trading Volumeof Perpetual in Q3 400b 13,428.4b 5,000b 10,000b 15,000b 20,000bJulAugSepSource: TradingView, Coingecko, TokenInsight. Date: 2021.09.30
Perpetual Swaps: ExchangesThe market share of Binance rose to nearly half of the market in 2021Q3.37.2% 7,500bThe Trading Volume & Changes of Exchanges in Q3BinanceHuobiBybitTop4-Top10Others 5,970b27.6% 5,000b6.3%13.4%14.5%21 Q221 6%44.5%7.7% 2,500b 1,051b 1,016b 885b45% 852b 178b 178b 0b-15%-15%-27%Vol.30% 138b 56b 41b 30b-21%-38% 5,969.84 BBBOybitBbiuoHceaninAABBBBBB 1,050.79 BVol. 1,016.25 BIn terms of trading volume in Q3, most of exchanges haddifferent degrees of decline compared with Q2. Onlythree exchanges (Gate.io, KuCoin, CoinEx) saw a rise intrading volume, up 45%, 30% and 184% respectivelyrelative to Q2. From the perspective of relative market share, the shareof trading volume of the Top 10 exchanges rose from72.4% to 93.7%. Meanwhile the market share of Binanceincreased further, approaching half of the market share(44.5%).-85%RatingVol. -48%-58%BF I N D , C R E AT E , A N D S P R E A D VA L U E I N B L O C K C H A I N .Trading Volume (Left)Change of Volume (Right)14Source: Coingecko, TokenInsight. Date: 2021.09.30
Perpetual Swaps: Open InterestThe open interest of perpetual swaps rose by 49.88% in Q3.F I N D , C R E AT E , A N D S P R E A D VA L U E I N B L O C K C H A I N .9.6: 37.81bPerpetual Open interest in Q3 40b The open interest of perpetual swapsshowed an overall upward trend in Julyand August, with open interest at 14.62b at the beginning of Q3 and 37.81b on Sep 6. The open interest ofperpetual swaps rose by 49.88% in Q3. The open interest of perpetual swapsreached its peak ( 37.81b) on Sep 6.However, the open interest of perpetualfell by 1/3 ( 12.54b) the following daywith the price of bitcoin plunging19.10%. Among the 11 derivatives exchanges, allexchanges saw an increase in the OI ofperpetual contracts in Q3. Only threeexchanges (FTX, KuCoin, CoinEx) saw arise more than 100% in trading volume,up 103.18%, 106.54% and 192.81%respectively relative to Q2.Decline:57.85% 32b9.30: 21.92b 24b 16b 8b2021/7/1BinanceChangeof /9/30MEXCBitMEXGate.ioKuCoinMEXC26.21% 103.18% 2.81% 90.77%15Source: Coingecko, TokenInsight. Date: 2021.09.30
Futures
Futures: OverviewCompared with the previous two seasons, the trading volume of Q3 isalmost cut in half to 1110b.F I N D , C R E AT E , A N D S P R E A D VA L U E I N B L O C K C H A I N .Trading volume of the previous 3 quarters 2,200b 2,184bDaily trading volume in Q3 30b 2,074bSep 7: 25.24b 23.5b 1,787.5b 17b 1,375b 1,110bJul 11: 5.02b 10.5b 962.5b 4b2021/7/1 550bQ1Q22021/7/312021/8/302021/9/29Q3 The trading volume of Q3 was nearly cut in half to 1110b, decreased by 49.2% and 46.5% compared with Q2 and Q1 respectively. September 7 has the highest daily trading volume with the amount of 25.24b partly because of the liquidation of derivative market.July 11 had the lowest daily trading volume; The amount was 5.02b. Generally speaking, September has more volatility than other months with respect to daily trading volume.17Source: Defi Liama, gvol.io TokenInsight. Date: 2021.09.30
Futures: ExchangesThe market share of CME tripled in Q3 with Chinese-background exchangessuch as OKEx and Huobi cutting in half.F I N D , C R E AT E , A N D S P R E A D VA L U E I N B L O C K C H A I N .Top 5 exchanges by trading volume of futures 1,200bQ1Q2Market Distributions in Q2 & Q3Q3 960b 720b2%2%2%1%2%3%3% 480b12% 240b bitOthers17%MarketShares in2021 Q255%13%MarketShares in2021 Q347%24%16% Top 5 exchanges by trading volume of futures have remained unchanged for the past three quarters with OKEx playing the leading role. Due to the suppression of cryptocurrency in China, trading volume of futures has been cut in half in OKEx, Huobi and Binance while CMEexperiences a 3-fold increase as foreign investors become more and more interested in cryptocurrency. The market share of CME has increased from 3% in Q2 to 17% in Q3, surpassing those of Huobi and Binance as the second largest.18Source: gvol.io, Defi Liama, TokenInsight. Date: 2021.09.30
Futures: Open interestThe open interest of futures remained almost the same at the end of thequarter compared with that of July 1.F I N D , C R E AT E , A N D S P R E A D VA L U E I N B L O C K C H A I N .The Open Interest of Futures in Q3Sep 6: 8.57b 9.00b During the first two months of Q3, the value of openinterest gradually went upward but then dropped inSeptember. September 24 had the lowest openinterest with the amount of 5.15b due to the deliverof a large amount of futures. September 6 had the highest open interest whichthen dropped sharply. The reason behind this lies inthe liquidation caused by the sharp drop of price ofBitcoin. The open interest was almost the same when thequarter ended compared with that of July 1. OKEx and Huobi suffered a lot when Chinesegovernment launched ban on crypto trading. Thevalue of open interest decreased by 21.60% and26.5% respectively. In contrast, due to theglobalization of Binance, its open interest had a19.84% increase with CME increasing by 26.37%.Sep 24: 5.15b 6.00b 3.00b2021/7/12021/7/31OKExChangeof 26.37%-9.75%2.65%19Source: gvol.io, Defi Liama, TokenInsight. Date: 2021.09.30
Options
Options: OverviewOption is becoming the whales’ toy.Trading VoulumeF I N D , C R E AT E , A N D S P R E A D VA L U E I N B L O C K C H A I N .Options Quarterly TradingVolume in 2021* 140b 133.2bOptions Premium and Block Trades in 2021Q3* 90MPremium in Block TradePremium in Non-Block Trade-10.5% 119.2b 105b 67.5M-34.2% 78.49b 45M 70b 22.5M 35b7/1Q1Q27/167/318/158/309/149/29Q3 The trading volume of options in Q3 was 78.49b, decreased by 34.2% compared with Q2 ( 119.2b). From the perspective of monthly premiums, options trading was concentrated in Aug and Sep, and the premiums in the 2 monthsaccounted for about 79% of the total quarterly premiums. Block trades from institutional and professional investors are gradually occupying the mainstream of the market. The proportion ofblock trades has exceeded more than 30% in 2021Q3, which was only about 20% in Q2. Among them, about 34% of bitcoin optionspremium was from block trade, while Ethereum was about 23%.21*Only options trading volume & premium data on centralized exchanges are collected. Source: gvol.io, TokenInsight. Date: 2021.09.30
Options: ExchangesDeribit once again occupied more than 80% of the market in 2021Q3.Exchanges Ranked by Options Trading Volume in Q3Market Distributions in Q1 & Q2F I N D , C R E AT E , A N D S P R E A D VA L U E I N B L O C K C H A I N . 66.0bDeribit 92.4b 86.7b 9.8bOKEx 20.5bQ3 31.7bBit.comCMELedgerX 1.0b 3.9b 5.6b 0.8b 1.0b 1.0b 0.5b 0.6b 0.7b 25bQ1 Affected by regulation, the quarterly tradingvolume of options exchanges dominated byChinese customers fell by more than 50%, andsome exchanges fell by 73.3%. Both Deribit and CME options fell by about28%, which may be caused by crypto marketcycles. 0.4bBinance 0.2b 0.1bQ2Although Binance's options volume hasincreased by 67.2%, Deribit still dominates theoptions market, with its market share onceagain exceeding 80%. 50b 75b 100bBit.com3%Market Sharesin 2021 Q2OKEx17%Deribit78%Bit.com1%Market Sharesin 2021 ance22Source: gvol.io, TokenInsight. Date: 2021.09.30
Options: Products & Put/Call RatioThe scale of ETH options has exceeded 1/3 of BTC options.Put/Call Ratio in Q3BTC/ETH Options Trading Performance in Q3F I N D , C R E AT E , A N D S P R E A D VA L U E I N B L O C K C H A I N . 120bETH/BTC Options Trading Volume Ratio 112.38b0.3540.355BTC OptionsETH Options0.7 100b 88.01b0.125 80b 57.91b 60b0.652021Q12021Q22021Q30.6 40b 31.14bQ1Q2Q3 20bBTC 20.58b 14.10bETH The trading volume ratio of ETH to BTC options was basically the same asthat of the 2021Q2, but still much higher than that of the Q1. The marketdemand for ETH options is steadily rising. The Put/call ratio, which has continued to fall since July, shows that thebearish sentiment in the options market has continued to weaken, At thesame time, during this period, cryptos maintained a good upward trend,which seems to indicate that changes in the sentiment of the options marketmay herald future trends in prices.0.550.50.450.47/18/19/19/3023Source: gvol.io, TokenInsight. Date: 2021.09.30
Options: Block TradesWhales may have known the future.BTC Options Block Trades Distribution in 2021Q3F I N D , C R E AT E , A N D S P R E A D VA L U E I N B L O C K C H A I N .BTC-50000-CPremium: 59.54mContracts: 22,723Call Premium ValuePut Premium Value In 2021Q3, Bitcoin options block tradesconcentrated on call options with strike pricesof 40,000 and 50,000. On the whole, calloptions block trades accounted for themajority. Block traders in options seem to haveforeseen a market recovery and new highs.BTC-40000-CPremium: 48.02mContracts: 9,1341200015000 20000 24000 26000 28000 30000 32000 34000 36000 38000 40000 42000 44000 46000 48000 50000 52000 54000 56000 60000 65000 72000 80000 90000 120000 150000 200000 300000Strike Price ( )24Source: gvol.io, TokenInsight. Date: 2021.09.30
Options: Block TradesWhales may have known the future.ETH Options Block Trades Distribution in 2021Q3F I N D , C R E AT E , A N D S P R E A D VA L U E I N B L O C K C H A I N .Call Premium ValuePut Premium Value Similar to Bitcoin options, Ethereum optionstransactions are also concentrated at twostrike prices of 4000 and 5000. The block put/call ratios of Ethereum andBitcoin options are basically similar (0.34 vs0.35). Interestingly, the bullish sentiment ofwhales has always been higher than themarket 4000-CPremium: 11.21mContracts: 40004200ETH-5000-CPremium: 11.08mContracts: 56,1994500500070009000 15000 30000Strike Price ( )25Source: gvol.io, TokenInsight. Date: 2021.09.30
Users Search Trends
Search TrendsBitcoin's popularity has being surpassed by Ethereum in some regions.Comparison of search trends between BTC and ETH in 2021Q3F I N D , C R E AT E , A N D S P R E A D VA L U E I N B L O C K C H A I N . Bitcoin's search popularity stillsurpasses Ethereum in mostregions, especially in WestAfrica and Latin America. Prefer EthereumPrefer BitcoinHowever, in Iran, Japan, SouthKorea, Philippines and some otherregions, the search interest ofEthereum surpassed Bitcoin in Q3,which may be related to theactivity of NFT and GameFi boomin Asia and Iran's Bitcoin miningrestrictions in summer.27Source: Google Trends, TokenInsight. Date: 2021.09.30
Summary and OutlookF I N D , C R E AT E , A N D S P R E A D VA L U E I N B L O C K C H A I N .28In 2021Q3, we witnessed the process of thecrypto market returning from a trough to apeak.Affected by regulation, the total trading volumeof the crypto market in Q3 dropped by morethan 30% compared to Q2, and the overallmarket cap once shrank to 1.19t.Most exchanges suffered a certain amount oftraffic loss in the Q3. Among them, due toregulatory influence, the spot trading volume ofexchanges dominated by Chinese customersgenerally halved, while the exchanges withlighter losses also fell by more than 25% in spotvolume. A similar situation also occurs in thederivatives market.However, the continued high inflation and theincreasing possibility of "stagflation" broughtabout by the over-issue of the USD have onceagain stimulated investors' enthusiasm forbuying cryptos. Beginning from August,continuous spot purchases have nearly doubledthe crypto market cap.In contrast, exchanges that adopt internationalstrategy generally lose less, and even theirmarket share has increased. Facts have provedthat internationalization is always an importantguarantee against risks, whether forexchanges or institutions.Although the two significant volatility in thederivatives market in September had a certainimpact on the crypto market, the everincreasing trading volume showed that themarket has regained its vitality.From the options and futures data, we foundthat more and more institutions were involved.The ever-increasing Bitcoin futures openinterest in CME Exchange and block trades thataccount for more than 30% of the optionstrading volume remind us that the cryptomarket is ushering in a new peak, but theintervention of institutions has also made themarket more complex and changeable.Overall, 2021Q3 is one of the decisivemoments in the history of crypto. It is true thatthere has been a major reshuffle in the market,but this has also made the crypto market moremature and has won wider acceptance. Withthe official listing of the Bitcoin futures ETF inOctober, the road to a new peak for cryptomarket has been opened. Before themacroeconomic adjustment has a wide-rangingimpact on the market, we can still enjoyeverything that crypto bring.Let’s BUIDL and enjoy.
F I N D , C R E AT E , A N D S P R E A D VA L U E I N B L O C K C H A I N .29Don’t Trust. Verify!
Thank Youwww.tokeninsight.comresearch@tokeninsight.com
Proportion of Different Crypto Products Trading Volume in 2021Q3 Options 0.33% Futures 6.02% Perpetual 51.93% Spot 41.73% 2021Q2 2021Q3 In 2021Q3, the trading volume of perpetual contracts accounted for 56.5%, while the trading volume of other derivatives declined. The total trading volume of options and futures just exceeded 5% of the .