Transcription
A GUIDE TO ENERGY HEDGING1
Other Considerations . . . . . . . . . . . . . . . . . . . . . . . . . . . . . . . . . . . . . . . . . . . . . . . . . . .38Basis . . . . . . . . . . . . . . . . . . . . . . . . . . . . . . . . . . . . . . . . . . . . . . . . . . . . . . . . . . . . . .38Example 12 – Effect of Basis on a Fuel Dealer’s Hedge . . . . . . . . . . . . . . . . . . . .41Exchange of Futures for Physicals . . . . . . . . . . . . . . . . . . . . . . . . . . . . . . . . . . . . . . . .42Mechanics of an EFP . . . . . . . . . . . . . . . . . . . . . . . . . . . . . . . . . . . . . . . . . . . . . . . . .43Example 13 – Use of an EFP to Initiate a Position . . . . . . . . . . . . . . . . . . . . . . . .44Example 14 – Use of an EFP to Liquidate a Position . . . . . . . . . . . . . . . . . . . . . .44Blind vs. Selective Hedge . . . . . . . . . . . . . . . . . . . . . . . . . . . . . . . . . . . . . . . . . . . . . .46Technical Analysis . . . . . . . . . . . . . . . . . . . . . . . . . . . . . . . . . . . . . . . . . . . . . . . . . . . .46Charting Price Trend Lines . . . . . . . . . . . . . . . . . . . . . . . . . . . . . . . . . . . . . . . . . . . . .47Volume and Open Interest . . . . . . . . . . . . . . . . . . . . . . . . . . . . . . . . . . . . . . . . . . . . .48Options . . . . . . . . . . . . . . . . . . . . . . . . . . . . . . . . . . . . . . . . . . . . . . . . . . . . . . . . . . . . . . .50Determinants of an Options Premium . . . . . . . . . . . . . . . . . . . . . . . . . . . . . . . . . . . . .51Strike Price vs. Futures Price . . . . . . . . . . . . . . . . . . . . . . . . . . . . . . . . . . . . . . . . . . . .51Time Value . . . . . . . . . . . . . . . . . . . . . . . . . . . . . . . . . . . . . . . . . . . . . . . . . . . . . . . . .52Call/Put Parity . . . . . . . . . . . . . . . . . . . . . . . . . . . . . . . . . . . . . . . . . . . . . . . . . . . . . .52Volatility . . . . . . . . . . . . . . . . . . . . . . . . . . . . . . . . . . . . . . . . . . . . . . . . . . . . . . . . . .53Interest Rates . . . . . . . . . . . . . . . . . . . . . . . . . . . . . . . . . . . . . . . . . . . . . . . . . . . . . . .54Example 15 – Setting a “Cap” on Gasoline Prices by Buying Calls . . . . . . . . . . . .54Example 16 – Setting a “Floor” Against a Gasoline Price Declineby Buying Puts . . . . . . . . . . . . . . . . . . . . . . . . . . . . . . . . . . . . . . . . . . . . . . .55Example 17 – Purchasing an Out-of-the-Money Call to CapNatural Gas Prices in a Potential High-Volatility Market . . . . . . . . . . . . . . . .56Example 18 – Hedging Against a Natural Gas Price Decline ina Potential High-Volatility Market with Out-of-the-Money Puts . . . . . . . . . .57Collars . . . . . . . . . . . . . . . . . . . . . . . . . . . . . . . . . . . . . . . . . . . . . . . . . . . . . . . . . . . .58Example 19 – An Industrial Gas Consumer Uses a Collar to HedgeGas Prices at an Affordable Cost . . . . . . . . . . . . . . . . . . . . . . . . . . . . . . . . . . . . .58Example 20 – Setting a Floor With Crack Spread Options . . . . . . . . . . . . . . . . . .59Example 21 – Writing a Call Option . . . . . . . . . . . . . . . . . . . . . . . . . . . . . . . . . .60Example 22 – Creating a Fence With Crack Spread Options . . . . . . . . . . . . . . . .61Conclusion . . . . . . . . . . . . . . . . . . . . . . . . . . . . . . . . . . . . . . . . . . . . . . . . . . . . . . . . .62Exchange Information . . . . . . . . . . . . . . . . . . . . . . . . . . . . . . . . . . . . . . . . . . . . . . . . . . .6321
INTRODUCTION TO THE NEW YORKMERCANTILE EXCHANGESignificant, sometimes abrupt, changes in supply, demand, and pricing have touchedmany of the world’s commodity markets during the past 25 years, especially those forenergy. International politics, war, changing economic patterns, and structural changeswithin the energy industry have created considerable uncertainty as to the future directionof market conditions. Uncertainty, in turn, leads to market volatility, and the need for aneffective means to hedge the risk of adverse price exposure.The principal risk management instruments available to participants in the energy markets today are the versatile futures and options contracts listed on the New York MercantileExchange. The contracts are designed to meet the needs of the modern energy industry byencompassing the standards and practices of a broad cross-section of the trade.The Exchange is the world’s largest physical commodity futures exchange. Trading isconducted through two divisions: the NYMEX Division offers futures and options contractsfor light, sweet crude oil; heating oil; New York Harbor gasoline; natural gas; electricity; andplatinum; futures for propane, palladium, sour crude oil, Gulf Coast unleaded gasoline; andand options contracts on the price differentials between heating oil and crude oil, and NewYork Harbor gasoline and crude oil, which are known as crack spread options.The COMEX Division lists futures and options on gold, silver, copper, aluminum, andthe FTSE Eurotop 100 European stock index; and futures for the FTSE Eurotop 300 stock index.The NYMEX Division heating oil futures contract, the world’s first successful energyfutures contact, was introduced in 1978. The light, sweet crude oil contact, launched in1983, is the most actively traded futures contract based on a physical commodity in theworld. These contracts, and the others that make up the Exchange’s energy complex havebeen adopted as pricing benchmarks in energy markets worldwide.NYMEX ACCESS The Exchange’s electronic trading system, NYMEX ACCESS , allows trading inenergy futures and options, platinum futures and options, and other metals futures after thetrading floor has closed for the day. The NYMEX ACCESS trading session for light, sweetcrude oil; heating oil; New York Harbor unleaded gasoline; and the metals contracts beginsat 4 P.M. and concludes at 8 A.M. the following morning, Mondays through Thursdays. ASunday evening session commences at 7 P.M. When combined with the daily open outcrysession, NYMEX ACCESS extends the trading day to approximately 22 hours.33
Natural gas and propane are offered in abbreviated evening sessions. Electricity contracts trade exclusively on NYMEX ACCESS for approximately 23 hours a day.Terminals are in use in major cities in the United States and in London, Sydney, HongKong, and Singapore.Efficient Markets Require Diverse ParticipantsTo be efficient and effective risk management instruments, futures markets require amix of commercial hedgers and private speculators. The New York Mercantile Exchange’senergy markets have attracted private and institutional investors who seek to profit byassuming the risks that the underlying industries seek to avoid, in exchange for the possibility of rewards.These investors, in combination with hedgers, have brought a diversified balance ofparticipants to the Exchange’s markets.How a Transaction WorksThe execution of a transaction on the trading floor is a finely honed process that can becompleted in seconds. The open outcry auction process on the floor assures that transactions are completed at the best bid or offer.The process starts when a customer calls a licensed commodities broker with an orderto buy or sell futures or options contracts. The broker sends the order to his firm’s representative on the trading floor via telephone or computer link. An order slip is immediatelyprepared, time stamped, and given to a floor broker who is an exchange member standingin the appropriate trading ring.All buy and sell transactions are executed by open outcry between floor brokers in thesame trading ring. Buyers compete with each other by bidding prices up. Sellers competewith each other by offering prices down. The difference between the two is known as thebid-ask spread. The trade is executed when the highest bid and lowest offer meet. Whenthis trade is executed, each broker must record each transaction on a card about the size ofan index card which shows the commodity, quantity, delivery month, price, broker’s badgename, and that of the buyer. The seller must toss the card into the center of the trading ringwithin one minute of the completion of a transaction. If the last line on the card is a “buy,”43
the buyer also submits the card to the center of the ring; the card is retained by theExchange as part of the audit trail process. The cards are time-stamped and rushed to thedata entry room where operators key the data into the Exchange central computer.Meanwhile, ring reporters listen to the brokers for changes in prices and enter the changesvia hand-held computers, immediately disseminating prices to the commercial price reporting services as they simultaneously appear on the trading floor wallboards.Confirmation of each completed trade is immediately made by the floor broker’s clerkto the originating broker who then notifies his customer.55
FUTURESWhat are Futures?Futures contracts are firm commitments to make or accept delivery of a specifiedquantity and quality of a commodity during a specific month in the future at a price agreedupon at the time the commitment is made. The buyer, known as the long, agrees to takedelivery of the underlying commodity. The seller, known as the short, agrees to make delivery. Only a small number of contracts traded each year result in delivery of the underlyingcommodity. Instead, traders generally offset (a buyer will liquidate by selling the contract,the seller will liquidate by buying back the contract) their futures positions before their contracts mature. The difference between the initial purchase or sale price and the price of theoffsetting transaction represents the realized profit or loss.Futures contracts trade in standardized units in a highly visible, extremely competitive,continuous open auction. In this way, futures lend themselves to widely diverse participationand efficient price discovery, giving an accurate picture of the market.To do this effectively, the underlying market must meet three broad criteria: The pricesof the underlying commodities must be volatile, there must be a diverse, large number ofbuyers and sellers, and the underlying physical products must be fungible, that is, productsare interchangeable for purposes of shipment or storage. All market participants must workwith a common denominator. Each understands that futures prices are quoted for productswith precise specifications delivered to a specified point during a specified period of time.Actually, deliveries of most futures contracts represent only a minuscule share of thetrading volume; less than 1% in the case of energy. Precisely because the Exchange’sphysical commodity contracts allow actual delivery, they ensure that any market participantwho desires will be able to transfer physical supply, and that the futures prices will be trulyrepresentative of cash market values.Most market participants choose to buy or sell their physical supplies through existingchannels, using futures or options to manage price risk and liquidating their positions beforedelivery.Why Use New York Mercantile Exchange Contracts? The contracts are standardized, accepted, and therefore liquidfinancial instruments. 6The Exchange offers cost-efficient trading and risk management opportunities.
Futures and options contracts are traded competitively on the Exchange inan anonymous auction, representing a confluence of opinions on their values. Exchange futures and options prices are widely and instantaneouslydisseminated. Futures prices serve as world reference prices of actual transactionsbetween market participants. The Exchange’s markets allow hedgers and investors to trade anonymouslythrough futures brokers, who act as independent agents for traders. The liquidity of the market allows futures contracts to be easily liquidated priorto required receipt or delivery of the underlying commodity. While futures contracts are seldom used for delivery, if delivery is required,financial performance is guaranteed, as it is for options that are exercised. Unlike principalto-principal transactions which must be continually examined for unexpected financial performance, counterparty credit risk is absent from transactions executed on the Exchange. Futures and options contract performance is supported by a strong financialsystem, backed by the Exchange’s clearing members, including some of the strongestnames in the brokerage and banking industries. The Exchange offers safe, fair, and orderly markets protected by its rigorousfinancial standards and surveillance procedures.Commercial Applications of the Exchange’sEnergy Futures and Options ContractsThe Exchange provides buyers and sellers with price insurance and arbitrage opportunities that can be integrated into cash market operations.Trading Exchange contracts can improve the credit worthiness and add to the borrowing capacity of natural resource companies, thus augmenting the companies’ financialmanagement and performance capabilities.Cash vs. Futures Price RelationshipsCash prices are the prices for which the commodity is sold at the various market locations. The futures price represents the current market opinion of what the commodity will77
be worth at some time in the future. Under normal circumstances of adequate supply, theprice of the physical commodity for future delivery will be approximately equal to the present cash price, plus the amount it costs to carry or store the commodity from the presentto the month of delivery. These costs, known as carrying charges, determine the normalpremium of futures over cash.As a result, one would ordinarily expect to see an upward trend to the prices of distantcontract months. Such a market condition is known as contango and is typical of manyfutures markets. In most physical markets, the crucial determinant of the price differentialbetween two contract months is the cost of storing the commodity over that particularlength of time. As a result, markets which compensate an individual fully for carry charges –interest rates, insurance, and storage – are known as full contango markets, or full carryingcharge markets.Under normal market conditions, when supplies are adequate, the price of a commodity for future delivery should be equal to the present spot price plus carrying charges. Thecontango structure of the futures market is kept intact by the ability of dealers and financialinstitutions to bring carrying charges back into line through arbitrage.Futures markets are typically contango markets, although seasonal factors in energymarkets play an important role in market relationships. For example, during the summer,heating oil futures are often in contango as the industry begins to build inventory for theapproaching cold weather. On any given day, prices in the forward contract months areprogressively higher through the fall, reflecting the costs of storage, interest rates, and theassumption of increased demand.The opposite of contango is backwardation, a market condition where the nearbymonth trades at a higher price relative to the outer months. Such a price relationship usuallyindicates a tightness of supply; a market can also be in backwardation when seasonal factors predominate.ConvergenceAs a futures contract approaches its last day of trading, there is little differencebetween it and the cash price. The futures and cash prices will get closer and closer, aprocess known as convergence, as any premium the futures have had disappears overtime. A futures contract nearing expiration becomes, in effect, a spot contract.8
PRINCIPLES OF HEDGINGAND PRICE DISCOVERYFutures contracts have been used to manage cash market price risk for more than acentury in the United States. Hedging allows a market participant to lock in prices and margins in advance and reduces the potential for unanticipated loss.Hedging reduces exposure to price risk by shifting that risk to those with opposite riskprofiles or to investors who are willing to accept the risk in exchange for profit opportunity.Hedging with futures eliminates the risk of fluctuating prices, but also means limiting theopportunity for future profits should prices move favorably.A hedge involves establishing a position in the futures or options market that is equaland opposite to a position at risk in the physical market. For instance, a crude oil producerwho holds (is “long”) 1,000 barrels of crude can hedge by selling (going “short”) one crudeoil futures contract. The principle behind establishing equal and opposite positions in thecash and futures or options markets is that a loss in one market should be offset by a gainin the other market.Hedges work because cash prices and futures prices tend to move in tandem, converging as each delivery month contract reaches expiration. Even though the difference betweenthe cash and futures prices may widen or narrow as cash and futures prices fluctuate independently, the risk of an adverse change in this relationship (known as basis risk) is generally much less than the risk of going unhedged, and the larger a group of participants in themarket, the greater the likelihood that the futures price will reflect widely held industry consensus on the value of the commodity.Because futures are traded on exchanges that are anonymous public auctions withprices displayed for all to see, the markets perform the important function of price discovery. The prices displayed on the trading floor of the Exchange, and disseminated to information vendors and news services worldwide, reflect the marketplace’s collective valuation ofwhat buyers are willing to pay and what sellers are willing to accept.The purpose of a hedge is to avoid the risk of adverse market moves resulting in majorlosses. Because the cash and futures markets do not have a perfect relationship, there is nosuch thing as a perfect hedge, so there will almost always be some profit or loss. However,an imperfect hedge can be a much better alternative than no hedge at all in a potentiallyvolatile market.9
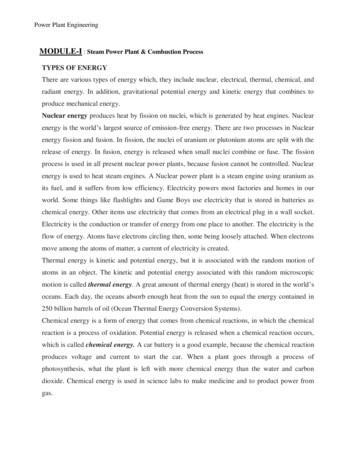
Short HedgesOne of the most common commercial applications of futures is the short hedge, orseller’s hedge, which is used for the protection of inventory value. Once title to a shipmentof a commodity is taken anywhere along the supply chain, from wellhead, barge, or refineryto consumer, its value is subject to price risk until it is sold or used. Because the value of acommodity in storage or transit is known, a short hedge can be used to essentially lock inthe inventory value.A general decline in prices generates profits in the futures market, which are offset by adecline in the value of the physical inventory. The opposite applies when prices rise.Example 1 – Crude Oil Producer’s Short HedgeA crude oil producer agrees to sell 30,000 barrels a month for each of six months at theposted prices prevailing at delivery. When he agrees to the deal, posted prices are 20.50 abarrel, but as market conditions appear to be weakening, he wants to protect his revenuesagainst a decline, and executes a short hedge. The example shows how the producer’s revenue is protected from the full brunt of a declining market.In this example, the oil producer establishes hedges for the second, third, fourth, fifth,sixth, and seventh contract months against his production during the first, second, third,fourth, fifth, and sixth months ahead. Near-month futures positions are liquidated after aprice posting is established (normally on the first day of the calendar month).In a surplus crude market, spot prices generally fall faster than postings, regardless ofwhether prices decline more slowly, as in Case 1, or more rapidly, as in Case 2.10
DateCashMarketFuturesMarketDec. 1Commits to sell 30,000barrels in each monthfor January, February,March, April, May, Junecrude at the posted priceSells 30 crude contractsin each month for:February, 20.00; March, 19.75;April, 19.50; May, 19.50;June 19.25; July, 19.00FuturesResults /bbl.Net PriceReceived, /bbl.Case 1: Slowly Declining PricesJan. 1Posted price for Januarycrude: 21.00/bbl.Buys back February contractsat 20.50( 0.50)Feb. 1Posted price for Februarycrude: 20.50/bbl.Buys back March contractsat 19.75Mar. 1Posted price for Marchcrude: 20.00/bbl.Buys back April contractsat 19.00 0.50 20.50Apr. 1Posted price for Aprilcrude: 19.50/bbl.Buys back May contractsat 18.50 1.00 20.50May 1Posted price for Maycrude: 19.50/bbl.Buys back June contractsat 18.75 0.50 20.00Jun. 1Posted price for Junecrude: 20.00/bbl.Buys back July contractsat 19.50( 0.50) 19.500 20.50 20.50Case 2: Rapidly Declining PricesJan. 1Posted price for Januarycrude: 20.00/bbl.Buys back February contractsat 19.50 0.50 20.50Feb. 1Posted price for Februarycrude: 19.50/bbl.Buys back March contractsat 18.75 1.00 20.50Mar. 1Posted price for Marchcrude: 19.00/bbl.Buys back April contractsat 18.00 1.50 20.50Apr. 1Posted price for Aprilcrude: 18.50/bbl.Buys back May contractsat 17.50 2.00 20.50May 1Posted price for Maycrude: 18.50/bbl.Buys back June contractsat 17.75 1.50 20.00Jun. 1Posted price for Junecrude: 19.00/bbl.Buys back July contractsat 18.50 0.50 19.5011
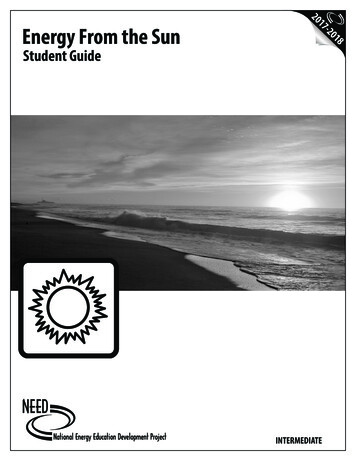
Selling Prices ( /bbl.)UnhedgedMonthHedgedCase 1Case 2January 20.50 21.00 20.00February 20.50 20.50 19.50March 20.50 20.00 19.00April 20.50 19.50 18.50May 20.00 19.50 18.50June 19.50 20.00 19.00Average 20.25 20.08 19.08Increased cash flowCase 1 20.25 - 20.08 0.17 x 180,000 barrels 30,600Case 2 20.25 - 19.08 1.17 x 180,000 barrels 210,600If the producer could not lock in revenue, he could be faced with shutting in all or partof the production.The example shows two possible outcomes. Case 1, with relatively high posted andfutures prices, and Case 2, with relatively low posted and futures prices. Short hedges forFebruary, March, April, May, June, and July (against January, February, March, April, May,and June production) are initially established on December 1.Assuming the futures hedge is placed on December 1, the near-month contract isJanuary and the second month out is February. Because the January crude futures contractexpires three business days prior to December 24, and the posted prices for January arenot finally established until January 2, the example attempts to have the liquidation of thefutures coincide with the setting of the posted price.In summary, the nearby contract is used to hedge current production. For example,the February futures contract is utilized to hedge January production because the timing isbetter matched.12
Example 2 – Electricity Producer Fears a Price DeclineIn this example, an independent power production company is at risk that falling priceswill reduce profitability. It stabilizes cash flow by instituting a managed short hedging strategy on the electricity futures market.On February 1, the bulk power sales manager at a southeastern utility projects that hewill have excess generation for the second quarter and notices attractive prices in thefutures market for the April, May, and June contracts. The manager arranges to deliver thisexcess power at the prevailing market price in April, May, and June. However, he wants tocapture the market prices now, rather than be exposed to the risk of lower prices in the spotmarkets. The action the utility takes to protect the company from this risk is to sell Entergyelectricity futures contracts for those months.In the futures market, the producer sells 10 futures contracts for each of three months,April, May, and June at 23 per megawatthour (Mwh), 23.50, and 24, respectively.Assuming a perfect hedge, the futures sales realize 169,280 for the April contracts (10 contracts x 736 Mwh per contract x 23 per Mwh 169,280), 172,960 for May contracts (10x 736 x 23.50); and 176,640 for June contracts (10 x 736 x 24), for a total of 518,880.On March 29, the utility arranges to deliver 7,360 Mwh of April pre-scheduled power inthe cash market, the equivalent of 10 contracts, at the current price which has fallen to 22per Mwh, and receives 161,920. That is 7,360 less than budgeted when prices wereanticipated at 23 per Mwh.Simultaneously, the producer buys back the April futures contracts to offset the obligations in the futures market. This also relieves it of the delivery obligation through theExchange. The April contracts, originally sold for 23 ( 169,280), are now valued at 22 perMwh, or 161,920. This yields a gain in the futures market of 7,360. Therefore:The cash market sale of: 161,920 (7,360 x 22/Mwh) plusA futures gain of: 7,360 equalsA net amount of: 169,280, or 23 per Mwh, the budgeted sum for April.13
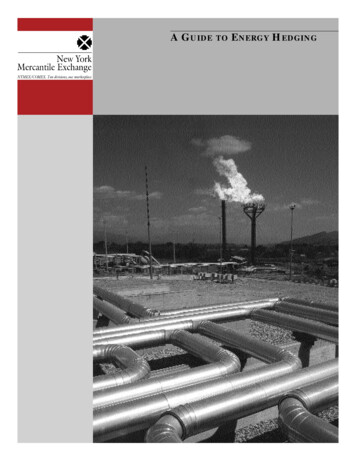
As cash prices continue to be soft for the second quarter, the hedge looks like this:Cash MarketFutures MarketFeb. 1Sells 10 Entergy electricity contractsin each of April, May, June for 23, 23.50, 24, respectivelyMar. 27Sells 7,360 Mwh at 22Buys back 10 April contracts, 22Apr. 26Sells 7,360 Mwh at 23Buys back 10 May contracts, 23May 26Sells 7,360 Mwh at 23.25Buys back 10 June at 23Financial ResultAprilMayJuneQuarterExpected Revenue 169,280 172,960 176,640 518,880Cash Market Sales Rev 161,920 169,280 171,120 502,320Futures Mkt Gain (Loss) 7,360 3,680 5,520 16,560 169,280 172,960 176,640 518,880Actual Revenue 23.50 per MwhWhat happens to the power production company’s hedge if prices rise instead of fall?In that case, assume the cash market rises to 24, 24.50, and 25. The power producer realizes 176,640 on the cash sale of 7,360 Mwh for April, but sold futures at 23 inFebruary, and now must buy them back at the higher price, 24, if it does not want to standfor delivery through the Exchange.The 10 contracts are valued at 176,640 which is what the company must pay to buythem back, incurring a 7,360 loss on the futures transaction. Therefore:14The cash market sale of: 176,640 (7,360 x 24/Mwh) minusA futures loss of: 7,360 equalsA net amount of: 169,280, or 23 per Mwh, the budgeted sum for April.
As cash prices continue to be firm for the second quarter, the hedge looks like this:Cash MarketFutures MarketFeb. 1Sells 10 Entergy electricity contracts ineach of April, May, June for 23, 23.50, 24, respectivelyMar. 27Sells 7,360 Mwh at 24Buys back 10 April contracts, 24Apr. 26Sells 7,360 Mwh at 24.50Buys back 10 May contracts, 24.50May 26Sells 7,360 Mwh at 25Buys back 10 June at 25Financial ResultAprilMayJuneQuarterExpected Revenue 169,280 172,960 176,640 518,880Cash Market Sales Rev 176,640 180,320 184,000 540,960( 7,360)( 7,360)( 7,360)( 22,080) 169,280 172,960 176,640 518,880Futures Mkt. Gain (Loss)Actual Revenue 23.50 per MwhThe average price of 23.50 per Mwh represents an opportunity cost of 1 per Mwhbecause cash market prices averaged 24.50 during the period of the hedge. The produceris comfortable with this because it is within the tolerance for risk that the risk managementcommittee set at the time the positions were opened. Managing a hedge strategy is anevolving process. While hedges serve to stabilize prices, risk management targets can bereevaluated in future periods as market and financial circumstances change.Long HedgesA long hedge is the purchase of a futures contract by someone who has a commitmentto buy (is short) in the cash market. It is used to protect against price increases in the future.An end-user with a fixed budget, such as a manufacturing company that uses naturalgas, can use a long hedge to establish a fixed cost.Sometimes the risk of an adverse change in the difference between cash and futuresprices, also known as basis risk, can be an important consideration for hedgers of refinedpetroleum products.15
A fuel marketer may offer customers fixed-price contracts for a number of reasons: toavoid the loss of market share to other marketers or alternative fuels, to expand marketshare; or to bid on municipal contracts requiring a fixed price.However, by offering to sell at a fixed price over a period of time, the marketer isexposed to the risk that wholesale costs will increase, perhaps to the point of unprofitability(Case 1).Thus, to fix his future acquisition costs, the marketer might implement a long hedgeagainst a forward sales commitment. If his wholesale buying prices increase, profits on thefutures market will offset the price increase in the cash market, keeping his retail marginconstant.Similarly, if wholesale costs decrease, the lower acquisition costs will be offset by aloss on the futures (Case 2).Example 3 – Petroleum Marketer’s Long Hedge,Rising and Falling MarketsOn September 7, the New York Harbor price for heating oil is 55 and the cash marketprice at the fuel dealer’s location is 54 a gallon, a 1 differential, or basis, between NewYork Harbor and the retailer’s location.The dealer agrees to deliver 168,000 gallons to a commercial customer in Decemberat 70 per gallon. On September 7, he buys four December heating oil contracts (42,000gallons each) at 57 , the price quoted that day on the Exchange’s NYMEX Division. Totalcost: 95,760 (42,000 x 4 x 0.57).Case 1 – Rising PricesOn November 25, the fuel dealer buys 168,000 gallons in the cash market at the prevailing price of 59 a gallon, a 1 differential to the New York Harbor cash quotation of 60 ,Cost: 99,120.He sells his four December futures contracts (initially purchased for 57 ) at 60 a gallon, the current price on the Exchange, realizing 100,800 on the sale, for a futures marketprofit of 5,040 (3 a gallon).His cash margin is 11 (the difference between his agreed-upon sales price of 70 andhis cash market acquisition cost of 59 for a total of 18,480 ( 0.11 per gallon x 168,000gallons).16
Cash MarketSept. 7Nov. 25Futures MarketBuys four December futures contractsfor 57 per gallonBuys 168,000 gallonsat 59 per gallonA cash margin of: 18,480 or 11 /gallon plusA futures profit of: 5,040 or 3 /gallon equalsA total margin of: 23,520 or 14 /gallonSells
The Exchange’s electronic trading system, NYMEX ACCESS , allows trading in energy futures and options, platinum futures and options, and other metals futures after the trading floor has closed for the day. The NYMEX ACCESS trading session for light, sweet crude oil; heating oil; New Yo