Transcription
1Hazard Identification and Risk AssessmentRoad Safety At Work website contentd SafetyAt Workwebsite contentInorder foran organizationto take well-targeted actions thatprevent motor vehicle incidents (MVI) and safeguardemployees, it must first understand how employees can gethurt while driving for work. Identifying the hazards theyencounter, understanding the factors that contribute tocrashes and evaluating the associated risks are key steps in aneffective road safety program.OverviewThis section explains hazard identification and risk assessment processes from a road safety perspective.It provides tools that will help you identify and categorize the hazards your drivers encounter,systematically evaluate the risks and establish priorities to control those risks. There are four parts.1.The Basics – definitions and explanations of terms2.Hazard Identification – steps to systematically identify hazards, linked to a hazard inventory andclassification tool3.Risk Assessment – two methods for assessing MVI risks plus examples that demonstrate both4.a)Method One: A Simple Risk Matrixb)Method Two: The Quantified Risk ScaleResources – tools you can use to identify hazards and assess risks, and templates you can modifyto fit your organizationThe information contained in this document is for educational purposes only. It is not intended to provide legal or other advice to you,and you should not rely upon the information to provide any such advice. We believe the information provided is accurate and complete;however, we do not provide any warranty, express or implied, of its accuracy or completeness. Neither WorkSafeBC, nor the JusticeInstitute of British Columbia nor Road Safety at Work shall be liable in any manner or to any extent for any direct, indirect, special,incidental or consequential damages, losses or expenses arising out of the use of this form. February 2016
2The BasicsUnderstanding key terms will help you apply processes and tools in this section.A hazard is a thing or condition that can expose a person to risk of injury or occupational disease. It’sany potential source of harm, damage or adverse health effects. However, MVIs have sweepingconsequences beyond personal injury. For road safety purposes, we also need to think of hazards interms of exposing people and organizations to other significant losses – property damage, businessinterruption and reputation damage, and environmental harm.Our approach to driving-related hazardsUsing a somewhat narrow traditional approach, the primary hazard or source of harm that we seek toeliminate, is the motor vehicle incident. Certainly, there are driving-related hazards that do not involve acrash. Improper seating positions that cause musculo-skeletal injuries, the mental toll of intenselychallenging road conditions, physical violence by a passenger, or being stranded by a vehicle breakdown in extreme weather are a few. These are surely hazards to address. However, the greatest singlesource of harm associated with driving is the energy unleashed during a crash.Unfortunately, applying a traditional understanding of hazard does not work very well for motor vehicleincidents. It is difficult to complete a meaningful risk assessment of a singular, yet vastly complex,hazard such as a crash. To get risk assessment results that you can readily use to build your action plan,you need to dig a little deeper and look closely at the things, conditions, circumstances, actions andinactions – the factors - that can cause or contribute to a crash.Therefore, our approach to driving-related hazards includes conditions and circumstances that atraditional approach would classify as contributing factors or risk factors.Types of driving-related hazards include:1.Physical objects - a sharp rock, wildlife, worn tire or faulty brake substances - carbon monoxide, drugs, alcohol, fuel and hazardous fluids in or on a vehicle materials - gravel road surface, ice temperature – extreme weather temperatures, contacting a hot surface2.Energy kinetic - an oncoming vehicle, the speed of the vehicle you are in gravity - car falling off jack during tire change electrical – shock from an incorrect jumper cable connection noise - prolonged exposure to a loud exhaust system pressure - compressed air or hydraulic fluidThe information contained in this document is for educational purposes only. It is not intended to provide legal or other advice to you,and you should not rely upon the information to provide any such advice. We believe the information provided is accurate and complete;however, we do not provide any warranty, express or implied, of its accuracy or completeness. Neither WorkSafeBC, nor the JusticeInstitute of British Columbia nor Road Safety at Work shall be liable in any manner or to any extent for any direct, indirect, special,incidental or consequential damages, losses or expenses arising out of the use of this form. February 2016
33.Conditions, processes and practices conditions – fatigued driver, poor traction, insufficient lighting or visibility, stressful drivingcircumstances such as heavy traffic or aggressive drivers, processes - insufficient driver training, lack of vehicle inspections or maintenance practices – overloading vehicle; high-risk driving behaviours such as speeding, following tooclose or texting while driving; poor ergonomics such as improperly adjusted seat.Risk is the possibility or potential for loss. Losses incurred by MVIs can include physical andpsychological injuries to workers and others, costs of repairing or replacing damaged property, andimpacts to business processes (e.g. lost productivity, reputation) and the environment. Three factorsdetermine how much risk is associated with a given hazard: Frequency of Exposure – how often and for how long workers are exposed to the hazard. Probability of Occurrence – the likelihood that a MVI or other incident will occur. Severity of Consequences - the magnitude of loss, negative consequences or impacts.The following formula explains risk.Risk Exposure x Probability x SeverityTip: In the risk equation, implementing measures that make any one of the variables zero also makesthe risk zero. For example, if no worker is exposed to a hazard, exposure equals zero and risk is zero.Find other helpful terms and definitions in our Glossary.The information contained in this document is for educational purposes only. It is not intended to provide legal or other advice to you,and you should not rely upon the information to provide any such advice. We believe the information provided is accurate and complete;however, we do not provide any warranty, express or implied, of its accuracy or completeness. Neither WorkSafeBC, nor the JusticeInstitute of British Columbia nor Road Safety at Work shall be liable in any manner or to any extent for any direct, indirect, special,incidental or consequential damages, losses or expenses arising out of the use of this form. February 2016
4Hazard IdentificationHazard identification involves looking for things, conditions and practices in your employees’ drivingenvironments that have potential to cause or contribute to a crash, and identifying the people who maybe exposed to those hazards.Hints for Identifying HazardsIf you are not familiar with all the hazards your drivers face, try the following.1.Speak with the drivers. What practices, locations or situations do they consider “dangerous”?2.Go for a ride-along. Experience the conditions and circumstances your drivers encounter.3.Check vehicle inspection reports. What mechanical issues do you see or hear about?4.Review near-miss reports and incident investigations. What caused or contributed to those events?5.Check a vehicle owner’s manual. Review the operating instructions and watch for “Caution” labelsand “Hazard” symbols.6.Think about non-routine and high-risk driving circumstances. What dangers are there?7.Talk with other employers. What are their biggest road safety challenges?8.Who could be harmed? Usually, we think about injuries to the driver. Who else could be harmed –their passenger(s), other motorists, pedestrians or cyclists?Tip: Effective hazard identification is a team effort. Involve your employees – supervisors, managersand especially the employees that drive for work. They know the hazards they face, and which onesare of greatest concern. They also have good ideas on how to manage the risks.Use a Systematic ApproachDriving is complex. Drivers operate vehicles in a wide range of circumstances and conditions.Environments change, so do the drivers, vehicles and hazards. Use a step-by-step approach to identifyand keep track of hazards.Tip: It’s effective to identify and organize hazards in terms of the driver, the vehicle and the journey.The Road Hazard InventoryYour organization might already have an effective method to identify and classify workplace hazards. Ifyou do, apply it to road safety. If not, have a look at the Road Hazard Inventory. This worksheet listsmany of the road safety hazards and categorizes them by driver, vehicle and journey.To build your own Road Hazard Inventory, select the hazards that apply to your workplaces and drivers.Modify descriptions so they accurately reflect hazards in the driving environments your employeesencounter. Add hazards or factors that aren’t there. Rather than deleting hazards that don’t apply,simply strike through them. Even though that hazard may not currently be present in your workplace, itmight be the next time you review your hazard inventory.The information contained in this document is for educational purposes only. It is not intended to provide legal or other advice to you,and you should not rely upon the information to provide any such advice. We believe the information provided is accurate and complete;however, we do not provide any warranty, express or implied, of its accuracy or completeness. Neither WorkSafeBC, nor the JusticeInstitute of British Columbia nor Road Safety at Work shall be liable in any manner or to any extent for any direct, indirect, special,incidental or consequential damages, losses or expenses arising out of the use of this form. February 2016
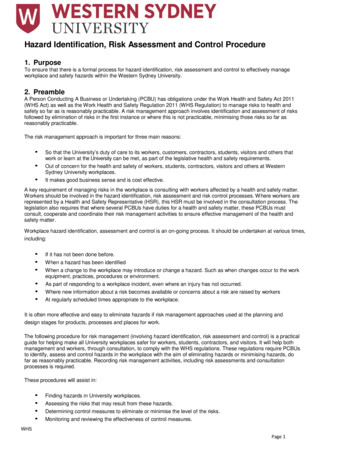
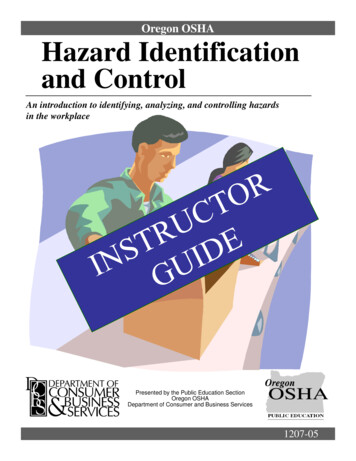
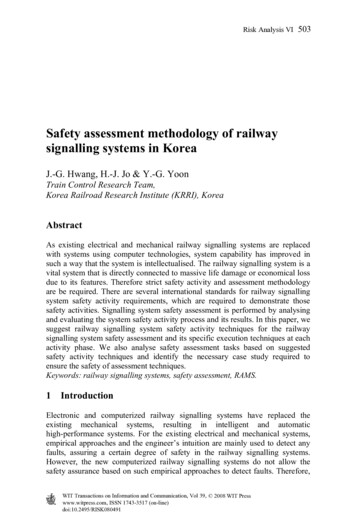
5Risk AssessmentOnce you have an inventory of driving-related hazards, the next step is a risk assessment in which youestimate or calculate how much risk each hazard presents. There are two common approaches.Qualitative methods classify risks based on descriptions of frequency and severity criteria. Qualitativemethods are subjective and usually assign relative risk rankings such as low, medium, high or extreme.Quantitative methods are objective and place greater reliance on numerical data and statistics orrecords to “score” frequency of exposure, probability of occurrence and severity of impacts andcalculate individual risk scores.Risk assessments using either method should take full advantage of relevant direct observations andrecords – how often certain types of crashes have occurred, how frequently specific hazards havecontributed to crashes, which vehicle types, which drivers, which locations, as well as the nature andmagnitude of consequences. However, because risk assessments are forward-looking proceduresseeking to anticipate risks and prevent MVIs, many organizations don’t have enough data to use purelyquantitative methods to assess road safety risks.Even when your risk assessment incorporates industry data or incident information from employersengaged in the same type of work, it can be difficult to gather reliable, representative numbers for eachhazard. Usually, evaluating road safety risks requires that assessors also apply their qualified estimate orinformed best guess in a combination of qualitative and quantitative methods.Sections below demonstrate two such hybrid methods. Simple Risk Matrix is a 3 x 3 matrix that uses qualitative descriptions and comparative rangesof values to rank risks as high, medium or low. Quantified Risk Scale has three risk variables and applies more precise qualitative criteria aswell as specific values to calculate individual risk scores.Method One: Simple Risk MatrixThe simple risk matrix in Table One relies on probability and severity scores of high, medium or low toassign relative risk rankings. The color-coding in the matrix provides you with a visual sense of therelative priority attached to that hazard.Table Two provides comparative criteria or descriptors to help determine the probability and severityassociated with each hazard. The outputs of Table Two are the inputs for Table One.The information contained in this document is for educational purposes only. It is not intended to provide legal or other advice to you,and you should not rely upon the information to provide any such advice. We believe the information provided is accurate and complete;however, we do not provide any warranty, express or implied, of its accuracy or completeness. Neither WorkSafeBC, nor the JusticeInstitute of British Columbia nor Road Safety at Work shall be liable in any manner or to any extent for any direct, indirect, special,incidental or consequential damages, losses or expenses arising out of the use of this form. February 2016
6Table One: Simple Risk MatrixHIGHSeverity MEDIUMLOWLOWMEDIUMHIGHProbabilityTable Two: Simple Risk Matrix Assessment DescriptorsRatingHighMediumLowProbabilitySeverity Frequent or repeated event Occurs at least once a year in theorganizationSerious or disabling personal injury,permanent disability or fatality Costs to repair / replace propertydamage greater than 100,000 Loss of business function forextended period, substantialconsequences for business Injury requiring medical aid with orwithout lost time from work Costs to repair / replace propertydamage 25,000 - 100,000 Loss of business function for shortperiod, modest consequences forbusiness Occurs several times during a project Occurs often in similar circumstances (e.g. inanother company that does work similar toyours) Greater than 50% chance of occurring Event is known to occur, but not frequently Occurs less than once a year in organization Has occurred in similar circumstances (e.g.in another company that does work similarto yours ) 10% to 50% chance of occurring Unlikely event, has not occurred in yourcompany but could happen No injury or minor injury requiringfirst aid May happen once in 10 years Has never been observed, but possibleCosts to repair / replace propertydamage less than 25,000 Less than 10% chance of occurring Minor business interruptionThe information contained in this document is for educational purposes only. It is not intended to provide legal or other advice to you,and you should not rely upon the information to provide any such advice. We believe the information provided is accurate and complete;however, we do not provide any warranty, express or implied, of its accuracy or completeness. Neither WorkSafeBC, nor the JusticeInstitute of British Columbia nor Road Safety at Work shall be liable in any manner or to any extent for any direct, indirect, special,incidental or consequential damages, losses or expenses arising out of the use of this form. February 2016
7Using the Simple Risk MatrixAdapt Risk Assessment Criteria to Your OrganizationTable Two (above) provides several descriptors with reasonable thresholds designed to yieldappropriate probability and severity ratings for driving-related hazards in many workplacecircumstances. However, you should review each descriptor, consider your company’s businessprocesses, values and risk tolerances, and revise the descriptors to fit your needs.For example, for some larger employers, property damage costs of 25,000 have small impacts to theirbottom line, and such a loss is properly scored as having low severity. For other organizations, 25,000property damage costs can have a significant impact on their viability, and would therefore havemedium or high severity. For some businesses, (such as self-employed contractors), even a short-termbusiness interruption can have disastrous consequences, so would be scored as having high severity.You may want to add environmental impacts (e.g., fuel spill, toxic release) or other consequences thatcould be associated with a crash, and are important for your organization.Assign Scores for Probability and SeverityOnce you have made those adjustments to the descriptors, the next step is to assign a probability scoreand a severity score to each of the hazards you want to assess (e.g. from the Road Hazard Inventory).When scoring each hazard, keep the following questions in mind.Probability – Collectively, how often are our employees exposed to this hazard? In our organization, orin other organizations like ours, how often does this occur? How likely is this to occur?Severity – If this hazard causes a crash or other incident, what are the most likely outcomes? How muchwill it cost? How severe are the injuries and other losses likely to be? How will that impact our business?Applying the Simple Risk MatrixExample OneIn the last two years, ABC Health Services has experienced two near crashes because their driver isdistracted by a passenger or client. Based on what “just about” happened, ABC thinks such a crashwould probably result in injuries to the driver and client (and perhaps an occupant of another vehicle)and it would cost about 50,000 to repair damaged vehicles. The ABC health and safety committeeassign a medium severity and high probability to such outcomes, and ranks the priority of managingrisks associated with passengers distracting their drivers as HIGH.Example TwoXYZ Courier Services is working hard to win contracts. Recently, some drivers have adopted the practiceof eating lunch “on the road” thinking it will improve productivity. Others are concerned this added taskreduces their ability to pay attention to traffic, and drive. Yesterday, a driver damaged his van when hebacked into a loading dock while trying to eat a sandwich. Today, XYZ has hired a contractor to fix theirThe information contained in this document is for educational purposes only. It is not intended to provide legal or other advice to you,and you should not rely upon the information to provide any such advice. We believe the information provided is accurate and complete;however, we do not provide any warranty, express or implied, of its accuracy or completeness. Neither WorkSafeBC, nor the JusticeInstitute of British Columbia nor Road Safety at Work shall be liable in any manner or to any extent for any direct, indirect, special,incidental or consequential damages, losses or expenses arising out of the use of this form. February 2016
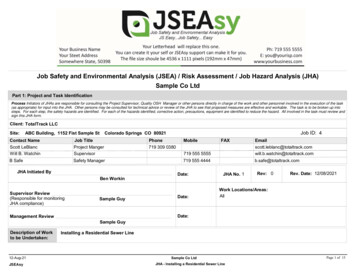
8client’s loading dock, and is trying to repair its damaged business reputation and keep that client. XYZmanagement assigned a high severity and high probability to such outcomes. They have madeeliminating “driving lunches” a HIGH priority.Example ThreeQST Construction is expanding its resource road construction business to highway projects. They areproactive about safety issues, but don’t have experience to know how severe or probable MVIs will be intheir new highway work. They can’t afford a new fleet of pickups, so will have to rely on their “old” fleet.QST is hiring new drivers for the projects. Management is unsure whether they should first pay attentionto vehicle inspection and maintenance procedures, or improve their driver orientation process.QST estimates potential consequences of a crash due to either a mechanical failure or deficient driverorientation are about the same - lost time injuries and repair costs less than 100,000. Over the last 15years, QST has had two vehicle mishaps due to mechanical failure; they estimate the likelihood ofvehicle failure incidents as medium. However, because QST employees and supervisors have very littlehighway construction experience, QST feels the likelihood of a driver-related mishap is greater than thelikelihood of a vehicle-related mishap. They have started building a better driver orientation process.Example FourBelow is a snapshot of how A & R Taxi Ltd used a simple risk matrix to prioritize their action plans.HazardProbabilitySeverityPriorityTaxi won’t startHigh – happens at least once eachdue to mechanical year across fleet(battery) failureLow – minor business delay; cost ofMediumrepair 100Taxi collides withanother vehicle atintersectionHigh – happens at least once peryear across fleetMedium – lost time due to injuries;cost to repair damaged property 45,000HighTaxi backs intopedestrian whileparkingMedium – happened once before High – pedestrian receives seriousto this company; a few occurrences injuries; liability costs greater thanat other taxi companies 100,000HighFor a more extensive example of how to apply the Simple Risk Matrix, download Applying the SimpleRisk Matrix - Top Notch Consultants.To access the working tool, download the Simple Risk Matrix Assessment Tool.The information contained in this document is for educational purposes only. It is not intended to provide legal or other advice to you,and you should not rely upon the information to provide any such advice. We believe the information provided is accurate and complete;however, we do not provide any warranty, express or implied, of its accuracy or completeness. Neither WorkSafeBC, nor the JusticeInstitute of British Columbia nor Road Safety at Work shall be liable in any manner or to any extent for any direct, indirect, special,incidental or consequential damages, losses or expenses arising out of the use of this form. February 2016
9Advantages and Limitations of the Simple Risk MatrixThis section briefly describes some of the advantages and disadvantages of using a simple risk matrix.Reviewing these will help you appreciate some of its strengths and limitations, and see where its usebest fits your organization.Advantages Intuitive – uses the assessor’s perception of organizational driving risks Can get reasonable risk rankings without extensive data or numbers Adaptive – can adjust risk criteria to match company circumstances Two rather than three variables to considerOne advantage of the simple matrix is that it is not necessary to have precise information or data abouteach hazard. Instead, it enables you to do a comparative analysis that, in some applications, can besufficient. For example, you might not know how often a given hazard has contributed to crashes in thelast five years. You might not have accurate reports on the severity of their consequences. As long asyou have an informed sense that hazard A is more likely than hazard B to contribute to a crash, you canassign a greater probability to hazard A. If you know that MVIs that involve hazard A almost always havemore severe consequences than MVIs involving hazard B, you can assign a comparatively greaterseverity ranking to hazard A. Applying those non-precise, qualitative inputs to the risk matrix enablesyou to assign priorities and start on your action plan.Limitations Results are relative and therefore less precise then quantitative methods. When there are several risks to evaluate, all output rankings will fall into three rankings – low,medium and high. Certainly, hazards that get a “high” score are the first priority. However, ifthere are a dozen of more hazards that receive a “high” ranking, it is not obvious which threeare your top priorities. To get reliable rankings from a simple matrix, assessors need a good sense of the frequency withwhich drivers are exposed to each hazard and the associated probable severity. That experienceand knowledge can be difficult to come by.The information contained in this document is for educational purposes only. It is not intended to provide legal or other advice to you,and you should not rely upon the information to provide any such advice. We believe the information provided is accurate and complete;however, we do not provide any warranty, express or implied, of its accuracy or completeness. Neither WorkSafeBC, nor the JusticeInstitute of British Columbia nor Road Safety at Work shall be liable in any manner or to any extent for any direct, indirect, special,incidental or consequential damages, losses or expenses arising out of the use of this form. February 2016
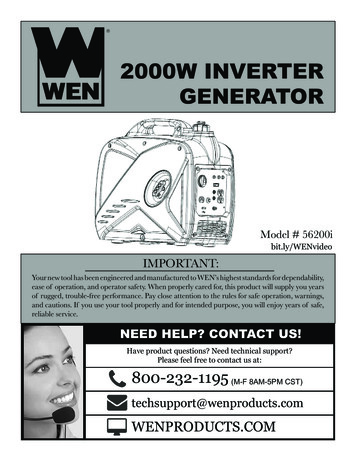
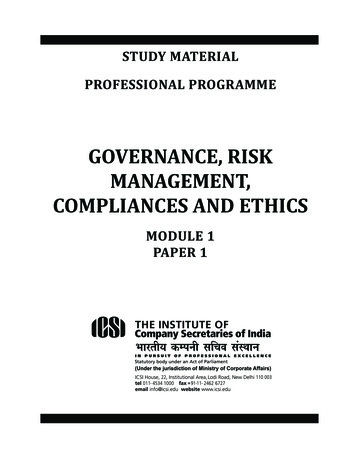
10Method Two: The Quantified Risk ScaleThe Quantified Risk Scale uses three variables and applies more precise qualitative criteria as well asspecific values to calculate individual risk scores. The three risk variables are: frequency of exposure, probability a crash or other loss will occur, and severity of impacts.Table Three shows the scoring criteria used to rate each of the variables associated with a given hazard.Table Three: Quantified Risk Scoring GuideRating1086421Frequency ofExposureProbability of OccurrenceSeverity of ConsequencesContinuous - occursmany times per day.It is almost certain that an incident willoccur and cause the expected results;likelihood greater than 50%Frequent - occursseveral times eachweek, or dailyIt's quite possible or probable theincident will occur; likelihood 10% to50%Common - occursabout once eachmonthIt's a possible occurrence, but it isunusual; 1% to 10% likelihoodOccasional - occurs 3 5 times each yearIt hasn't happened in this organization,but it is remotely possible; likelihoodless than 1%Unusual - occurs oncea yearIt's conceivable but very unlikely; notaware this has ever occurred, but itcould; likelihood 1 in 10,000.Rare - possible, couldoccur once every 10yearsIt's practically impossible; likelihood 1 in 100,000Results in 2 or more fatalities,catastrophic property damage (morethan 1 million) and/or businessterminationResults in single fatality, severeproperty damage (greater than 500,000) and/or lengthy businessinterruptionsResults in serious injury, loss of use oflimb or long-term disability, propertydamage 100,000 to 500,000 and/orbusiness interruptions up to onemonthResults in injuries and short-termdisability, property damage less than 100,000 and/or minor businessdelaysResults in injuries requiring medical aidand incurring lost time, propertydamage less than 25,000 and/orminimal business inconvenienceResults in negligible impacts to wellbeing of any person (employee orexternal), little or no property damageand no impacts on business processesApplying the Quantified Risk Scale ApproachTo help you use the Quantified Risk Scale (QRS) approach, we developed a QRS assessment tool. It hasthree (3) components: a road hazard inventory, the scoring criteria (the Quantified Risk Scoring Guideabove), and the QRS Assessment Tool. The outputs of this method are individual risk scores that enableyou to easily identify the hazards that deserve top priority.The information contained in this document is for educational purposes only. It is not intended to provide legal or other advice to you,and you should not rely upon the information to provide any such advice. We believe the information provided is accurate and complete;however, we do not provide any warranty, express or implied, of its accuracy or completeness. Neither WorkSafeBC, nor the JusticeInstitute of British Columbia nor Road Safety at Work shall be liable in any manner or to any extent for any direct, indirect, special,incidental or consequential damages, losses or expenses arising out of the use of this form. February 2016
11Before seeing how the QRS is applied, it is helpful to re-visit the risk variables and to keep the followingquestions in mind. Frequency of exposure – How many and how often are drivers exposed to this hazard? Doesfrequency of exposure vary widely among drivers? If it does, you will need to group drivers bylevel of exposure and calculate a relative risk for each driver group. Probability of occurrence – If your drivers encounter a given hazard, how likely is it an incidentwill occur? Do you notice that some employees with different types of driving assignments havea greater or lesser probability of being involved in a crash that involves a given hazard? Severity of consequences– If an MVI incident occurs, what do you expect the impact will be?Will someone likely be injured? How severe will the injuries be? How much will it cost to repairor replace damaged property? How will it affect your business?The ABC Trucking Ltd scenario applies the above scoring guide. Using a few of the hazards that ABCTrucking regional delivery drivers face, below is an explanation of why ABC Trucking scores risks the waythey do.Hazard / Contributing FactorFrequency ofExposureProbability ofOccurrenceSeverity ofConsequencesRisk Scoredistraction - texting or talking on cellphone while driving664144distraction - conversation with orinterference by passenger12612distraction - responding todispatcher call, 2-way radio88425628696686288insufficient orientation or training,lacks necessary competencies;inexperienceddoes not recognize driving hazards orhazardous conditions and/or adaptdriving accordinglyCell phone distraction – ABC issues each regional delivery driver a company cell phone for emergencies.ABC has strict procedures prohibiting phone use while driving, but phone records show that each monthat least one of their drivers is on their phone while driving (frequency 6). Although ABC has not yetexperienced a crash due to cell phone distractions, they know other trucking companies have; it is quitepossible ABC will experience such a crash if cell phone use continues (probability 6). They also knowthat when those crashes occur, they typically result in lost time injuries to the driver and repair costs upto 100,000 (severity 4).Passenger distraction – ABC has a clear policy against drivers carrying non-employee passengers(exposure 1). Even if a driver disobeys the policy and carries a passenger, ABC feels it would be veryThe information contained in this document is for educational purposes only. It is not intended to provide legal or other advice to you,and you sho
Once you have an inventory of driving-related hazards, the next step is a risk assessment in which you estimate or calculate how much risk each hazard presents. There are two common approaches. Qualitative methods classify risks based on descriptions of frequency and severity criteria. Qualitative