Transcription
ELECTRIC VEHICLESTECHNOLOGY BRIEFFebruary 2017www.irena.org
Copyright (c) IRENA 2017Unless otherwise stated, material in this brief may be freely used, shared, copied orreproduced, provided that all such material is clearly attributed to IRENA. Material attributedto third parties may be subject to third-party copyright and separate terms of use andrestrictions.ISBN web: ISBN 978-92-95111-00-4ISBN print: ISBN 978-92-9260-000-6Citation:IRENA (2017), Electric Vehicles: technology brief, InternationalRenewable Energy Agency, Abu Dhabi.ABOUT IRENAThe International Renewable Energy Agency (IRENA) is an intergovernmental organisationthat supports countries in their transition to a sustainable energy future, and serves as theprincipal platform for international co-operation, a centre of excellence, and a repositoryof policy, technology, resource and financial knowledge on renewable energy. IRENApromotes the widespread adoption and sustainable use of all forms of renewable energy,including bioenergy, geothermal, hydropower, ocean, solar and wind energy, in the pursuit ofsustainable development, energy access, energy security and low-carbon economic growthand prosperity.ACKNOWLEDGEMENTSThis brief benefited greatly from reviews by Dolf Gielen and Nicholas Wagner (IRENA),Holger Hesse and Peter Keil (Technical University of Munich-ESS) and Bert Witkamp(AVERE),Contributing authors: Lewis M. Fulton (UC Davis), Amr Seleem, Francisco Boshell,Alessandra Salgado and Deger Saygin (IRENA)For further information or to provide feedback: publications@irena.orgDisclaimerThis brief and the material featured herein are provided “as is”. Neither IRENA nor any of its officials,agents, data or other third-party content providers provides any warranty, including as to the accuracy,completeness, or fitness for a particular purpose or use of such material, or regarding the non-infringement of third-party rights, and they accept no responsibility or liability with regard to the use of this briefand the material featured therein.The information contained herein does not necessarily represent the views of the Members of IRENA.The mention of specific companies or certain projects or products does not imply that they are endorsedor recommended by IRENA in preference to others of a similar nature that are not mentioned. The designations employed and the presentation of material herein do not imply the expression of any opinionwhatsoever on the part of IRENA concerning the legal status of any region, country, territory, city or areaor of its authorities, or concerning the delimitation of its frontiers or boundaries.Photographs from IRENA image archive.
ContentsInsights for Policy Makers. 2Highlights.5Technology Status and Performance.8Light duty electric vehicle sales.12Sales of other types of electric vehicles.15Costs, markets and consumers.17Electric Vehicle Charging and Interactions with Electricity Grids. 20Electric vehicles and renewable energy deployment.21The role of demand-side management. 26Smart charging.27Considering the Future: Electric Vehicle Market Projections. 29Projections of batteries and electricity demand.32EVs and VRE: Combining for low environmental impact. 34Material requirements. 38Achieving future EV targets: Technology and policy aspects. 39Bibliography.44
Insights for Policy Makers»» There are two main types of electric »» Despiteon-goingbatteryperformance improvements andvehicles (EV): battery electriccost reductions, EVs still facevehicles (BEV) that use onlypotentially important obstacles.batteries for energy storage andNew models to be introducedmust be plugged in to be recharged,in 2017 and 2018 will be able toand plug-in hybrid electric vehiclesdrive up to 300 kilometres (km)(PHEV) that have both batteries andper recharge, but battery packs upliquid-fuel storage and refuellingto 60 kilowatt-hour (kWh), even ifsystems.battery costs drop from their current»» The global stock of electric vehicleslevels of around USD 350/ kWh to(EVs) reached 1 million during 2015USD 150 kWh in the future, wouldand passed the 2 million mark incost USD 9 000, much more than2016. This rapid rise has been ledthe drive systems of today’s internalby China, the US, Japan and severalcombustion engine vehicles. FuelEuropean countries.savings will help pay this back,»» The uptake of EVs is the result ofespecially for high-mileage drivers.several factors, including strong»» Battery-electric vehicles providetechnological progress, costzero-vehicle-emissions drivingreductions (especially batteries),(for both carbon dioxide (CO2)and policy support, includingand pollutant emissions), butpurchase incentives, drivingthe “upstream” CO2 can beand parking access advantages,substantial, for example inand increased public chargingcountries with dominant coal powerinfrastructure availability.generation. Electric grids must be»» Battery electric vehicles (BEVs)considerably decarbonised (todominated sales over plug-in hybrid600 grams (g)/ kWh or less) for EVselectric vehicles in most countriesto have a CO2 advantage relativeuntil 2014, but plug-in hybridto similar sized hybrid internalelectric vehicle (PHEV) sales havecombustion engine (ICE) vehicles.grown rapidly in the past two yearsCarbon intensities will need toand as of early 2016 were nearlycontinuously improve in the future,equal to BEV sales worldwide.since hybrids and other ICE vehiclesPHEVs have a considerable rangewill also become more efficient. EVsadvantage but sacrifice all-electricalso produce no direct air pollutionand reduce noise pollution in cities.driving to achieve this.2E l e c t ri c Ve h i cle s Technolog y Br ie f
»» For the most benefit, EV deploymentrequires four concurrent strategies:(i) electrification of vehicles;(ii) provision of sufficient chargingequipment; (iii) decarbonisationof the electricity generation; and(iv) integration of electric vehicles»»into the grid.such as time-variable “smartcharging” and vehicle to grid (V2G)electricity supply. Such systems canhelp support a global doubling ofthe share of renewable energy by2030 compared to 2015.The eventual deployment ofcharging schemes such as smartcharging and V2G can supportthe growth of variable renewableenergy and can interplay withinformationcommunicationtechnology (ICT) systems tomaximise the technical featuresand minimise the operation costsusing demand-side managementtools.»» EV deployment growth would allowa higher share of variable renewableenergy (VRE) in the power system,via five areas of interaction:(i) actively using the mobile batterystorage system in the vehicle;(ii) use of second-hand batteriesin a “second life” role as stationarybattery storage systems; (iii) widespread deployment of chargingtechnologies and infrastructure; »» REmap – a global roadmap fromthe International Renewable(iv) evolution in the chargingEnergy Agency (IRENA) to doublebehaviour of EV owners, forrenewables in the energy mix –example, in which they becomeestimates that a 160 million EVscomfortable with variable chargingby 2030 would provide sufficientrates and times; and (v) provisionbattery capacity in major marketsof other ancillary services fromto support VRE at a large scale.EVs to the grid, such as frequencyAchieving this stock level, however,regulation, shaving peak demand,will be challenging and will requirepower support to enhanceoperation, and reserve capacity toannual sales growth rates on thesecure the grid by stored energy inorder of 30-40% between now andits batteries.then. To achieve this will probablyrequire that EV markets achieve»» Electric vehicles create a paradigma “tipping point” between 2020 andshift for both the transport and2025, when they start to rapidlypower sectors, and could supportincrease market share relative tovariable renewable power growththrough different charging schemesICE vehicles.Ele c tr i c Vehicles Technology B rief3
»» To achieve a tipping point in sales, »» Assuming all these new electricEVs will likely need to achieve nearvehicles were to consume 100%parity on a first cost basis withrenewable electricity, aroundICE vehicles, and provide sufficient450 terawatt-hours (TWh) per yearamenities (such as driving rangeof additional renewable electricityand recharging convenience), suchwould be required by 2030. This isthat consumers do not considerequivalent to 1.5% of today’s totalthem inferior to or comparable toglobal electricity generation.ICEs. EVs are already perceived »» Benefits of EVs include zero tailpipeto provide an excellent drivingemissions and therefore less localexperience, and new models beingair pollution and, depending onintroduced during 2017 and 2018the power generation, lower CO2will have much greater drivingemissions. EVs can also reduce noiserange than most of today’s models.pollution in cities. GovernmentsBut strong policies to a) reduce theshould also consider promotingfirst cost of EVs, b) provide driving/electric two-wheelers and electricparking advantages, and c) ensurebuses as a way of reducing pollutionsufficient recharging infrastructure,and noise in populated regionswill likely all be needed for at leastwhere point-to-point charging isfive to ten more years to havepossible.a chance for rapid sales growthand achieving target stock levelsby 2030.4E l e c t ri c Ve h i cle s Technolog y Br ie f
HighlightsTechnology status and performanceTwo main types of electric vehicle(EV) have both achieved significantsales in the world’s major vehiclemarkets in the past year. These are:with 40 kWh of battery capacity mayhave a battery cost of USD 14 000,leading to a vehicle incremental costof at least USD 12 000 compared tosimilar ICE vehicles, depending on(1) battery electric vehicles (BEVs),retail mark-ups, incentives and otherwhich use only batteries for energyfactors.storage and must be plugged in to beFortunately, strong policies and onrecharged, andgoing cost reductions of batteries(2) plug-in hybrid electric vehicleshave helped enable the growth of(PHEVs), which have both batteries EVs. EV sales have grown rapidlyand liquid-fuel storage/refuelling over the past five years, reachingsystems.nearly 500 000 worldwide in 2015,In both cases, the electric motor and nearly 800 000 in 2016, withis very efficient, using 90-95% nearly half of 2016 sales in China.of the input energy to power the EV sales and market share are quitemovement of the vehicle, and offer variable across different countrieszero vehicle emissions driving. But and markets. In 2015, the EV marketthe use of batteries poses the two share was over 20% in Norway,main challenges for battery electric nearly 10% in the Netherlands, andvehicles: their cost and driving range. 3% in California, while under 2% inMost current models of BEV do not all other major markets. Electricstore enough energy to provide trucks and buses are also emerging,“normal” driving range, and are with over 150 000 electric buses inlimited to below 250 km (160 miles) service around the world, mostly inper recharge. However, some new and China. Electric two-wheelers are theforthcoming models offer substantially runaway leaders with over 200 millionmore range, up to 400 km. PHEVs sold through 2015, the vast majorityalready offer 500 km or more due in China. As battery costs continue toto the availability of their liquid- drop, and higher range EVs becomefuelled internal combustion engine. available at a reasonable cost, salesare expected to continue to riseBoth technologies are expensive,rapidly at least through 2020.with battery costs estimated aroundUSD 350/kWh in 2015 and the cost of All modern EVs rely on some type ofa hybrid system of several thousand lithium-ion based battery. Lithium-iondollars in PHEVs. For BEVs, a vehicle batteries offer relatively high energyEle c tr i c Vehicles Technology B rief5
density, high specific energy andgood cycle life. Much progress hasbeen made in the last few years,making lithium-ion batteries morecompact, lighter, more durable (tolast the life of the vehicle) as wellas charge fully in a few minutes.A common target is USD 150/kWhfor full battery packs, a point atwhich the overall costs of an EV maybecome competitive with gasoline ordiesel vehicles (although purchasecosts may remain higher for higherbattery-range EVs).Electric vehicles and renewable energy deployment:Towards a new paradigmElectric vehicles need to be rechargedon a regular basis, and this can occureither at home or at work. It can alsobe done while shopping or duringother types of stops when travelling.A general issue for EVs has been thelong duration needed for charging– typically up to eight hours for afull charge when using slow chargers.Faster charging is desirable thoughnot needed in most situations. Homeslow-charging mostly, but not always,happens at night. This is relevant sinceEVs interact with the grid via chargingand discharging. There are differentmodes of interaction with the grid,the first mode is grid-to-vehicle (G2V)where the vehicle is charged from thegrid, while V2G refers to when vehiclesdischarge power to the grid. The V2Gmode could also be considered as abidirectional charging where EV cancharge from and discharge to the gridat regular intervals. Other chargingmodes such as vehicle-to-building(V2B) and controlled charging arealso available.6E l e c t ri c Ve h i cle s Technolog y Br ie fEVs can be used to enable a highershare of variable renewable energy inthe power system by: (i) actively usingthe mobile battery storage systemin the vehicle in V2G applications,(ii) use of second-hand batteries in a“second life” role as stationary batterystorage systems, (iii) widespreaddeployment of charging technologiesand infrastructure, (iv) evolution inconsumer behaviour of EV owners,and (v) provision of other ancillaryservices from EVs to the grid. Thisoccurs by making use of EV batteries tostore excess electricity and to provideancillary services to the grid, such asfrequency regulation, shaving peakdemand, power support to enhancethe operation, and reserve capacityto secure the grid. One of the mainadvantages of EVs are their high levelof flexibility in charging times whichcan efficiently support operation ofthe grid. According to IRENA’s REmapanalysis, if a target of 160 millionEVs worldwide can be reached by2030, this will provide around8 000 gigawatt‑hours (GWh)/ year
in battery storage that could helpto accommodate higher shares ofvariable renewable energy. This isequivalent to approximately 1 200 GWof battery storage capacity. Alongwith the pumped hydro storage andsecond-hand batteries estimatedunder REmap by 2030, this adds upto a total of 1 650 GW. This compareswith approximately 3 700 GW ofvariable renewable power capacity.The stored battery capacity canprovide additional support torenewable power integration to thegrid among other flexibility measures.The evolution of the combinationof EVs with smart grids is veryimportant as this allows customersto control and make well informeddecisions on their consumptionof electricity, as well as minimisetheir bills. This kind of consumptioncontrol is called demand-sidemanagement (DSM). DSM canhelp customers in optimising theirconsumptions through an intelligentsystem, and can greatly supportcustomers in shifting their loadsduring peak periods.Considering the future: Electric vehicle market projectionsTo achieve the conditions needed forEVs to provide significant benefits toelectric power systems and variablerenewable electricity by 2030, IRENAestimates that 160 million will beneeded worldwide in that year. Inthis brief we articulate this vision byregion, showing one plausible scenariofor how the sales and use of EVsand PHEVs could increase in variousmarkets to achieve such a target. Withan average of 50 kWh battery packper vehicle, 160 million vehicles couldprovide about 8 000 GWh of batterystorage by 2030.Assuming average driving levels pervehicle, the combined electricitydemand from these vehicles couldreach close to 500 TWh per year by2030. Since this battery capacitycould assist in the development ofVRE capacity, we estimate that mostor all of this new demand could beserved by renewable power. However,the scenario will be challenging toachieve: annual EV sales would needto reach 40 million to 50 million by2030, out of an expected overallmarket of 120 million to 130 millionvehicles, in order for stocks to reach160 million.Achieving a 25% or greater marketshare will not be easy and will requirerapid sales increases in all major carmarkets in the next decade, with a“tipping point” in sales probably inthe 2020-2025 time frame. Strongpolicies will be necessary to reachsuch a point, where EVs are costcompetitive and otherwise attractiveto a wide range of consumers inmany countries.Ele c tr i c Vehicles Technology B rief7
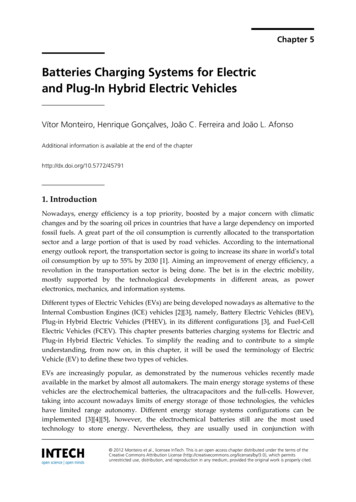
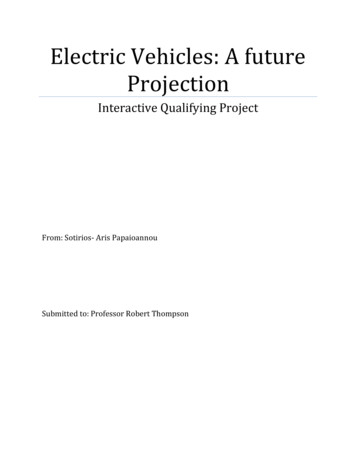
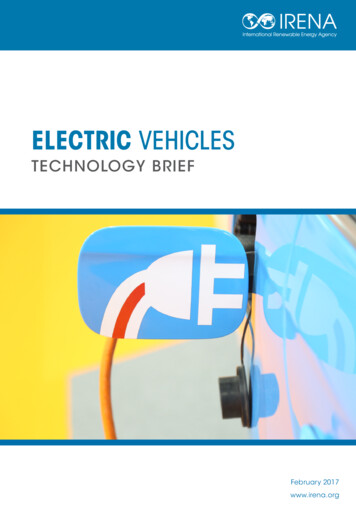
Technology status and performanceThe term “electric vehicle” (EV)typically means a vehicle with anelectric drive (motor) propulsionsystem that can be plugged in torecharge the batteries that provideat least some of the energy storageon the vehicle. There are two maintypes of EV: battery electric vehicles(BEV) that use only batteries forenergy storage and must be pluggedin to be recharged, and plug-inhybrid electric vehicles (PHEV) thathave both batteries and liquid-fuelstorage systems and that can eitherbe plugged in or refuelled with liquidfuel to increase energy stored on thevehicle. Regular (non-plug-in) hybridsalso have an electric drive system, butno plug. They rely on liquid fuel torecharge the batteries on board thevehicle, along with features such asregenerative braking.PHEVs typically are provided witha much smaller battery pack thanBEVs, since they also have an internalcombustion engine operating onliquid fuel. The vehicles may have ashorter driving range on batteries butusually have a longer overall drivingrange due to the liquid fuel – typicallysimilar to conventional vehicles,1238achieving 750 or more kilometres ofrange overall. Current BEVs typicallyhave less than 250 km (160 miles)of all-electric range today. However,some models, such as the TeslaModel S 1 and BYD E6, 2 have morethan a 300 km range. Chevrolet willintroduce the Bolt in late 2016 witha claimed range almost 400 km andpriced around USD 37 000. Otherhigher-range models have beenannounced for 2017. 3Figure 1 shows, for the models ofBEV and PHEV sold in differentcountries during 2015, how muchbattery capacity these vehicles haveand the rated driving range on thesebatteries (a function of the batterystorage but also the efficiency of thevehicle in converting that energy intodriving distance). The PHEVs typicallyhave far lower battery capacity andelectric driving range, though theyalso provide considerable range onliquid fuels. The BEVs typically offermore than 100 km of driving rangeand several offer more than 200 km.As mentioned, in 2015 a few modelsoffered more than 250 km, notablythe BYD E6 and, at over 400 km, theTesla Model S. www.tesla.com/models www.byd.com/la/auto/e6.html www.chevrolet.com/bolt-ev-electric-vehicle.html E l e c t ri c Ve h i cle s Technolog y Br ie f
Battery Driving Range (km)Figure 1: Comparison of battery storage/drivingrangefor1: BEVsand PHEVsFigureComparisonof battery capacity/driving range for BEVs and tery storage (kWh)PHEVSource: UC Davis market dataBEVSource: UC Davis market dataLiquid fuels, primarily gasoline anddiesel from oil, are considered energydense, allowing vehicles to be drivenlong distances before refuelling.Drivers can fill their tanks easily in afew minutes at refuelling stations. Onedrawback with combustion of fuels inengines is that most of this energy iswasted as heat, with typically 20-30%conversion efficiencies (with hybridsat the high end).By contrast, electric motors are veryefficient, using 90-95% of the inputenergy to power the movement of thevehicle. But the challenge with electricvehicles is storing enough energyin batteries to provide adequatedriving range, as well as rechargingthat battery without excessiveinconvenience to drivers. Fortunatelybatteries have been improving andbecoming less expensive over time.Ele c tr i c Vehicles Technology B rief9
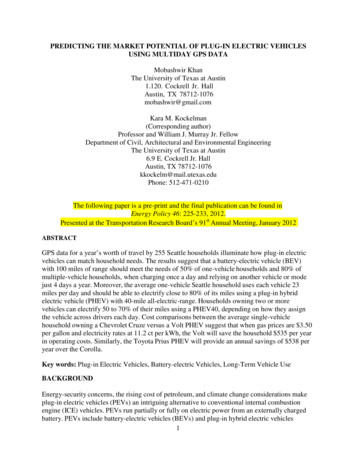
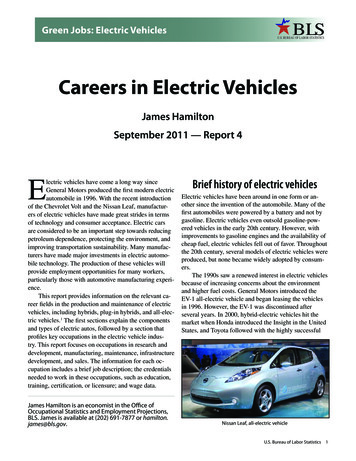
Every design and commercialised EVnow relies on some type of lithium-ionbased battery, a technology whichhas matured over the last 25 years foruse in portable electronics, especiallycell phones and portable computers,replacing all other batteries. Lithiumion batteries offer relatively highenergy density, high specific energyand good cycle life.We are at a new phase in thatmaturation, scaling production,performanceandpackagingof lithium-ion batteries cells insophisticated, managed “packs” forvehicles and other uses, such as largestorage batteries for use with theelectric grid. Much progress has beenmade in the last few years, makingbatteries more compact, lighter, moredurable (to last the life of the vehicle)as well as charge fully in a few minutes.Circling around this is costs, whichare measured per kWh of capacity. Acommon target is USD 150/kWh forfull battery packs, a point at which theoverall (purchase plus energy) costsof an EV can become competitive withICE vehicles. In Figure 2, a multi-sourcestudy by two Swedish researchersshows the progress through 2014 andshow the USD 50/kWh target by 2030.A 2016 report suggests costs couldfall to USD 100/kWh achievable withina decade (Bloomberg New EnergyFinance and McKinsey & Co., 2016).Figure 2: Estimates of costs of lithium-ion batteries for use in electric vehiclesFigure 2: Estimates of costs of lithium-ion batteries for use in electric vehicles2014 USD per kWhEstimates of costs of lithium-ion batteries for use in electric vehicles2 0001 9001 8001 7001 6001 5001 4001 3001 2001 1001 0009008007006005004003002001000200595 % confidence interval, whole industry95 % confidence interval, market leadersPublicationsNews items with expert statements6% declineLog fit of news, reports, and jornals: 12 Additional cost estimates without clear methodMarket leader Nissan Motors, LeafMarket leader Tesla Motors, Model SOther battery electric vehicles8% declineLog fit of market leaders only: 8 6% declineLog fit of all estimates: 14 Future costs estimated in publications 150 per kWh goal for commercialization20102015Björn Nykvist and Måns Nilsson, 2015Source: Nykvist and Nilsson (2015).1 0 E l e c t ri c Ve h i cle s Technolog y Br ie f202020252030
In addition to lithium-ion batteries,there are many other batterychemistries under development,such as lithium-air batteries, that areconsidered highly promising becauseof their potential for delivering higherenergy per unit of mass and volume.Lithium-air batteries have a numberof drawbacks4 such as lower energyefficiency and faster degradationrates. Still, Li-air technology offerskey performance attributes beyondthe technical limits of conventionallithium-ion batteries.MIT researchers developed a newconcept of li-oxygen that could beused as lithium-air batteries, whileovercoming its drawbacks. Forfast-charging lithium-ion batteryproduction, a start-up in Israel hasbeen established. This companyused nanotechnology to create neworganic materials for batteries thatcan recharge in 30 minutes.5 Thesematerials have the potential to increasecharging speed in comparison withconventional lithium-ion batteries.45Apart from the evolution of batteries,scientists and experts have seen ahuge potential for ultracapacitorsas an alternative or supplementaryelectricity storage device thatcould lead to a major change inperformance of EVs. Lithium-ionbatteries convert and store energyby means of a chemical reaction,whereas ultracapacitors store energyby employing an electric field.As a result, while batteries take along time (hours) to discharge,ultracapacitors can quickly discharge(in seconds or minutes) with largebursts of power. Lithium-ion batteriescan typically charge and dischargeup to 10 000 times (cycles) whereasultracapacitors have a cycle life of1 million times. However, ultracapacitorstypically have a low energy densitycompared to lithium-ion batteries, andare more expensive per kW of power.With significant improvements inenergy density, ultracapacitors mightpenetrate the market and help improveEV -car-battery-charges-minutes/Ele c tr i c Vehicles Technology B rief 1 1
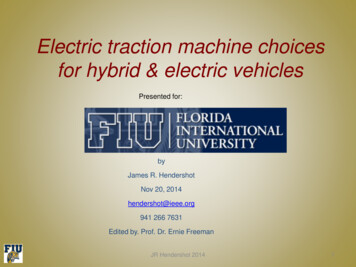
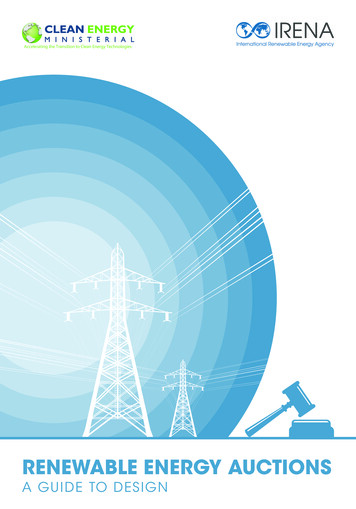
Light duty electric vehicle salesAs shown in Figure 3, PHEV and BEVlight-duty vehicle (LDV) sales havegrown rapidly over the past five years,reaching nearly 500 000 worldwidein 2015 in the world’s eight largestmarkets (China, US, Japan, Germany,France, UK, Norway and theNetherlands), representing more than95% of EV sales worldwide. PHEVsstarted a bit slower than BEVs buttheir share of overall sales has risenand was about 45% (with BEVsrepresenting the remainder 55%) in2015. However, these combined salesrepresent only about 0.5% of thenearly 90 million LDVs sold worldwidein 2015. In 2016, sales are expected tobe close to 1 million EVs, with nearlyhalf the sales coming from China.As shown in Table 1, EV sales andmarket share are quite variable acrossdifferent major car markets, with the2015 market share over 20% in Norway,nearly 10% in the Netherlands, 3% inCalifornia (though less than 1% in theentire US), and less than 2% in othercountries (though with China showingthe highest overall sales and biggestsales increase over the past year ortwo). Worldwide, the close-to-halfmillion sales of EVs in 2015 was about0.5% of the LDVs sold around the world.Figure3: Electricvehiclesalesin world’s8 largestbybytypeFigure3: Electricvehiclesalesin nds400300200100020112012BEV salesSource: UC Davis market data1 2 E l e c t ri c Ve h i cle s Technolog y Br ie f2013PHEV sales20142015
TableTable1: GlobalEV salesby country,8 biggestmarkets1: GlobalEV salesby country,8 biggestmarketsCountry1Est Total PEVs.Feb 2016Est. PEV Sales2015PEVs as % of2015 marketTotal LDV market2015USA 415 000 115 0000.6%17 500 000California 189 000 62 0003.1%2 100 0002 China300 000207 0000.8 %22 000 0003 Japan (est)150 00025 000 1.0 %4 200 0004 Netherlands91 00043 0009.6%420 0005 Norway90 00034 000 20%170 0006 France 70 00027 0001.5%2 000 0007 Germany 50 00024 0000.75%3 500 0008 UK (est) 38 000 28 000 1.0%2 700 0000.5%88 000 000EuropeWorld 193 000 1 100 000 450 000Source: UC Davis market dataLooking to the future, UC Davishas developed a four-generationmodel of passenger car EV technologydevelopmenttocharacterisewhat will likely will occur with ongoing market development, as hasbeen the experience of other newtechnologies such as hybrid vehicles.Figure 4 shows these four generationsof vehicles between 2010 and 2030,with new generations of EV emergingabout every five years. Recent (2016)model introductions such as theupdated Chevrolet Volt and NissanLeaf indicate that EVs are entering thesecond phase.Figure 4: EV rollout scenario2030 TechnologyEle c tr i c toVehiclesB rief 1 3
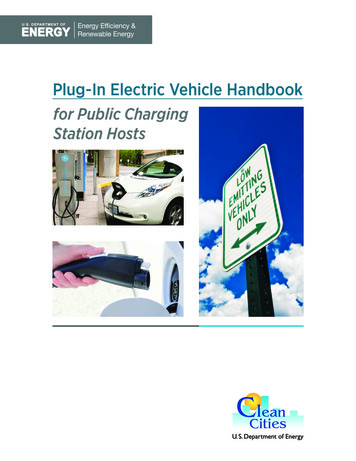
Figure4:4:EVEVrolloutrolloutscenarioto 2030Figurescenarioto 2030A plausible PEV rollout scenario based ontechnology change, incentives and history ofprevious technology rolloutsThis sales curvewould be similar tothe rollout of HEVs inJapan & California,1997 -20153rdgeneration:ndbatteries,2 generationvehicles,improvedcore marketbatteries,1 st generationPEVsmore drivingearly ,2025Adequateinnovatorsinfrastructure& earlyinfrastructure2020Early core201070020020153-5% of market1 - 2%3001504thgeneration:PEVs beginto dominate2030California2025 ZEV goal 15% / 1.5million BEVS,FCV & PHEVsMain market15-25%market:6-15%Lithium pack prices per kWhSource: developed by Tom Turrentine, UC DavisSecond-generation vehicles alreadyon the market around the world showsignificant improvements in rangeand other attributes compared tofirst-generation vehicles (Figure 5).BEVs routinely show range over150 km per full charge, with somemodels (notably the Tesla S andcoming Tesla 3 and Chevrolet Bolt)showing 300-plus kilometres ofrange. On the PHEV side, low-rangemodels such as the original plug-in1 4 E l e c t ri c Ve h i cle s Technolog y Br ie fPrius have given way to models withat least 30 km of battery range andsome (such as the new GM Volt andAmpera models) exceeding 60 km.These higher range PHEVs typicallyare driven far more on electricity thanlower-range models, partly becausebuyers are more interested in electricdriving. These new models also tendto be cheaper than the older firstgeneration models.
FigureSecondgenerationgeneration2015-2020Figure 5:5: SecondEVs,EVs,2020-20152nd Generation PE
that consumers do not consider them inferior to or comparable to ICEs. EVs are already perceived to provide an excellent driving experience, and new models being introduced during 2017 and 2018 will have much greater driving range than most of today's models. But strong policies to a) reduce the first cost of EVs, b) provide driving/