Transcription
Electric Vehicles: A futureProjectionInteractive Qualifying ProjectFrom: Sotirios- Aris PapaioannouSubmitted to: Professor Robert Thompson
ABSTRACTThis study examined necessary steps needed be achieved if all automobiles in California 2040are replaced by electric vehicles (EVs); pure electric vehicles (PEVs) and plug-in hybrid electricvehicles (PHEVs). The analysis was based on a ceteris paribus model where current data andtrends were examined and forecasted for the year of 2040. Results showed that the electricityconsumption of all electric vehicles in 2040 amounts to 80% of the forecasted consumptionstatewide. California may reduce CO2 emissions by 40 million metric tons should this change inits automobile fleet is achieved. Approximately 1.1 million public charging stations must beinstalled to accommodate this change and several power stations must be built to provideadequate electricity for the State’s needs, but specific numbers depend upon several factorselaborated in this analysis.
ACKNOWLEDGEMENTSI would like to express my sincere appreciation and thankfulness to my advisor, Professor RobertThompson, for his guidance and continuous support through the course of this work. His useful,instructive suggestions and guiding reading material not only was essential to the completion ofthis report but had great pedagogic value to me as a person and a future citizen. I would like toparticularly thank him for that.Additionally, I would like to thank Miss Deborah Scott for taking the time to share her usefulpersonal experience with a plug-in hybrid electric vehicle, Miss Liz Tomaszewski who providedknowledge on charging stations and Professor John Orr for providing essential technicalknowledge on electricity generation, transmission and distribution. Last but not least, I wouldlike to thank Mr. John Swanton, spokesman of the California Air Resources Board, whoanalytically answered to clarifying questions regarding the Zero Emission Vehicle Action Plan.
Table of ContentsABSTRACT . iiACKNOWLEDGEMENTS . iiiABSTRACT . ivLIST OF TABLES . vLIST OF FIGURES . viI. INTRODUCTION . 1II. BACKGROUND . 62.1. California relevant statistics . 62.1.1.Transportation statistics . 62.1.2Electricity generation and consumption statistics . 72.1.3Energy statistics . 102.1.3a) Electricity power production mix . 102.1.3b) Power Stations . 122.1.4 Zero-emission goals and plans . 182.2. Electric and plug-in hybrid electric vehicles . 202.2.1 A historical note . 202.2.2 Pure electric vehicle . 222.2.3 Plug-in hybrid electric vehicle . 232.3 Charging stations and methods . 242 .3.1 Charging stations in the U.S. . 242.3.2. Charging Basics . 25III. METHODOLOGY . 283.1 The analysis approach . 283.2 The background research . 29IV. ANALYSIS . 314.1 Transformation of California’s car fleet in 2040 . 314.2 Tailpipe emission rates comparison . 344.3 Automobile operating costs . 37
4.4 Benefits of EVs . 394.4.1 Consumer’s financial benefits. 394.4.2 Environmental benefits . 404.5 Challenges . 424.5.1 Charging Stations . 424.5.2 Electricity consumption . 454.5.3 Power stations and emissions. 464.5.4 Limitations of EVs . 494.6 Social/unintended consequences . 51V.CONCLUSIONS AND RECCOMMENDATIONS . 53WORKS CITED . 55APPENDICES . 59A. Interviews . 591. Interview with Miss Deborah Scott . 592. Interview with Professor John Orr . 613. Interview with Miss Liz Tomaszewski . 62
LIST OF TABLESTable 1: Forecasted population and number of automobiles in California 2040 . 6Table 2: Electricity consumption in California 2005-2014 and 2040 projected consumption . 7Table 3: California electricity generation plus net imports . 9Table 4: California’s total electricity system power, 2014 . 11Table 5: California’s total electricity system power mix, 2014 . 12Table 6: California power plants by type, 2014 . 13Table 7: Percent capacity factors of California’s power stations by type of source of energy used,2001-2014 . 17Table 8: Percent average capacity factors of California’s power stations by type, 2001-2014 . 18Table 9: Charging Equipment . 26Table 10: Projected number of electric vehicles in California for selected years . 31Table 11: Ratio of PEVs to PHEVs for selected years . 32Table 12: Ratio of PEVs to PHEVs in 2040 for each different scenario . 33Table 13: Projected number of PEVs and PHEVs in California, 2040 . 34Table 14: Light-duty gasoline vehicle’s CO2 tailpipe emissions, 2015 and 2040 . 35Table 15: Plug-in electric hybrid vehicle’s CO2 tailpipe emissions, 2040. 36Table 16: Annual operating costs of gasoline vehicles, PEVs and PHEVs . 37Table 17: Energy Consumption of CA’s automobile fleet, 2040 . 46Table 18: Number of power stations needed to be built in 2040 . 47
LIST OF FIGURESFigure 1: ‘Can electrics rev up?’ . 2Figure 2: Hybrid electric car market annual sales . 3Figure 3: California’s per capita electricity consumption, 1960-2010 . 8Figure 4: In-state electric generation by fuel type, 2001-2014 . 14Figure 5: Installed in-state electric generation nameplate capacity by fuel type, 2001-2014. 16Figure 6: Robert Anderson’s electric vehicle, 1832 . 21Figure 7: Typical PEVs battery pack . 22Figure 8: Electric charging stations in the U.S., 2015 . 25Figure 9: Ratio of PEVs to PHEVs for three different scenarios, linear regression model . 32Figure 10: EVs pollution ratings vs gasoline vehicles’emissions by region, 2015 . 41Figure 11: Range vs temperature, Tesla owner’s personal usage data . 50
I.INTRODUCTIONSince the appearance of the internal combustion engine towards the end of the 19th century andspecifically its installation and use in wheeled automobiles, motorcars have been creatingpollution as a result of their emissions to the environment. The degree of this pollution has beenincreasing over time with more and more automobiles appearing on the roads through the years.It was only in the early 1950’s when air pollution and automobiles were first linked by aCalifornia researcher who determined that vehicle traffic was the cause for the smoggy skiesover the city of Los Angeles [1]. In relatively recent years, there have been several attempts toregulate these emissions, such as the first auto emissions law which was passed in California in1964 and the establishment of the United States Environmental Protection Agency in 1970 underthe presidency of Richard Nixon. Despite the several emissions regulations, the internalcombustion engine, powered by fossil fuels, will inevitably continue to emit and causeenvironmental pollution. This fact, coupled with the rapid technological developments throughthe late 20th century until today, has stimulated corporations worldwide to pursue and developalternative means to vehicle power, in an overall effort of both reducing environmental harm andabiding to stringent emission laws passed by national governments around the globe.Hybrid and electric vehicles have gained significant popularity over the past few years as theyare generally believed to be a ‘greener’ solution compared to their gasoline peers. It is wellknown that vehicle emissions are responsible for large amounts of greenhouse gas productionand are leading contributors toward smog and general air pollution. Consumers as a whole arestarting to be more environmentally aware of these problems. With gas prices skyrocketing overthe past few decades consumers have yet another reason to start paying more attention to the
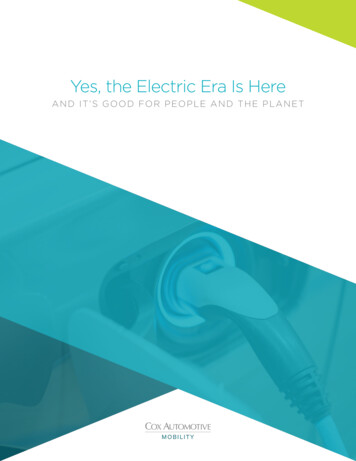
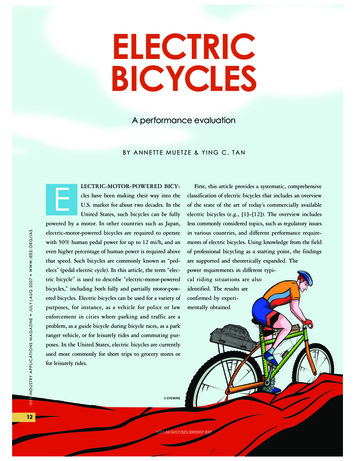
benefits of using alternative, low-emission vehicles. At the same time, car manufacturers aroundthe world have been developing new technologies to promote the usage of hybrid and electricvehicles. “The market for electric cars is sputtering, but the price of the technology is falling”[2], says Michael Law, an analyst at Needham & Co. Electric vehicles’ annual sales statisticswho also supports this prediction.Figure 1: ‘Can Electrics Rev up?’ [2]
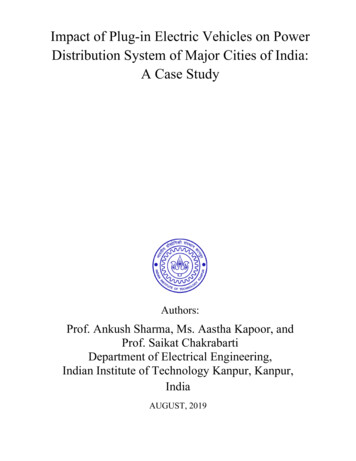
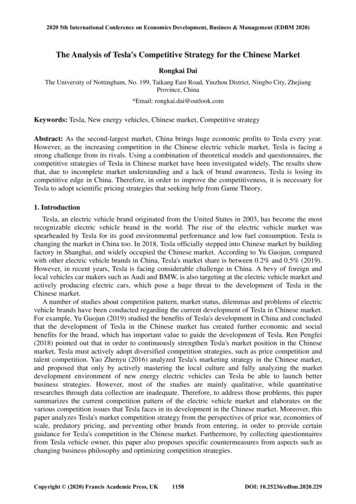
Figure 2: Hybrid Electric Car Market Annual Sales [2]In the United States the federal government has been supportive towards these emergingtechnologies by offering tax credits to owners of such vehicles while incentivizing consumers topurchase such vehicles by offering mandates and other subsidies.Specifically in California, a government plan, known as the Zero-Emission Vehicle Plan, hasbeen developed to promote ownership and usage of hybrid and pure electric vehicles [3].Meanwhile, a big question is still left unanswered, "when and how can low-emission vehiclesreplace traditional petroleum ones?” Current electric and hybrid vehicle technology does notoffer the vehicle functionalities and conveniences that their gasoline peers provide. Indicatively,a Nissan Leaf has a city mile range between 84 and 107 miles but needs 24 hours on average (at110 Volts) and an average of 7 hours (at 220 Volts) for a full charge. A Chevrolet Volt requires ashorter time for a full charge with 13 hours to be the usual at 110V and up to 4.5 hours at 220Volts. However, according to owner’s testimonials the car’s battery range is short, compared tothe range of a gasoline-powered vehicle, being approximately 50 miles during spring season anddown to 26 miles during winter [4]. Moreover, internal combustion vehicles have dominated the
market since their appearance until today that at least one gas station is located in every townacross the U.S. The same cannot be claimed for electric and hybrid cars as the number of electricstations and charging outlets across the country has been increasing only in the past few years.Nationwide, about 10,000 publicly available EV chargers compete with about 114,000 gasstations, according to Department of Energy data.To provide adequate electricity to EV’s, a considerable amount of charging stations might needto be built, let alone power plants to support them. The current conditions, though, do not preventCalifornia Governor Edmund G. Brown Jr. from believing in the fate of these vehicles. He hasordered that 1.5 million zero-emission vehicles “be on California roads” by 2025 as a regulatoryweigh station in order to meet the state’s goal of cutting its greenhouse emission to 80% below1990 levels [3]. Governor’s interagency working group has prepared the zero-emission vehicleaction plan in a coherent attempt to achieve these goals.This statement provides the drive of this study which more specifically investigates some of thenecessary steps needed be achieved if all automobiles in California of 2040 were to be replacedby pure electric vehicles (PEV’s) and plug-in hybrid electric vehicles (PHEV’s), altogetherreferred to as electric vehicles (EV’s), and the associated benefits and challenges of this.Initially, relevant background information regarding the State of California is provided andprojected for the year of 2040. Further, the current status of EV’s, including a brief history of theelectric vehicle and currently available charging methods are looked at. An emission analysisfollows and an estimate of EVs’ annual operating cost. Results on the number of electriccharging stations and power plants needed to be built in order to accommodate this change are
provided. Finally, the report closes with a discussion of the benefits and limitations of electricvehicles and their future.
II.BACKGROUND2.1 CALIFORNIA RELEVANT STATISTICS2.1.1 TRANSPORTATION STATISTICSAs mentioned in the previous section, the main objective of this project is to analyze andevaluate certain aspects of future California 2040 when all non-commercial vehicles (alsoreferred to as passenger vehicles) will be replaced by electric or hybrid electric cars. Since wecannot simply predict relevant for our calculations data we need to look at the current statisticsand project those in 25 model years from now. It is forecasted that the population of Californiawill increase from 37.8 million people in 2015 to 48.2 million while the number of registeredautomobiles will rise from 33 million to 43 million for the same period [5]. We are interested inthe number of non-commercial vehicles, reported as automobiles in this study, therefore we needto estimate how many of those vehicles will be non-commercial in 2040. According to CaliforniaDMV statistics there are 32,980,355 registered vehicles as of January 1, 2015 in the state ofCalifornia out of which 23,805,920 are automobiles, a 72% out of the total registered vehiclefleet [6]. Using the same ratio we estimate that there will be approximately 30.7 million noncommercial vehicles in California roads in 2040. The following table summarizes the above.Table 1: Forecasted population and number of automobiles in California, 204020152040Percentage IncreasePopulation (millions)37.848.227.5%Automobiles (millions)23.831.029.9%
2.1.2 ELECTRICITY GENERATION AND CONSUMPTION STATISTICSAn estimate of the current electricity consumption in the State of California is necessary in orderto forecast the electricity consumption demand for our hypothetic scenario in future California of2040 where all automobiles will have been replaced by electric and hybrid vehicles. Availabledata on the electricity consumption for the state of California dates up to the year of 2014. Thefollowing table provides population and electricity consumption statistics for a ten-year periodfrom 2005 to 2014 along with a forecasted estimate of these numbers for the year of 2040.Table 2: Electricity Consumption in California 2005-2014 [7] and 2040 projectedconsumptionYearPopulationElectricity consumption (GWh)Per capita .00756**: Projected values based on the average per capita electricity consumption of 0.00756 (GWh/person) during 2005-2014
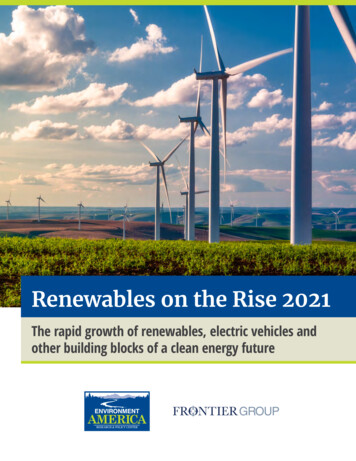
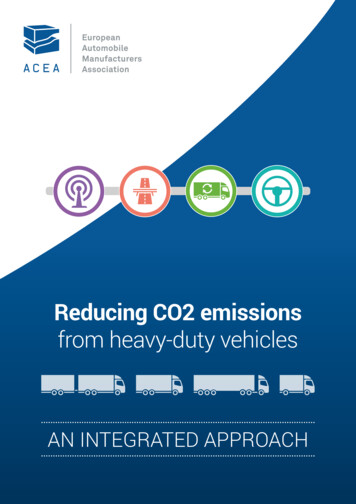
The average per capita electricity consumption in the state of California during the years 2005 to2014 is estimated to be equal to 0.00756 GWh/person. Using this number as an indicativeaverage it is forecasted that the electricity consumption in California in 2040 will amount to364,089.6 gigawatt-hours (GWh). It should be noted that this is only a forecasted approximationsupported by historic data and trends assuming a ceteris paribus (‘all other things being equal’)analysis. More on this approach will be found in the Methodology section of this report.Furthermore, this predicted value for the net electricity consumption in California in 2040 doesnot take into account the overall impact of the relative energy and electricity aspects due to theshift of the California automobile fleet to electric and hybrid vehicles.The following graph shows electricity consumption per capita in California (shown by the redline) over a fifty year period from 1960 to 2010.Figure 3: California’s per capita electricity consumption [8], 1960-2010We can observe in the above graph that the electricity consumption per capita in California fallsin the range of approximately 7000 kWh/person (0.007 GWh/person) on average after the 1970’sand onwards which is consistent with our forecasted results despite their assumptions.
The following table shows California’s electrical energy generation plus net imports for the years2005 to 2014. In other words, this is the amount of the total electricity that is generated withinthe California state plus the total amount of electricity that the state imports from externalsources for each of the listed years. The state’s electricity consumption over the state’s electricitygeneration plus its net imports for each of those years is also provided as a percentage.Table 3: California Electricity Generation plus Net Imports [9]YearElectricity generation plus netimports (GWh)Electricity Consumption overNet electricity generation net imports 5.12040*386,507*94.2**: Projected values based on the 94.2% average yearly ratio of California’s electricity consumption over its net electricitygeneration plus net imports calculated for the years 2005-2014
The ratio of California’s yearly electricity consumption over its yearly net electricity generationplus its net imports is calculated as a percentage for each of the years from 2005 to 2014. Theaverage of these percentage ratios was estimated to be equal to 94.2%. That is, on average for thetime period from 2005 to 2014 the state of California consumes 94.2% of its total net electricitygeneration which results from in-state but also out-of-state sources. The amount of electricitythat California will be generating in 2040, in-stately plus from its net electricity imports, wasforecasted assuming that the state will be consuming 94.2% of this amount and using thepredicted electricity consumption for the same year (364,089.6 GWh), provided in Table 2.Again, this is a forecasted approximation using past historic data and assuming that all otherthings are kept equal (ceteris paribus). These data, actual and forecasted, will be essential for theanalysis which will follow in the ‘Results and Discussion’ Section of this report.2.1.3. ENERGY STATISTICS2.1.3a) ELECTRICITY POWER PRODUCTION MIXTo address the initial questions that comprise the main drive of this study as they were elucidatedin the Introduction section of this report, certain energy – relevant aspects regarding the state ofCalifornia should be looked at. It is therefore of great relevance to this study to look atCalifornia’s total electricity system power, which refers to the State’s annual total energyrequirement for all the utilities with end-use within the State. The following table summarizesCalifornia’s total system power for the year of 2014 – the most recent available data – and thecomponents (the various fuel types and other sources) it consists of.
Table 4: California’s Total Electricity System Power, 2014 [10]Fuel TypeIn-StatePercent ofNet ImportsCaliforniaPercentGenerationCA In-State(GWh)Power MixCalifornia(GWh)Generation(GWh)Power MixCoal1,0110.5%17,87718,8886.4%Large Hydro14,0527.1%2,29816,3505.5%Natural 4.4%Small lUnspecifiedSources*Total*: Unspecified Sources of Power generally includes spot market purchases, wholesale power marketing, purchases from poolsof electricity where the original source of fuel is not determined, and "null power". Null power is the generic electricitycommodity that remains when the renewable attributes, renewable energy credits, are sold separately . [10]Furthermore, the following table is a summary of California’s percent total electricity systempower mix for the year of 2014, listed in descending order.
Table 5: California’s Total Electricity System Power Mix, 2014 [produced from values in Table 6]Fuel TypePercent California Power MixNatural Gas44.5%Renewables20.1%Unspecified Sources15.0%Nuclear8.5%Coal6.4%Large Hydro5.5%Total100.0%As it shown in Table 7, California produced most of its electricity to meet its energy demands forthe year of 2014 from natural gas, amounting to nearly half of its total power mix, followed byrenewable sources with wind power to be the predominant one among them (as it can be seen inTable 6). A 15% of the State’s power mix originated from spot market purchases and pools ofelectricity in which the original source of fuel could not be determined by the government’senergy commission.The following section includes relevant information on California’s power stations, also knownas power plants, along with an explanation of some useful relevant terms which will be used lateron to produce results and facilitate further discussion.2.1.3b) POWER STATIONSThe following table provides a list of power stations in the state of California based on the typeof fuel they use or their source of electricity generation. The list is based upon the most recent
available data which dates up to 2014 and includes power stations with an electric generationcapacity of 1 mega-watt (MW) and above. It should also be noted that this is only anapproximate list as both the operation and the electric generation capacity of the power stationsdepends on several factors, including seasonality, electricity demand and prices and various otherspecifications. However, it provides a good representation of the most recent number of powerstations in the state of California according to their type.Table 6: California Power Plants by type [11], 2014TypeNumber of PlantsHydroelectric43Natural Nuclear1There are some key terms need to be explained which will provide a better understanding of thediscussed information regarding power stations and electricity production. The ability of a powerstation to produce electricity is determined by its capacity and capacity factor. In general,electricity generation capacity refers to the maximum electric output a generator is able to
produce under specific conditions. It is determined by the generator’s manufacturer and indicatesthe maximum output that it can produce without exceeding design thermal limits [12] (alsoknown as nameplate or installed capacity). This is different to electricity generation which refersto the amount of electricity a generator produces over a specific period of time at its capacity andis usually measured in Mega-Watts (MW). Furthermore, net electricity generation is the amountof gross electricity a generator produces minus the electricity used to operate the power station[12]. Last but not least, another key-term when it comes to any type of power production is thecapacity factor. For a power plant that produces electricity, the capacity factor is the ratio of thenet electricity generated over a period of time (actual output), to the electricity that could havebeen generated if the plant was operating at continuous full-power operation – at its nameplatecapacity – during the same period of time (potential output) [13].The following figure shows California’s in-state electric generation by fuel type (in GWh) for theyears 2001 to 2014.Figure 4: In-State electric generation by fuel type (GWh), 2001-2014 [14]
The figure above highlights California’s power production mix during the time period 20012014, as was indicated in the previous section of this report 2.1.3a). Moreover, it provides avisual representation of the contribution of each of the listed energy sources to the net amount ofelectricity generated during these years. To this contributed the breakthrough, in the relativelyrecent years, in the photovoltaic technology which led to the adoption and installation of severalphotovoltaic units and panels across the state of California. Most of the electricity generatedcomes from natural gas sources, followed by the renewable sources of energy - which is the netsum of biomass, geothermal, sm
This study examined necessary steps needed be achieved if all automobiles in California 2040 are replaced by electric vehicles (EVs); pure electric vehicles (PEVs) and plug-in hybrid electric vehicles (PHEVs). The analysis was based on a ceteris paribus model where current data and