Transcription
Paper 3262-2019STEPPING UP YOUR SAS GAME WITH JUPYTER NOTEBOOKSHunter Glanz, Statistics Department, California Polytechnic State University, San Luis Obispo,CaliforniaABSTRACTFrom state-of-the-art research to routine analytics, the Jupyter Notebook offers anunprecedented reporting medium. Historically, tables, graphics, and other types of outputhad to be created separately and then integrated into a report piece by piece, amidst thedrafting of text. The Jupyter Notebook interface enables you to create code cells andmarkdown cells in any arrangement. Markdown cells allow all typical formatting. Code cellscan run code in the document. As a result, report creation happens naturally and in acompletely reproducible way. Handing a colleague a Jupyter Notebook file to be re-run orrevised is much easier and simpler for them than passing along, at a minimum, two files:one for the code and one for the text. Traditional reports become dynamic documents thatinclude both text and living SAS code that is run during document creation. With the SASkernel for Jupyter, you have the power to create these computational narratives and muchmore!INTRODUCTIONIn the past, scientific research and statistical analyses took place almost exclusively withinparticular software packages like SAS, Python, R or some other domain-specific program. Asingle project usually included multiple scripts that compartmentalized tasks like datacleaning, data manipulation, data visualization, statistical analysis and interpretation.Whether these pieces were executed separately or within some main, delegating script, theyall stood apart from the write-up or narrative that inevitably accompanies such projects. Ofcourse the code throughout should be well documented/commented, but some of thesedescriptions and explanations often appeared in the write-up as well. Output and graphicsneeded to be copied or exported in some way in order to integrate them into the projectwrite-up. In the end, the report reads well and looks nice, but to fully share your projectwith someone there were numerous files to consolidate and send: code scripts, image files,data files, the codebook for the data, and the project write-up itself. The whole ordealalmost required a separate file with instructions on how to navigate all of these projectmaterials!As of September 1, 2016 the Journal of the American Statistical Association: Applicationsand Case Studies requires code and data as a minimum standard for reproducibility ofstatistical scientific research [1]. The concept and goal of reproducibility seems like itshould have always been implicit in all analyses and research, but only in recent years hasits explicit popularity exploded. Courses on sites like Coursera emphasize adhering to thisprinciple, and now the American Statistical Association will tangibly require it as part of theirpublication process. This all means authors are now required to submit collections ofmaterials similar to those described above: possibly multiple code scripts, data files, and thearticle itself. This process can seem like a hassle and might even increase the potential forerrors and problems with more materials to keep track of.The Jupyter Notebook alleviates the obligation to navigate all of these files by allowing thecode, output, graphics, codebook for the data, and narrative text to exist within the samefile! With the code in the same file as the text, the possible redundancy between commentsin the code and text in the write-up disappears. How does the Jupyter Notebook accomplishall of this?1
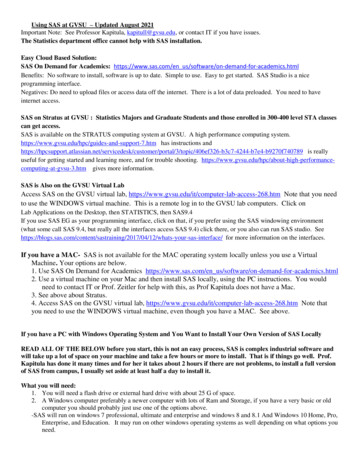
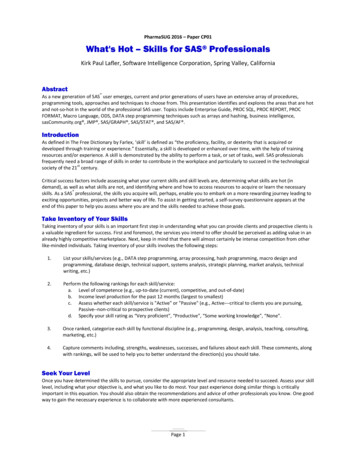
The Jupyter Notebook is a web application that allows you to create and share documentsthat contain live code, equations, visualizations and explanatory text [2]. The notebook hassupport for over 40 programming languages, including SAS now. Notebooks are easilyshared with others. Code within the notebook can produce rich output such as images,videos, LaTeX, and JavaScript. Interactive widgets can be used to manipulate and visualizedata in real time.Wrapping all of these utilities into one cohesive tool revolutionizes the way we do datascience and statistical computing/communication. The benefits of the Jupyter Notebookshone across arenas such as computing coursework, academic research, and numerousindustries.WHERE TO BEGINLearning a new tool can be daunting, especially one that accomplishes so much! Thankfully,Project Jupyter [2] makes it easy to install and use by following the instructions at:https://jupyter.org/installThese instructions only get you started with the Jupyter software and Python (the languageit was originally built for). In order to use SAS with Jupyter, you will need to install the SASkernel for Jupyter. The experts at SAS have made this straightforward as well, by followingthe instructions at their GitHub page here:https://github.com/sassoftware/sas kernelWith these set up you will be on your way in no time at all! For a more accessible trial of theSAS-with-Jupyter environment, be sure to check out SAS University Edition. Users of SASUniversity Edition likely already know that Jupyter Notebooks (and now JupyterLab) havebeen an alternative to the SAS Studio interface for some time now. This alternative requiresno extra effort! Figure shows the welcome screen for SAS University Edition, containingoptions to either start the SAS Studio interface or the JupyterLab interface.Figure 1. Homepage of SAS University Edition. Traditional button to start SASStudio interface is accompanied by an option to start JupyterLab.2
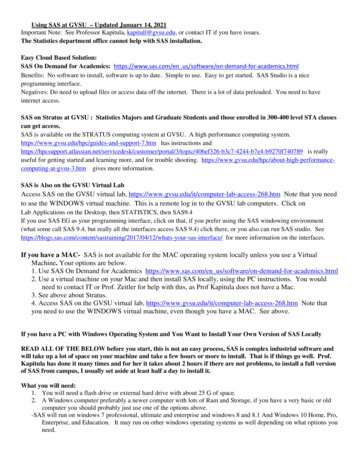
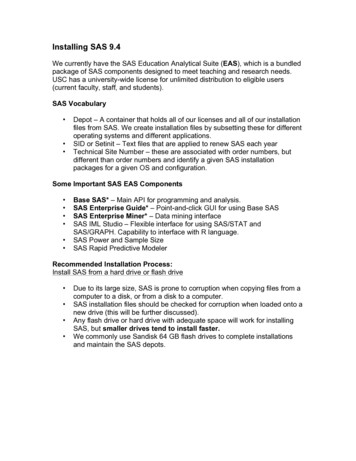
With your venue determined, it’s a small step to launch your first Jupyter Notebook andbegin working with SAS in one of the most exciting new ways!JUPYTER NOTEBOOKSBrian Granger, one of the developers of Project Jupyter, often recounts [3]:“Computers are good at consuming, producing and processing data. Humans are good atconsuming, producing and processing stories. For data to be useful to humans, we needtools for telling stories that involve code and data.”This impetus for the creation of Project Jupyter helps define Jupyter Notebooks as a vehiclefor what we now call computational narratives. Communication of statistical investigationsand analyses supersedes all else, but depends on data and code at its core. Without thestory or context, data summarizations and visualizations can be dry and meaningless. TheJupyter Notebook accommodates and unifies all of these things within a single environment.A typical Jupyter Notebook consists of a series of cells, as many as you like. These cells cancontain code or markdown text. The user is literally creating a living, dynamic documentthat appears as a typical write-up would but contains live code that you can run at anytime. The cells can re-arranged at will and the code cells can be executed altogether or inany order you like.Though the Jupyter Notebook is a web application, it is easily installed and used on anypersonal machine. It can also be deployed on centralized servers for use by many differentusers either within an organization or a class of students. Jupyter Notebooks with SAScan now also be used from within SAS University Edition! (as mentioned in theprevious section)Figure 2 shows the header of the “home” page once you have launched Jupyter from yourown personal installation. Figure 3 shows the “home” page of JupyterLab, the interface nowoffered through SAS University Edition.Figure 2. Header of “home” page of Jupyter. The image is from within a GoogleChrome browser, but other browsers would work fine.3
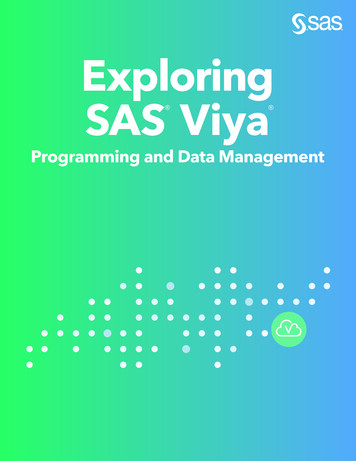
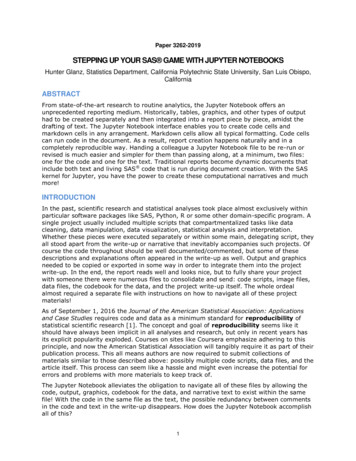
Figure 3. Home screen of JupyterLab through SAS University Edition. File exploreron the left side panel. Notebook launcher on the right main panel.From here you can navigate throughout your computer or system as you would from within“My Computer” on a PC or even a terminal on Mac/Linux. In fact, the initial installation ofJupyter provides functionality for use as a simple text file editor, a terminal, or the notebookenvironment (the focus of this paper).Figure 4. The choice for new applications from within Jupyter (left) or JupyterLab(right). In JupyterLab, one can either use the “File” menu at the top or click theappropriate icon in the main panel.Figure 4 demonstrates how you might open a new text file, terminal, or notebook withinJupyter. Notice, to open a new notebook you must specify the kernel you would like to usefor that notebook. That is, you must choose the base/major programming language that willbe in use throughout that notebook. It is possible to use multiple languages within a singlenotebook, but I will not get into those details here. Based on the image in Figure 2, you cansee I can make use of Julia, Python, R, or SAS from within a notebook. When workingwith Jupyter Notebooks within SAS University Edition you currently only haveaccess to a text file editor, folder explorer, and notebooks using SAS or Python (noother languages are available).4
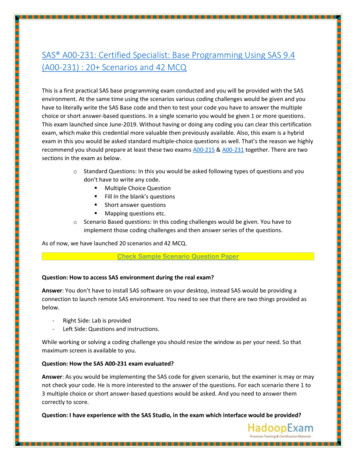
To start a new notebook I need only click on the desired kernel. This will create a newnotebook file within my current working directory. The file will then appear under the Filestab on your home page (or in the JupyterLab left panel). Because that notebook needs to beable to run code, upon creation it will also show up under the Running tab on your homepage. Stopping or halting your notebook will not delete or remove it, but just stop thekernel so that your machine no longer spends valuable resources on it. So what does anotebook look like?Figure 5. A new Jupyter Notebook with a SAS kernel in Jupyter (top), orJupyterLab (bottom).Figure 5 depicts a freshly created Jupyter Notebook with a SAS kernel. Jupyter notebooksalways display the type of kernel in the top right corner of the page. The name of the file(notebook), currently “Untitled”, can be changed by simply double-clicking it at the top.Jupyter notebooks are made up of a series of cells. The flexibility of these cells makesJupyter the amazing tool that it is. The notebook starts with a single cell, displayed in Figure5 as the beige box in the middle with “In [ ]:” directly to the left of it. The thin gray boxaround this cell means that it is selected. The “In [ ]:” notation in addition to the word“Code” at the top of the screen indicate that this is a code cell. This means SAS code couldbe entered into this cell and run. The output would then appear in a cell directly beneath thecell in which the code was run, as seen in Figure 6.5
Figure 6. Sample SAS output in a Jupyter Notebook.Code cells and SAS output cells seem easy enough to use and navigate, but where did theSAS log go? SAS wonderfully integrates two easy-to-use buttons for accessing the SAS log,as seen in Figure 7. Because code cells can be run individually or in groups or all at once,and because Jupyter Notebooks can become quite lengthy, one button accesses the log forthe most recently executed cell while the other accesses the log for the entire notebook.The buttons displayed in Figure 7, for revealing the log, do not exist in the JupyterLabinterface. From within JupyterLab, to view the log for SAS code that you have just run youshould type %showLog or %showFullLog in the next cell and then run that cell.6
Figure 7. Access to the SAS log in a Jupyter Notebook. The left button shows theSAS log for the last executed cell. The right button shows the complete SAS log forthe entire notebook.Up to this point Jupyter has not provided anything Base SAS does not already provide,except that this notebook structure of a series of cells lends itself incredibly well to easilyand conveniently running only certain pieces of code or portions of an analysis.Figure 8. Some of the options and flexibility for running parts of your notebook inJupyter (left) or JupyterLab (right).Figure 8 hints at the flexibility Jupyter boasts when it comes to partially running your scriptor analysis. These pieces, or cells, are much more distinguishable than comment-separatedportions of code within a single SAS script.Jupyter’s coup de grace over most, if not all, other tools of this nature is its flexibility in celltype. The cells of these notebooks are not restricted to code!7
Figure 9. The menu for choosing cell type.With coding and markdown cells the Jupyter Notebook literally becomes a living, dynamicdocument! SAS code can be entered and run in one cell, produce output in the next, and bewrapped above and below with text telling the story of the analysis. Jupyter effectivelymakes the job of report writing seamless and painless.Notebooks are, indeed, easily shared but we are by no means confined to Jupyter forviewing things.Figure 10. Save types for Jupyter notebooks.The default extension of a Jupyter Notebook is .ipynb, after the IPython Notebook thatpreceded Project Jupyter. Figure 10 reveals the many well-used formats that Jupyternotebooks can be downloaded as in addition to .ipynb. Notably, Jupyter notebooks can beconverted to HTML or PDF files, which are even more ubiquitous than notebook files for8
now. You can even download the code from your entire notebook as a traditional SAS script.Now it takes a relatively small amount of time to create a coherent, integrated documentthat is publication quality!Figure 11. A snippet from an example notebook on integration.Figure 11 displays a small portion of a dynamic document created using a Jupyter Notebookto discuss integration. While the example is a bit pedantic, it demonstrates nicely the fullintegration of markdown headings, a visualization, accompanying text including LaTeX mathnotation, and executed but suppressed code.9
USING JUPYTER TO DO REPRODUCIBLE DATA SCIENCEStatistics and Data Science projects often involve an extensive and sometimes intenseworkflow that can start with data collection. Usually data must be cleaned in some way andthen prepared for analysis. Summaries and visualizations supplement both the exploratorydata analysis phase and the final analysis itself. This collection of commented scripts mustinevitably get cleaned up after the project to make it more easily shared and readable toothers. Even once the scripts are clean, the results of all that work are distinct from scripts;living in their own meticulously drafted report.The Jupyter Notebook simplifies all of this by assimilating the code, the documentation forsaid code, the output and graphics, and the project write-up into a single, unified documentthat ensures reproducibility by allowing live code to be run throughout the document.Granger, again, would say the Jupyter Notebook is “making computational reproducibilityenjoyable and minimizing the ‘distance’ between a human user and their code/data throughinteractivity” [3].The use of Jupyter Notebooks and support for them continues to grow exponentially to thepoint where they are becoming a standard environment to work in. Github now rendersJupyter Notebooks and is indexing notebook content, going so far as to track trendingnotebooks. The Binder project enables Github hosted notebooks to be run by anyone on theinternet!Many online scientific publications now include their data and analysis via JupyterNotebooks. O’Reilly media publishes books accompanied by Jupyter Notebooks.BuzzFeedNews publishes code and data for all data-backed articles they write, via JupyterNotebooks. The LA Times is starting to do the same thing!While Project Jupyter is free to use, it’s gaining popularity in commercial products as well.Companies like IBM, Kaggle, Google Cloud Datalab, DataRobot, dataiku, and many more arebuilding dashboards, platforms and other products based on Jupyter Notebooks.The academic uses for Jupyter are just as obvious as the industry-based ones! In parallelwith the explosion of reproducibility as a standard for data science work is the increasingtrend of tool plurality among data scientists. Whether it’s a variety of tools or just a smallhandful, more and more people who work with data do that work with multiple softwarepackages: SAS, Python, R, Tableau, and many more. Jupyter’s compatibility withnumerous languages, including SAS, Python, and R, is another huge benefit itboasts!USING JUPYTER TO REINFORCE SOFT SKILLS IN THE CLASSROOMHistorically, writing reports and presentations involved cobbling together separately createdcode, output, and graphics throughout the text of your story or analysis; assignments instatistical computing courses involved the creation of a program or script to accomplishsome set of tasks.To be fair, less than a year ago my own assignments for Cal Poly’s course in statisticalcomputing with SAS involved such scripts which were then submitted to be run and checkedby me or a grader. The work is tedious and inorganic. Students answer questions ascomments in their code; or create a separate document for their answers within which theymust now paste code or exported graphics. A non-trivial amount of time gets spent on thereport construction, when in fact it should be spent on the programming orwriting/interpretation or something more meaningful. Additionally, my assessment of theirassignments becomes overly focused on the technical aspects when all they submit is theirSAS script file.10
To better respect both the students’ time as well as my own, there needs to be a singlevehicle for the code, output, graphics, and text that go into a report or analysis. With such atool students would get the training and skills in statistical computing and communicationthat they deserve and need for today’s employers. Jupyter provides the answer to thisdilemma!Our STAT 330 (Statistical Computing with SAS) course introduces Statistics majors andminors to working in SAS and demands much from them in the way of data management,data manipulation, data visualization and statistical analysis. For most STAT 330 studentsthis is their first programming course, but it is a statistical computing course. Since thefocus remains data and statistics, interpretation and report writing are critical componentsof the course.Indeed, for students and others using SAS to perform statistical analyses or complete datascience projects, the construction of the report remains a key component. I will no longerask students to submit .sas files for course assignments. The ease with which students canconstruct dynamic documents, with embedded code and text, with Jupyter notebooksmakes other assignment submission types obsolete. Code cells within a Jupyter Notebookshould still be commented and documented, but the narrative of the report can exist in thedistinct markdown cells.What’s more, planning the arrangement and flow of the document within a JupyterNotebook need not happen on the fly. Students can experiment and code to their heartscontent, annotating and documenting in whatever order and wherever they choose. Cellswithin the Jupyter Notebook can be re-arranged at any point in time!Making use of the Jupyter Notebook to write up statistical analyses with embedded SAScode will drastically improve the amount of time students spend communicating about dataand statistics, the amount of feedback they get about said communication, and hence theoverall quality of their soft skills.Besides being a wonderful submission vehicle for students, Jupyter Notebooks also providea nice setting for lecture materials and textbooks themselves; and this is alreadyhappening!CONCLUSIONWhile traditional report writing using exported graphics and output has gotten easier inrecent years, it has been surpassed by Jupyter. Though not standard yet, Jupyter is used bynumerous companies and organizations as a key tool for statistics and data scienceprojects. This heavy use along with the ever-increasing demand of employers for peoplewith both technical skills in statistics and programming, and soft skills in communication,necessitates the use of Jupyter as an educational resource and industry tool.Students’ and data scientists’ abilities to write clear reports and translate statistical analysessuccinctly using numerical and graphical summaries need not be hamstrung by tediousdocument creation tasks anymore. These abilities are bound to improve with consistent useof the Jupyter Notebook for course assignments, academic publications, data journalism,data science projects in industry and everything in between to create living, dynamicdocuments!REFERENCES1. Fuentes, Montse. July 1, 2016. “Reproducible Research in JASA.” AMSTAT NEWS.2. “Jupyter.” July 21, 2016. Available at http://jupyter.org.11
3. Granger, Brian. “Jupyter Talks”. March 1, 2017. Available at https://github.com/ellisonbg/jupyter-talks CONTACT INFORMATIONYour comments and questions are valued and encouraged. Contact the author at:Name: Hunter GlanzEnterprise: Statistics Department, California Polytechnic State UniversityAddress: 1 Grand AvenueCity, State ZIP: San Luis Obispo, CA 93407Work Phone: 805-756-2792E-mail: hglanz@calpoly.eduSAS and all other SAS Institute Inc. product or service names are registered trademarks ortrademarks of SAS Institute Inc. in the USA and other countries. indicates USAregistration.Other brand and product names are trademarks of their respective companies.12
STEPPING UP YOUR SAS GAME WITH JUPYTER NOTEBOOKS Hunter Glanz, Statistics Department, California Polytechnic State University, San Luis Obispo, California ABSTRACT From state-of-the-art research to routine analytics, the Jupyter Notebook offers an unprecedented reporting medium. Historically, tables, graphics, and other types of output