Transcription
FSA Algebra IEnd-of-CourseReview Packet
FSA Algebra 1 EOC ReviewTable of ContentsMAFS.912.N-RN.1.2 EOC Practice . 3MAFS.912.N-RN.2.3 EOC Practice . 5MAFS.912.N-RN.1.1 EOC Practice . 8MAFS.912.S-ID.1.1 EOC Practice . 10MAFS.912.S-ID.1.2 EOC Practice . 13MAFS.912.S-ID.2.5 EOC Practice . 18MAFS.912.S-ID.2.6 EOC Practice . 21MAFS.912.S-ID.3.8 EOC Practice . 24MAFS.912.S-ID.3.9 EOC Practice . 262016-2017 Statistics, Probability, and the Number System – Student Packet2
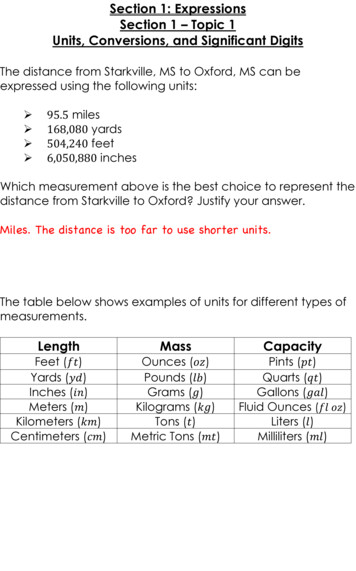
FSA Algebra 1 EOC ReviewMAFS.912.N-RN.1.2 EOC PracticeLevel 2converts radical notationto rational exponentnotation and vice versaLevel 3identifies equivalent forms ofexpressions involving rationalexponents and radical expressionswhere there is one operationLevel 4identifies equivalent forms ofexpressions involving rationalexponents and radical expressionswhere there are two operationsLevel 5[intentionallyleft blank]1. Determine whether each equation is True or False. In case you find a “False “ equation, explain why is False.TRUEFALSE ( ( ))2. Which expression is equivalent toA.()B.()( )?C.( )D.()2016-2017 Statistics, Probability, and the Number System – Student Packet3
FSA Algebra 1 EOC Review3. If x represents a positive real number, which expression is equivalent toA. B. C. D. ?4. Use the expression given below to answer the questions in part A and part B.Part A.Using the properties of exponents, rewrite the expression in the form ofPart B.If the above expression is equivalent to the expression5. Which expression is equivalent to (A.B.C. D. (what is the value of ?))2016-2017 Statistics, Probability, and the Number System – Student Packet4
FSA Algebra 1 EOC ReviewMAFS.912.N-RN.2.3 EOC PracticeLevel 2[intentionallyleft blank]Level 3completes an informal proof to show that a sum or product of tworational numbers is rational, that the sum of a rational numberand an irrational number is irrational, and that the product of anonzero rational number and an irrational number is irrationalLevel 4generalizes rules for sumand product propertiesof rational and irrationalnumbersLevel 5[intentionallyleft blank]1. Alicia added two rational numbers and arrived at the sum shown.Alicia concluded that the sum of two rational numbers is also rational. Which of the mathematical statements didAlicia use to arrive at that conclusion?I.II.III.A.B.C.D.The set of integers is closed under addition.The set of integers is closed under multiplication.A rational number can be written as the ratio of two integers.I onlyII onlyI and II onlyI, II, and III2. Jakob is working on his math homework. He decides that the sum of the expression must be rationalbecause it is a fraction. Is Jakob correct? Explain your reasoning.2016-2017 Statistics, Probability, and the Number System – Student Packet5
FSA Algebra 1 EOC Review3. The rectangle shown below has a length of 6 feet.Part AThe value of the area of the rectangle, in square feet, is an irrational number. Therefore, the number thatrepresents the width of the rectangle must beA.B.C.D.a whole number.a rational number.an irrational number.a non-real complex number.Part BThe length, l, and width, w, of the rectangle shown below have values that are rational numbers.Construct an informal proof that shows that the value of the area, in square feet, of the rectangle must be arational number.2016-2017 Statistics, Probability, and the Number System – Student Packet6
FSA Algebra 1 EOC Review4. Letrepresent a non-zero rational number and let b represent an irrational number.Part AWhich expression could represent a rational number?A.B.C.D.Part BConsider a quadratic equation with integer coefficients and two distinct zeros. If one zero is irrational, whichstatement is true about the other zero?A.B.C.D.The other zero must be rational.The other zero must be irrational.The other zero can be either rational or irrational.The other zero must be non-real.5. Which statement is NOT always true?A.B.C.D.The product of two irrational numbers is irrational.The product of two rational numbers is rational.The sum of two rational numbers is rational.The sum of a rational number and an irrational number is irrational.2016-2017 Statistics, Probability, and the Number System – Student Packet7
FSA Algebra 1 EOC ReviewMAFS.912.N-RN.1.1 EOC PracticeLevel 2applies and explainsproperties of integerexponentsLevel 3defines rational exponentsby extending the propertiesof integer exponents1. Which statement shows whyA. ()B. ()C. ()D. ()Level 4explains and uses the meaning of rationalexponents in terms of properties of integerexponents, and uses notation for radicalsin terms of rational exponentsrepresents the cubic root of?2. Four students have rewritten the expression with rational exponentDexter Martha Alicia Trevon Level 5proves the properties ofrational exponents (which arean extension of the propertiesof integer exponents)in radical form as shown.Who has rewritten this expression correctly?A.B.C.D.DexterMarthaAliciaTrevon3. Which value ofwould make the expression below equal to 8?( )A.B.C.D.2016-2017 Statistics, Probability, and the Number System – Student Packet8
FSA Algebra 1 EOC Review4. Four students were asked to solve the equation below:Their answers were, as follows:Alberto Rocio SharonAliceWhich student or students answered the problem correctly?AlbertoRocioSharonAliceAlberto and RocioAlberto and SharonAlberto and Alice2016-2017 Statistics, Probability, and the Number System – Student Packet9
FSA Algebra 1 EOC ReviewMAFS.912.S-ID.1.1 EOC PracticeLevel 2identifies dot plots,histograms, and boxplots for a given set ofdata in a real-worldcontextLevel 3uses real-world data (represented in atable or in another display) to createdot plots, histograms, or box plotsapplying correct labels forcomponents and/or axes, applyingappropriate scale in a graphLevel 4completes a dot plot,histogram, or box plot fordata that requires someinterpretation orinferenceLevel 5determines and justifies which typeof data plot would be mostappropriate for a set of data;identifies advantages anddisadvantages of different types ofdata plots1. Given the following box plot, what are the median, lower, and upper quartiles?A.B.C.D.11.5, 14, and 1612, 16, and 1812, 12.7, and 1511, 14, and 202. Select the box plot that represents the given test scores.48 50 64 64 68 68 73 77 78 82 82 82 86 86 86 91A.B.C.D.2016-2017 Statistics, Probability, and the Number System – Student Packet10
FSA Algebra 1 EOC Review3. Which of the following is the dot plot for the data: 8, 7, 6, 10, 5, 6, 6, 6, 8, 8.A.B.C.D.4. Twenty of your classmates were asked to keep track of the number of hours of TV they watched for a week. Afterthe week was up, the following data was collected. Which histogram best represents the data?10 7 8 11 7 12 7 14 18 13 7 8 6 11 12 10 9 11 11 12A.B.C.D.2016-2017 Statistics, Probability, and the Number System – Student Packet11
FSA Algebra 1 EOC Review5. Mrs. Johnson created this histogram of her 3rd period students’ test scores.Which boxplot represents the same information as the histogram?A.B.C.D.6. This graph shows annual salaries (in thousands of dollars) for all workers in a certain city.The median salary is 80,500. Which value is the best approximation for the mean?A.B.C.D. 40,250 66,500 80,500 94,5002016-2017 Statistics, Probability, and the Number System – Student Packet12
FSA Algebra 1 EOC ReviewMAFS.912.S-ID.1.2 EOC PracticeAlso assesses MAFS.912.S-ID.1.3Level 2determines themean/median andinterquartile range ofa single set of datafrom a visualrepresentation (e.g.,table)Level 3interprets the difference in mean,median, and interquartile range in thecontext of a data set and comparesthe similarities or differences inmean, median, and interquartilerange between two sets of data;predicts the effect of an outlier on theshape and center of a data set; usesthe empirical rule with data valuesthat are one or more standarddeviation about the meanLevel 4explains similarities anddifferences using specificmeasures of center andspread, given two sets of data;predicts the effect of an outlieron the spread of a data set;uses the empirical rule withtwo data values that haveintegers as standarddeviations, up to 3, above orbelow the meanLevel 5plots data based on situationswith multiple data sets, andthen compares and discussesusing measures of center andspread, normal distribution;justifies which measure(s) aremost appropriate forcomparison; identifiesadvantages and disadvantagesof using each measure ofcenter and spread1. Members of two cross-country teams ran an obstacle course. The table shows the times, in minutes and seconds, forthe members of team R to complete the course.The obstacle course times, in minutes and seconds, for team S are summarized in the box plot below.2016-2017 Statistics, Probability, and the Number System – Student Packet13
FSA Algebra 1 EOC ReviewPart AWhich Histogram represents the times from Team R on the obstacle course?A.B.C.D.Part BWhich statements are true about the data for team Rand team 5? Select ALL that apply.The median time of team R is less than the median time of team 5.The median time of team R is greater than the median time of team S.The interquartile range of team R is less than the interquartile range of team S.The interquartile range of team R is equal to the interquartile range of team 5.The data for team R is skewed to the left.The data for team S includes an outlier.2016-2017 Statistics, Probability, and the Number System – Student Packet14
FSA Algebra 1 EOC Review2. The data set shown below has an outlier. Determine the outlier and then answer the questions as to what happensto the median, mean, mode, range and standard deviation when the outlier is removed.Data: 29, 19, 35, 27, 21, 40, 23, 12, 24, 26, 20, 28, 30, 22, 19, 32, 22If the outlier is excluded, what happens to:IncreaseDecreaseNo effectthe median?the mean?the mode?the range?the standard deviation?3. Each box-and-whisker plot to the right shows the prices of used cars (in thousands of dollars) advertised for sale atthree different car dealers. Suppose Joe wants to go to the dealer whose prices seem least expensive. Which of thefollowing is the best statistical reasoning?A. Joe should go with Cars are Us because they have the lowestmaximum price.B. Joe should go with Better-than-New because they have thelowest low price of all three.C. Joe should not go with Yours Now because they have themaximum high price.D. Joe should go with Yours Now because 75% of their pricesfall in the range of the lowest 50% of both the othercompanies’ prices4. The distributions of two classes’ final exam scores are shown below.Which statement about the box-and-whisker plots is true?A.B.C.D.50% of the scores for Mr. Smith’s class are between 65 and 80.50% of the scores for Mrs. Jones’ class are between 80 and 100.The median scores for the two classes are the same.The interquartile range of scores for Mr. Smith’s class is greater than the interquartile range of the scores forMrs. Jones’ class.2016-2017 Statistics, Probability, and the Number System – Student Packet15
FSA Algebra 1 EOC ReviewFor questions 5-6, use the following scenario.A survey was made of high-school-aged students owning cell phones with text messaging. The survey asked howmany text messages each student sends and receives per day. Some results are shown in the table below.5. A histogram of the girls’ responses (not shown) has a strong right skew. Which statement would support thatobservation?A.B.C.D.The number of girls’ surveyed is greater than the mean number of texts sent by girls.The mean number of texts sent by girls is greater than the median number of texts sent by girls.The mean number of texts sent by girls is greater than the mean number of texts sent by boys.The median number of texts sent by girls is greater than the median number of texts sent by boys.6. Which group’s data has the larger interquartile range?A.B.C.D.BoysGirlsNeither, they are equal.It cannot be computed from the information given.7. Noah conducted a survey on sports participation. He created the following two dot plots to represent the number ofstudents participating, by age, in soccer and basketball.Which statement about the given data sets is correct?A.B.C.D.The data for soccer players are skewed right.The data for soccer players have less spread than the data for basketball players.The data for basketball players have the same median as the data for soccer players.The data for basketball players have a greater mean than the data for soccer players.2016-2017 Statistics, Probability, and the Number System – Student Packet16
FSA Algebra 1 EOC Review8. Use the table to answer the question.Which conclusion about T-shirt prices at Cool Clothes and Ben’s Shirts is best supported by the data?A.B.C.D.Some high-priced T-shirts at Cool Clothes make the mean higher than the median.The fact that the mean and median are very similar at Ben’s Shirts shows that all of the shirts cost under 15.Comparing the mean prices shows that most shirts are cheaper at Ben’s Shirts than at Cool Clothes.Comparing the interquartile range shows that T-shirts at Cool Clothes are about twice as expensive as T-shirts atBen’s Shirts.9. A group of students measures the distance a toy car has traveled after different amounts of time. A table of the datais shown.Time (second)Distance 4.84.54.9The students want to perform an analysis of the data set and consider removing the outlier point.Select All of the quantities that will change if the outlier point is removed from the data set.Mean of the timeMean of the distanceMedian of the timeMedian of the distanceRange of the timeRange of the distance2016-2017 Statistics, Probability, and the Number System – Student Packet17
FSA Algebra 1 EOC ReviewMAFS.912.S-ID.2.5 EOC PracticeLevel 2completes a twoway frequencytable that requirescompletion offrequenciesLevel 3creates or completes a two-way frequencytable when up to two joint, marginal, orconditional relative frequencies aredescribed within the context; finds thevalues for joint, marginal, or conditionalrelative frequencyLevel 4chooses an interpretation ofjoint, marginal, andconditional relativefrequencies; recognizespossible associations andtrends in the dataLevel 5interprets joint, marginal,and conditional relativefrequencies; identifies andconcludes associations andtrends using a two-wayfrequency table1. A random sample of 200 teenagers participated in a taste test. Each teenager sampled four choices of fruit drink(labeled “A”, “B”, “C”, and “D”), and then were asked to pick a favorite. The table shows the results of this taste test.Based on the information given, which of the given statements are true? Select ALL that apply.40% of the participants were girls70% of the participants preferred “A”of the boys preferred “D”of the participants who preferred “B” were girlsThe proportion of boys who preferred “C” is equal to the proportion of girls who preferred “C”2. A radio station did a survey to determine what kind of music to play by taking a sample of middle school, highschool, and college students. They were asked which of three different types of music they prefer on the radio: hiphop, alternative, or classic rock.The results are summarized in the table below.Middle SchoolHigh SchoolCollegeHip-Hop282216Alternative182220Classic Rock4614What percentage of college students prefer classic rock?A.B.C.D.14%28%33%58%2016-2017 Statistics, Probability, and the Number System – Student Packet18
FSA Algebra 1 EOC Review3. You are testing a theory that says that students who speak a foreign language are also strong mathematics students.You survey the freshman class and the results are shown below, in an incomplete two-way frequency table. Answerthe questions, regarding this table. (Percentage answers rounded to nearest percent.)Speak a ForeignLanguageDo Not Speak aForeign LanguageMath Average7015Math Average NOT1050TotalsTotalsa) How many students were surveyed?A. 65B. 85C. 145D. 80b) What percentage of the students speak a foreign language and have a math average greater than or equal to90?A. 41%B. 48%C. 82%D. 88%c) What percentage of the students with a math average greater than or equal to 90 do not speak a foreignlanguage?A. 10%B. 18%C. 23%D. 25%For questions 3-5, use the following scenario.A survey asked 100 students whether or not they like two sports: soccer and tennis. The results of the survey are shownin the table.4. What is the relative frequency of students who like tennis, soccer, or both?A.B.C.D.0.120.660.780.905. What is the relative frequency of students who like tennis?A.B.C.D.0.120.180.250.302016-2017 Statistics, Probability, and the Number System – Student Packet19
FSA Algebra 1 EOC Review6. What is the relative frequency of students who like both tennis and soccer?A.B.C.D.0.120.300.600.787. A high school principal randomly surveyed students about a change in the dress code. The results are shown in thetable.Part AWhat percentage of all respondents favors the policy change?Part BWhich class has the highest favorable percentage? Which class has the lowest favorable percentage?Part CIs there a relationship between class and favoring the dress code change? Explain.8. Use the table below to answer the questionA community has to decide whether to raise taxes to create a new park. Voters in two neighborhoods are surveyedabout the issue. The results are shown in the table.Which conclusion is best supported by the data?A.B.C.D.More than 50% of the people surveyed support the park.About the same percentage of East Side and West Lake voters support the park.About the same percentage of East Side and West Lake voters are undecided about the park.The percentage of West Lake residents who are against the park is about twice the percentage of East Sideresidents who are against the park.2016-2017 Statistics, Probability, and the Number System – Student Packet20
FSA Algebra 1 EOC ReviewMAFS.912.S-ID.2.6 EOC PracticeLevel 2creates ascatter plot ofbivariate dataLevel 3identifies a linear, quadratic, orexponential regression model thatfits the data; uses a regressionequation to solve problems withinthe context; interprets correlationcoefficient; calculates residualsLevel 4creates a residual plot anddetermines whether the functionis an appropriate fit for the data;explains why a situation withcorrelation does not implycausationLevel 5distinguishes variables that arecorrelated because one is a cause ofanother; explains why the correlationcoefficient may not show a strongcorrelation; identifies flaws in datawhere causation is claimed1. Which statistic would indicate that a linear function would not be a good fit to model a data set?A.B.C.D.2016-2017 Statistics, Probability, and the Number System – Student Packet21
FSA Algebra 1 EOC Review2. Vance graphed the relation between fund-raising profits for the chess club and the number of members.Which equation represents a line that fits the data?A.B.C.D.Professor Plum conducted an experiment on the number of bacteria growing in his lab. The data below shows hisresults.Write a function to model this situation.3. Matt drank a super tall glass of soda pop which had 200mg of caffeine. His body can process about 15% of thecaffeine every hour. Which of the following best models the number of milligrams of caffeine, , remaining in hisbody hours after he drank that soda pop?A.B.C.D.(((())))(())2016-2017 Statistics, Probability, and the Number System – Student Packet22
FSA Algebra 1 EOC Review4. The scatterplot below represents the forearm lengths and foot lengths of 10 people.Based on a linear model of the data, which is the best prediction for the length of a person’s foot if his/herforearm length is 21 centimeters?A.B.C.D.19 cm20 cm22 cm24 cm5. The line of best fit for the scatterplot below isWhat is the residual for the point (4, 10)?A.B.C.D.-1.51.58.5102016-2017 Statistics, Probability, and the Number System – Student Packet23
FSA Algebra 1 EOC ReviewMAFS.912.S-ID.3.8 EOC PracticeLevel 2creates ascatter plot ofbivariate dataLevel 3identifies a linear, quadratic, orexponential regression model thatfits the data; uses a regressionequation to solve problems withinthe context; interprets correlationcoefficient; calculates residualsLevel 4creates a residual plot anddetermines whether the functionis an appropriate fit for the data;explains why a situation withcorrelation does not implycausationLevel 5distinguishes variables that arecorrelated because one is a cause ofanother; explains why the correlationcoefficient may not show a strongcorrelation; identifies flaws in datawhere causation is claimed1. What does the correlation coefficient tell us?A.B.C.D.Measure of the exponential association between two variablesMeasure of the causation of one variable on the otherMeasure of the linear association between two variablesMeasure of the distance between a datum and the value predicted by a model2. The correlation coefficient between two variables is 0.9. How would you describe this value?A.B.C.D.Strong and positiveStrong and negativeWeak and positiveWeak and negative3. We assume that SAT score is linearly associated with GPA and determine the correlation coefficient to be 0.8. Whatdoes this value suggest?A.B.C.D.SAT score decreases as GPA increasesThere is no relation between SAT score and GPAGPA increases as SAT decreasesSAT score increases as GPA increases4. Evaluate the truth of each statement about the correlation coefficient .StatementA value of near zero indicates there is a weak linear relationship betweenandTRUEFALSEA value of–indicates a weaker linear relationship between andthan a value of.A value ofindicates that there is a cause-and-effect relationshipbetween and .2016-2017 Statistics, Probability, and the Number System – Student Packet24
FSA Algebra 1 EOC Review5. The following figure displays a graph showing GPA and SAT score. Based on the scatter plot, which of the following isthe best assumption about the correlation between the variables?A.B.C.D.Positive linear correlationNo correlationNegative linear correlationExponential correlation6. Deany collects data for a market research company on the number of dollars men and women spend on videogames per year as a function of their age. She then models the data using linear functions. The correlation coefficient for the function for men is 0.30. The correlation coefficient for the function for women is 0.15.Which statement correctly describes the meaning of the correlation coefficients?A.B.C.D.Men spend approximately twice as much as women on video games.The function for men represents the amount they spend on video games better than the function for women.Men spend the most on video games at age 30, and women spend the most on video games at age 15.Men increase the amount they spend on video games by 30% each year, and women increase the amount theyspend by 15%.2016-2017 Statistics, Probability, and the Number System – Student Packet25
FSA Algebra 1 EOC ReviewMAFS.912.S-ID.3.9 EOC PracticeLevel 2creates ascatter plot ofbivariate dataLevel 3identifies a linear, quadratic, orexponential regression model thatfits the data; uses a regressionequation to solve problems withinthe context; interprets correlationcoefficient; calculates residualsLevel 4creates a residual plot anddetermines whether the functionis an appropriate fit for the data;explains why a situation withcorrelation does not implycausationLevel 5distinguishes variables that arecorrelated because one is a cause ofanother; explains why the correlationcoefficient may not show a strongcorrelation; identifies flaws in datawhere causation is claimed1. Fill in the blank: Correlation does not causation.A.B.C.D.causeimplybeatrun2. What is the definition of correlation?A.B.C.D.Measure of the strength of a linear relationship between two variablesProof that one variable causes anotherA measure of the strength of causation of one variable on anotherAn implication of causation3. Which of the following values for r suggests that one variable causes another?A.B.C.D.-0.700.9None of the above4. What does an r value of -0.89 suggest about two variables?A.B.C.D.That an increase in the independent variable causes the dependent variable to decreaseThat an increase in the independent variable causes the dependent variable to increaseAs the independent variable increases, the dependent variable increasesAs the independent variable increases, the dependent variable decreases5. Eduardo notices he gets no mosquito bites when he wears a certain kind of sunscreen. He forms two possibleconclusions.I.The sunscreen causes mosquitoes to stay away from him.II.There is a correlation between wearing sunscreen and getting no mosquito bites, but one does notcause the other.Which observation would provide the best evidence to support conclusion II?A.B.C.D.Eduardo’s friend gets mosquito bites when he goes out without sunscreen.Eduardo’s friend wears the same sunscreen and also gets no mosquito bites.Eduardo gets no mosquito bites when he goes out at the same time of day without sunscreen.Eduardo tries a new kind of sunscreen and goes out at a different time of day and gets mosquito bites.2016-2017 Statistics, Probability, and the Number System – Student Packet26
FSA Algebra 1 EOC Review 2016-2017 Statistics, Probability, and the Number System - Student Packet 10 MAFS.912.S-ID.1.1 EOC Practice Level 2 Level 3 Level 4 Level 5 identifies dot plots, histograms, and box plots for a given set of data in a real-world context uses real-world data (represented in a table or in another display) to create