Transcription
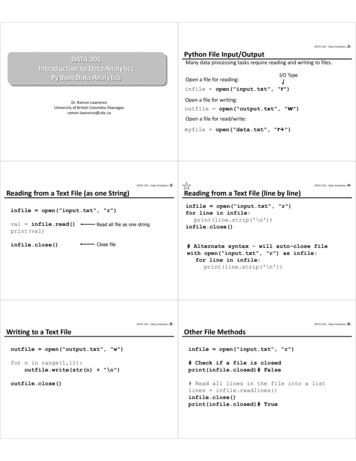
DATA 301: Data Analytics (2)Python File Input/OutputDATA 301Introduction to Data AnalyticsPython Data Analytics Many data processing tasks require reading and writing to files. Open a file for reading:I/O Typeinfile open("input.txt", "r")Open a file for writing:Dr. Ramon LawrenceUniversity of British Columbia Okanaganramon.lawrence@ubc.caoutfile open("output.txt", "w") Open a file for read/write:myfile open("data.txt", "r ")DATA 301: Data Analytics (3)Reading from a Text File (as one String)DATA 301: Data Analytics (4)Reading from a Text File (line by line)infile open("input.txt", "r")val infile.read()print(val)Read all file as one stringinfile.close()Close fileinfile open("input.txt", "r")for line in infile:print(line.strip('\n'))infile.close()# Alternate syntax - will auto-close filewith open("input.txt", "r") as infile:for line in infile:print(line.strip('\n'))DATA 301: Data Analytics (5)Writing to a Text FileDATA 301: Data Analytics (6)Other File Methodsoutfile open("output.txt", "w")infile open("input.txt", "r")for n in range(1,11):outfile.write(str(n) "\n")# Check if a file is closedprint(infile.closed)# Falseoutfile.close()# Read all lines in the file into a listlines d)# True
DATA 301: Data Analytics (7)DATA 301: Data Analytics (8)Using csv Module to Process a CSV FileUse Split to Process a CSV Filewith open("data.csv", "r") as infile:for line in infile:line line.strip(" \n")fields line.split(",")for i in range(0,len(fields)):fields[i] fields[i].strip()print(fields)import csvwith open("data.csv", "r") as infile:csvfile csv.reader(infile)for row in csvfile:if int(row[0]) 1:print(row)DATA 301: Data Analytics (9)List all Files in a DirectoryDATA 301: Data Analytics (10)Python File I/O Question Question: How many of the following statements are TRUE?import osprint(os.listdir(".")) 1) A Python file is automatically closed for you. 2) If you use the with syntax, Python will close the file for you. 3) To read from a file, use w when opening a file. 4) The read() method will read the entire file into a string. 5) You can use a for loop to iterate through all lines in a file. A) 0B) 1C) 2DATA 301: Data Analytics (11)Try it: Python Files Question 1: Write a Python program that writes to the file test.txtthe numbers from 20 to 10 in descending order. Question 2: Write a Python program that reads your newly createdtest.txt file line by line and only prints out the value if it is even. Question 3: Print out the contents of the CSV census file 1/notes/code/data/province population.csv Try to print out only the provinces with population 1 million people and onlythe 2015 data. You will need to use float() and remove commas in data.D) 3E) 4DATA 301: Data Analytics (12)Internet Terminology Basics An Internet Protocol (IP) address is an identifier for a computer on theInternet. IP version 4 (IPv4) address is 4 numbers in the range of 0 to 255. The numbersare separated by dots. Example: 142.255.0.1 IP version 6 (IPv6) address has 16 numbers from 0 to 255 represented inhexadecimal. Example: 2002:CE57:25A2:0000:0000:0000:CE57:25A2 A domain name is a text name for computer(s) that are easier toremember. A domain is a related group of networked computers. Domain names are organized hierarchically. The most general part of thehierarchy is at the end of the name. Example: people.ok.ubc.ca ca – Canadian domain, ubc – University of British Columbia, ok – Okanagan campus,people – name of computer/server on campus
DATA 301: Data Analytics (13)Internet Terminology Basics (2) A uniform resource locator (URL) is an address of an item on theInternet. A URL has three parts:DATA 301: Data Analytics (14)Accessing (GET) Web Sites via URL with Pythonimport urllib.requestloc "http://people.ok.ubc.ca/rlawrenc/teaching/301" Protocol: http:// ‐ Hypertext Transfer Protocol Tells the computer how to handle the file Server computer’s domain name or IP address Item's path and name: Tells the server which item (file, page, resource) is requested and where to find it. Example:site urllib.request.urlopen(loc)contents e.ok.ubc.ca/rlawrenc/teaching/301/index.htmlhttp protocol server domain namelocation of file/resource on serverDATA 301: Data Analytics (15)DATA 301: Data Analytics (16)Sending Data (PUT) to URL with PythonGoogle Search with Pythonimport urlliburl "http://www.google.com/search?hl en&q data analysis"headers {'User-Agent':'Mozilla/5.0 (Windows NT 6.1)'}request urllib.request.Request(url,None,headers)response urllib.request.urlopen(request)data response.read()data data.decode()# Convert from Unicode to ASCIIprint(data)request.close()import urllib.parseimport urllib.requesturl State.jsp'headers {'User-Agent':'Mozilla/5.0 (Windows NT 6.1)'}# Build and encode datavalues {'country' : 'US'}data urllib.parse.urlencode(values)data data.encode('ascii')req urllib.request.Request(url, data, headers)with urllib.request.urlopen(req) as response:page response.read()print(page)DATA 301: Data Analytics (17)Try it: Python URLsPython Web/URL Question Question: How many of the following statements are TRUE? 1) An IPv4 address has 4 numbers between 0 and 256 inclusive. 2) A domain name is hierarchical with most specific part at the end. 3) Typically, a URL will reference more than one resource/item. 4) Python uses the file module for accessing URLs. A) 0B) 1C) 2DATA 301: Data Analytics (18)D) 3E) 4 Question 1: Write a Python program that connects to any web pageand prints its contents. Question 2: Write a Python program that connects to: es/code/data/province population.csv and outputs the CSV data. Modify your program to print each province and its 2015 population indescending sorted order.
DATA 301: Data Analytics (19)Handling Errors and Exceptions An exception is an error situation that must be handled or theprogram will fail. Exception handling is how your program deals with these errors.The try-except Statement The try-except statement will handle an exception that may occurin a block of statements: Execution flow: Examples: DATA 301: Data Analytics (20)Attempting to divide by zeroAn array index that is out of boundsA specified file that could not be foundA requested I/O operation that could not be completed normallyAttempting to follow a null or invalid referenceAttempting to execute an operation that violates some kind of security measure The statements in the try block are executed. If no exception occurs: If there is an else clause, it is executed. Continue on with next statement after try. If an exception occurs: Execute the code after the except. If the optional finally block is present, it is always executed regardless ifthere is an exception or not. Keyword pass is used if any block has no statements.DATA 301: Data Analytics (21)DATA 301: Data Analytics (22)Question: ExceptionsPython Exceptions Exampletry:num int(input("Enter a number:"))print("You entered:",num)except ValueError:print("Error: Invalid number")else:print("Thank you for the number")finally:print("Always do finally block")try blockexit if erroronly executeif exceptiononly execute ifno exceptionalwaysexecute Question: What is the output of the following code if enter 10?A) 10try:num int(input("Enter num:"))B) 10print(num)C) Invalidexcept ValueError:print("Invalid")D) ")DATA 301: Data Analytics (23)Question: Exceptions (2) Question: What is the output of the following code if enter hat?A) hattry:num int(input("Enter num:"))B) Invalidprint(num)C) Invalidexcept ValueError:Finallyprint("Invalid")else:D) hatprint("Thanks")Thanksprint("Finally")FinallyE) FinallyE) 10ThanksFinallyDATA 301: Data Analytics (24)Try it: Python Exceptions Question: Write a Python program that reads two numbers andconverts them to integers, prints both numbers, and then divides thefirst number by the second number and prints the result. If get an exception ValueError when converting to an integer, printInvalid. If get a ZeroDivisionError, print Cannot divide by 0!
DATA 301: Data Analytics (25)Python Modules A Python module or library is code written by others for a specificpurpose. Whenever coding, make sure to look for modules that arealready written for you to make your development faster! Modules are imported using the import command:import modulename Useful modules for data analytics: Biopython (bioinformatics), NumPy (scientific computing/linear algebra), scikit‐learn (machine learning), pandas (data structures), BeautifulSoup (HTML/Web)DATA 301: Data Analytics (26)Biopython Biopython (http://biopython.org ) is a Python library for biological andbioinformatics computation. Features: parsers for bioinformatics file formats (BLAST, Clustalw, FASTA, Genbank)access to online services (NCBI ‐ National Center for Biotechnology Information)sequence classclustering/classification (k Nearest Neighbors, Naïve Bayes, Support VectorMachines) Integration with BioSQL (sequence database schema)DATA 301: Data Analytics (27)Biopython InstallationDATA 301: Data Analytics (28)Biopython Example ‐ Using Sequences Install in Anaconda by:# Create a sequence as a stringfrom Bio.Seq import Seqmy seq Seq("AGTACACTGGT")print(my seq) conda install biopython Check if successfully installed and current version by: import Bio# Read a FASTA file and print sequence infofrom Bio import SeqIOfor seq record in SeqIO.parse("sequence.fasta", "fasta"):print(seq record.id)print(repr(seq record.seq))print(len(seq record))print(seq record.seq.complement()) print(Bio. version )DATA 301: Data Analytics (29)Biopython Transcription Example# Transcriptionfrom Bio.Seq import Seqfrom Bio.Alphabet import IUPACcoding dna Seq("TGCATTGGGTGCTGA",IUPAC.unambiguous dna)template dna coding dna.reverse complement()messenger rna coding dna.transcribe()print("Coding:",coding dna)print("Template:",template dna)print("Messenger RNA:",messenger rna)print("Translation: ",messenger rna.translate())DATA 301: Data Analytics (30)Biopython ‐ Entrez Database Search Entrez is a federated database enabling retrieval of data from manyhealth sciences databases hosted by the NCBI.# Retrieve data from nucleotide database as FASTAfrom Bio import Entrezfrom Bio import SeqIOEntrez.email "test@test.com"# Providing GI for single entry lookuphandle Entrez.efetch(db "nucleotide", rettype "fasta",retmode "text", id "3288717")record SeqIO.read(handle, "fasta")handle.close()print(record)
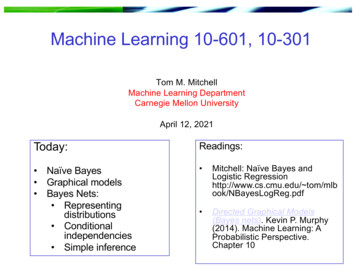
DATA 301: Data Analytics (31)Biopython ‐ BLAST BLAST (Basic Local Alignment Search Tool) compares an inputsequence with database and returns similar sequences.http://blast.ncbi.nlm.nih.gov/# Retrieve data from nucleotide database as FASTAfrom Bio.Blast import NCBIWWWfrom Bio.Blast import NCBIXMLsequence "ACTATTCCAAACAGCTCATAACCAGAAA"handle NCBIWWW.qblast("blastn", "nt", sequence)result handle.read()print(result)# Output is in XML formatDATA 301: Data Analytics (32)Biopython BLAST ‐ Parsing Resultsfrom Bio.Blast import NCBIWWWfrom Bio.Blast import NCBIXMLsequence "ACTATTCCAAACAGCTCATAACCAGAAA"handle NCBIWWW.qblast("blastn", "nt", sequence)records NCBIXML.parse(handle)record next(records)for alignment in record.alignments:for hsp in alignment.hsps:print('\nsequence:', alignment.title)print('length:', alignment.length)print('e value:', hsp.expect)print(hsp.query[0:75] '.')print(hsp.match[0:75] '.')print(hsp.sbjct[0:75] '.')DATA 301: Data Analytics (33)Try it: Biopython Question: Write a program that has a DNA sequence that you create,performs a BLAST, and then outputs the top 3 hits.DATA 301: Data Analytics (34)Charts There are numerous graphing and chart libraries for Python: matplotlib (http://matplotlib.org/) ‐ foundational 2D plotting libraryggplot (http://ggplot.yhathq.com/) ‐ based on R's ggplot2pygal ‐ dynamic chart libraryBokeh (http://bokeh.pydata.org/) ‐ goal is to produce charts similar to D3.js forbrowsers Seaborn (http://stanford.edu/ mwaskom/software/seaborn/) ‐ based onmatplotlib and designed for statistical graphicsDATA 301: Data Analytics (35)matplotlib ‐ Bar Chart ExampleDATA 301: Data Analytics (36)matplotlib ‐ Bar Chart Example (2)%matplotlib inlineimport matplotlib.pyplot as pltimport numpy as nprects2 plt.bar(index bar width, data2, bar width,alpha opacity, color 'r', yerr None,error kw error config, label 'Cats')data1 [25,45,35,20]data2 [35,40,25,30]index np.arange(len(data1))bar width 0.35opacity 0.4error config {'ecolor': '0.3'}rects1 plt.bar(index, data1, bar width, alpha opacity,color 'b', yerr None, error kw error config,label itle('Dogs versus Cats')plt.xticks(index bar width, ('1', '2', '3', '4'))plt.legend()plt.tight layout()plt.show()
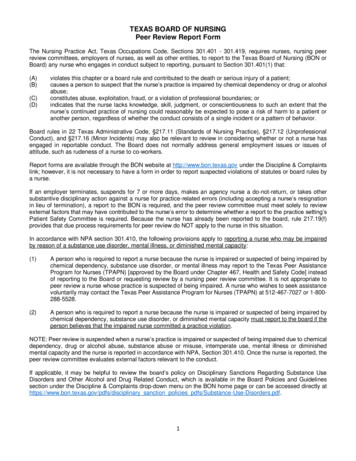
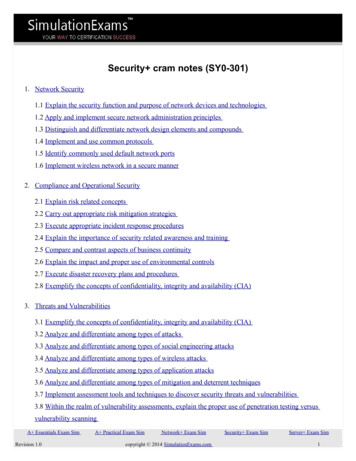
DATA 301: Data Analytics (37)matplotlib ‐ Histogram ExampleDATA 301: Data Analytics (38)matplotlib ‐ Histogram Example #2%matplotlib inlineimport numpy as npimport matplotlib.mlab as mlabimport matplotlib.pyplot as pltmu 100sigma 15x mu sigma*np.random.randn(10000)num bins 50n, bins, patches plt.hist(x, num bins,normed 1, facecolor 'green',alpha 0.5)y mlab.normpdf(bins, mu, sigma)plt.plot(bins, y, 'r--')Note: Set normed 0 to show countsplt.xlabel('Smarts')rather than 'Histogram of IQ: \mu 100 , \sigma 15 ')plt.subplots adjust(left 0.15)plt.show()import numpy as npimport matplotlib.pyplot as pltnum bins 5x [5, 3, 8, 5, 2, 7, 2, 4, 6, 2]n, bins, patches plt.hist(x, num bins,normed False, facecolor 'blue',alpha le('Histogram')plt.show()DATA 301: Data Analytics (39)Try it: Charts Question: Write a program to create a bar chart for this data: series1 [40, 50, 60, 70, 80] series2 [70, 50, 40, 90, 30]Output:DATA 301: Data Analytics (40)SciPy SciPy is group of Python libraries for scientific computing: NumPy (http://www.numpy.org/) ‐ N‐dimensional arrays, integrating C/C andFortran code, linear algebra, Fourier transform, and random numbers SciPy (http://www.scipy.org/) ‐ numerical integration and optimization matplotlib (http://matplotlib.org/) ‐ 2D plotting library IPython (http://ipython.org/) ‐ interactive console (Jupyter) Sympy (http://www.sympy.org/) ‐ symbolic mathematics (equations, calculus,statistics, combinatorics, cryptography) pandas (http://pandas.pydata.org/) ‐ data structures, reading/writing data, datamerging/joining/slicing/grouping, time seriesDATA 301: Data Analytics (41)SciPy Linear Regression Examplefrom scipy import statsimport numpy as npimport matplotlib.pyplot as pltx np.array([5, 7, 9, 11, 13, 15])y np.array([11, 14, 20, 24, 29, 31])slope, intercept, r value, p value,slope std error stats.linregress(x, y)predict y intercept slope * xprint("Predicted y-values:",predict y)pred error y - predict yprint("Prediction error:",pred error)degr freedom len(x) - 2residual std error np.sqrt(np.sum(pred error**2) / degr freedom)print("Residual error:",residual std error)plt.plot(x, y, 'o')plt.plot(x, predict y, 'k-')plt.show()DATA 301: Data Analytics (42)SciPy k‐Means Clustering Example%matplotlib inlineimport matplotlib.pyplot as pltfrom scipy.cluster.vq import kmeans,vqimport random as rnd# data generationdata []for i in range(0,100):data.append([rnd.random(), rnd.random()])# Perform k-means clusteringnumclusters 2centroids, kmeans(data,numclusters) # Calculates centroidsidx, vq(data,centroids)# Puts each point in a cluster
DATA 301: Data Analytics (43)DATA 301: Data Analytics (44)Try it: SciPySciPy k‐Means Clustering Example (2) Question: Write a program that uses SciPy to perform a linearregression on this data set:# Move data into individual lists based on clusteringclusters []for i in range(0, numclusters):clusters.append([[],[]]) x [1, 5, 10, 15, 20, 25] y [-1, -12, -26, -40, -60, -73]for i in range(0,len(idx)):clusterIdx usters[clusterIdx][1].append(data[i][1]) Output:# Plot data points and cluster troids[:,0],centroids[:,1],'sg',markersize 8)plt.show()DATA 301: Data Analytics (45)scikit‐learn Library scikit‐learn (http://scikit‐learn.org/) is a machine learning library forPython.DATA 301: Data Analytics (46)BeautifulSoup Library BeautifulSoup (http://www.crummy.com/software/BeautifulSoup/) isa library to make it easy to search, navigate, and extract data fromHTML and XML documents. Features: classification, regression, clustering, dimensionalityreductionDATA 301: Data Analytics (47)Databases Python can connect to databases to retrieve data. MySQL example:import mysql.connectortry:cnx mysql.connector.connect(user 'rlawrenc', password 'test',host 'cosc304.ok.ubc.ca', database 'WorksOn')cursor cnx.cursor()query ("SELECT eno, ename, salary FROM Emp WHERE title %s " "and salary %s")cursor.execute(query, ('EE', 50000))for (eno, ename, salary) in cursor:print(eno, ename, salary)cursor.close()except mysql.connector.Error as err:print(err)finally:cnx.close()DATA 301: Data Analytics (48)Try it: Databases Question: Write a program that queries the WorksOn database andreturns the employees grouped by title where the employee name isafter 'J'. The output should display their title and the average salaryfor that title. Connection info: cnx mysql.connector.connect(user 'rlawrenc',password 'test', host 'cosc304.ok.ubc.ca',database 'WorksOn') Output:
DATA 301: Data Analytics (49)Map‐Reduce Map‐Reduce is a technique for processing large data sets in afunctional manner. The technique was invented by Google and is implemented in a variety of systemsincluding Python, NoSQL databases, and a Big Data system called Hadoop. In Hadoop, map takes as input key‐value pairs and outputs key‐value pairs. Theshuffle step will move pairs to particular machines based on keys. The reducestep takes a list of key‐value pairs (with same key) and reduces to one value. It is possible to code map/reduce functions in Python for use in Hadoop cluster. Simpler version of Map‐Reduce in Python without a cluster: Map function ‐ takes as input a list and a function then applies function to eachelement of the list to produce a new list as output Filter function ‐ only keeps list elements where filter function is True Reduce function ‐ takes result of map/filter and produces single value from listDATA 301: Data Analytics (50)Python Map‐Reduce Exampleimport functools# For Reducedata [1, 2, 3, 4, 5, 6]# Map functiondef triple(x):return x*3# Filter functiondef myfilter(x):if x % 2 0:return Truereturn False# Reduce functiondef sum(x, y):return x yDATA 301: Data Analytics (51)DATA 301: Data Analytics (52)Try it: Map‐ReducePython Map‐Reduce Example (2) Question: Write a map‐reduce program that during the map step willsubtract 2 from each element. The reduce step should return theproduct of all the elements in the list.result list(map(triple, data))print("Result after map:",result)result list(filter(myfilter, result))print("Result after filter:",result)result functools.reduce(sum, result)print("Result after reduce:",result)DATA 301: Data Analytics (53)Conclusion Python has many libraries to help with data analysis tasks: reading and write to filescsv module for processing CSV filesBiopython for bioinformaticsnumerous chart libraries including matplotlib and ggplotSciPy ‐ collection of libraries for scientific computinglibraries for web access and parsing (BeautifulSoup)database access libraries and connectors The try-except statement is used to handle exceptions so that theprogram may continue when an error condition occurs.DATA 301: Data Analytics (54)Objectives Open, read, write, and close text filesProcess CSV files including using the csv moduleDefine: IPv4/IPv6 address, domain, domain name, URLRead URLs using urllib.request.Define: exception, exception handlingUse try-except statement to handle exceptions and understand how each oftry, except, else, finally blocks are usedImport Python modulesUse Biopython module to retrieve NCBI data and perform BLASTBuild charts using matplotlibPerform linear regression and k‐means clustering using SciPyConnect to and query the MySQL database using PythonWrite simple Map‐Reduce programs
4) Python uses the file module for accessing URLs. A) 0 B)1 C)2 D)3 E)4 DATA 301: Data Analytics (18) Try it: Python URLs Question 1:Write a Python program that connects to any web page and prints its contents. Question 2:Write a Python program that connects to: