Transcription
Labor force statusof Vietnam-era veteransSpecial survey confirms labor marketdifficulties of men who servedin Southeast Asia, especially thosewith service-connected disabilitiesSHARON R. COHANYA decade after the war's end, the labor force status ofVietnam-era veterans is generally quite similar to that ofnonveterans . There are exceptions, however. Those whoserved in the Vietnam theater (Vietnam, Laos, and Cambodia and the surrounding airspace and waters), and mostparticularly those who received disabling injuries from combat and other causes, have higher unemployment rates andlower labor force participation rates than their peers.In 1985, data were collected for the first time on the laborforce status of men who actually served in Southeast Asia,distinguishing between those with and without serviceconnected disabilities . The data confirm the precarious circumstances of disabled veterans, who are especially vulnerable to unemployment .The information is from the Current Population Survey(cps), a monthly survey of about 59,500 households conducted and tabulated by the U.S . Census Bureau for theBureau of Labor Statistics . In a supplement to the April 1985survey, men 18 years and older were asked about theirservice in the Armed Forces and whether they had a serviceconnected disability .' (See appendix for information on thetypes of questions asked .) The supplement was cosponsoredSharon R. Cohany is an economist in the Division of Labor Force Statistics,Office of Employment and Unemployment Analysis, Bureau of LaborStatistics . Earl F. Mellor, an economist in the same division, prepared theappendix .by the Veterans Administration (VA) and two Department ofLabor agencies-the Veterans Employment and TrainingService and the BLS .zOverall pictureOur Nation's 26 .2 million male veterans account fornearly one-third of all men 18 years and older . The 7.9million Vietnam-era veterans are the youngest wartime participants and the second largest veterans' group, exceededonly by the 9 .7 million veterans of World War 11 .3 About2 .4 million veterans, or 9 percent, have a service-connecteddisability . Most served during wartime, with nearly 800,000having served during the Vietnam era.In this study, the Vietnam-era veterans are those men whoserved in the Armed Forces anywhere during the Nation'slongest war, from August 1964 to April 1975, and who arecurrently in the civilian noninstitutional population . Only 46percent of these veterans actually served in the Vietnamtheater of operations . The age distribution of veterans of theVietnam era is relatively concentrated, with two-thirds between ages 35 and 44 in April 1985 . Indeed, one-half werebetween ages 35 and 39 . (Because of the aging of the population, there were no longer any Vietnam-era veterans underage 25 .) The following tabulation shows the age distributionof Vietnam-theater and other Vietnam-era veterans and nonveterans in the civilian noninstitutional population in April1985 .11
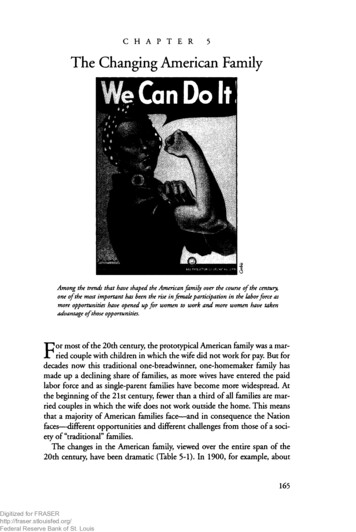
MONTHLY LABOR REVIEWFebruary 1987 "Labor Force Status of Vietnam-Era VeteransVeteransVietnamtheaterOtherVietnam eraNonveteransNumber (thousands) . . . .3,6724,26054,435Percent . . . . . . . . . . . . . . .100 .0100 .0100 .025 to 34 years . . . . . . .15 .327 .931 .018 to 24 years . . . . . . .35 to 44 years . . .35 to 39 years .40 to 44 years .45 years and overTable 1 .00.68 .949 .619 .315 .800.59 .836 .623 .212 .2Many misperceptions surround the men who served during the Vietnam era. 4 For example, contrary to popularbelief, most were not drafted, but volunteered for militaryservice. In 1968, the year with the largest number on activeduty, just 40 percent of all enlisted new entrants weredraftees .' Another myth is that minorities constituted a dis-proportionate share of our military forces .,In fact blacks2399.make up 9 percent of Vietnam-era veterans (11 percent ofVietnam-theater veterans), and Hispanics account for 4 percent of these veterans . The black share of the adult malepopulation is about 10 percent, and the Hispanic share is6 percen t .16 .88 .97.928 .3Employment status of men 18 years and over, by veteran status and age, April 1985, not seasonally adjusted(Numbers in thousands)Ctvllian labor forceCiviliannoninstitutlonalVeteran status and ageUnemployedpopulationTotalPercen t ofpopulationEmployedTotal, 18 years and over . . . . . . . . . . . . . . .18 to 24 . . . . . . . . . . . . . . . . . . . . . . . . .26,15337819,52434074 .789 .935 to 44 . . . . . . . . . . . . . . . . . . . . . . . . .45 and over . . . . . . . . . . . . . . . . . . . . . .5,97716,8655,76110,6537,932(1)7,44935 to 44 . . . . . . . . . . . . . . . . . . . . . .45 and over . . . . . . . . . . . . . . . . . . .5,0781,1014,895877Vietnam theater :Total, 18 years and over . . . . . . . . .3,6723,383Veterans25 to 34 . . . . . . . . . . . . . . . . . . . . . . . . .Vietnam era:Total, 18 years and over . . . . . . . . . . .18 to 24 . . . . . . . . . . . . . . . . . . . . . .25 to 34 . . . . . . . . . . . . . . . . . . . . . .18 to 24 . . . . . . . . . . . . . . . . . . . .25 to 34 . . . . . . . . . . . . . . . . . . . .35 to 44 . . . . . . . . . . . . . . . . . . . .45 and over . . . . . . . . . . . . . . . . .Other Vietnam era :Total, 18 years and over . . . . . . . . .18253545to 24 . . .to 34 . . .to 44 . . .and over. . . . .Other war periods:Total, 18 years and over . . . . . . . . . . .18 to 24 . . . . . . . . . . . . . . . . . . . . . .25 to 34 . . . . . . . . . . . . . . . . . . . . . .35 to 44 . . . . .45 and over . .45 to 5455 to 64 . . .65 and over. . . . . . . . . . . . . .Other service periods:Total, 18 years and over . . . . . . . . . . .18 to 24 . . . . . . . . . . . . . . . . . . . . . .25 to 34 . . . . . . . . . . . . . . . . . . . . . .35 to 44 . . . . . . . . . . . . . . . . . . . . . .45 and over . . . . . . . . . . . . . . . . . . .NonveteransTotal, 18 years and over . . . . . . . . . . . . . . .18253545to 24 . . .to 34 . . .to 44 . . .and over. . . umber18,4492801,075605.517.76,6293896 .463 .25,44310,2123184405.54.12166,21293 .9(1)7,0036.0(1)48396 .479 .74,6308525.42.81832246.72883.113094 .42,51595 .7(1)1,52292 .13,158(1)94 .795 .077 .495 .4(1)96 .197 .882 6525225(1)61151149.29.3(1)11 11(1)46559413,666(1)1117,784(1)(1)57 118 .876229P 3.73,424(1)h)7,7842,3984,59511157 .089.767.84,5553781,1804,2913401,09394 .289 .992 .64,0102809932826010054,43542,72478 529,16515,3848661,99210,09715,9328,6398,054' Because of the aging of the population, there were no longer any Vietnam-eraveterans under age 25 or any other war veterans under age 45 .12for laborpercent oflabor force96 .394 .977 .594 .594 .352 2752,1836.617.79.226438877.511,7126.13.511 .96.75.45.5331062,9379205267,330
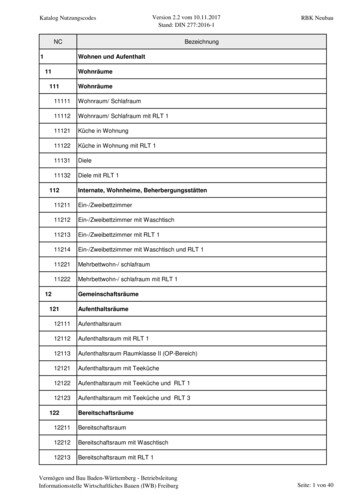
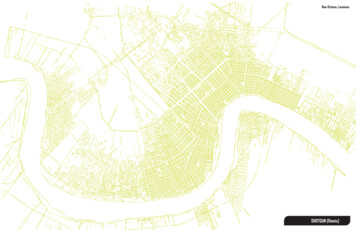
Table 2. Employment status of male Vietnam-era veterans, by race and Hispanic origin, April 1985, not seasonally adjusted(Numbers in thousands)Civilian labor forceCiviliannoninsthutionalpopulationTotalPercent ,72493 .992 .195 .478 .57,0033,1583,84539,5384452252203,1856 .06 .75 .47 .548328819511,7127,0846,66094 .06,3263355 .04243,89246,4683,71436,84995 .479 .33,53934,5041742,3454 .76 .41789,619Vietnam-era veterans . . . . . . . . . . . . . . . . .Vietnam theater . . . . . . . . . . . . . . . . . . .72441167837993 .692 .2588325905413 .214 .14632Nonveterans . . . . . . . . . . . . . . . . . . . . . . .6,1004,44472 .93,72571916 .21,656Vietnam-era veterans . . . . . . . . . . . . . . . . .35634195 .8312298 .615Other Vietnam era . . . . . . . . . . . . . . . . .Nonveterans . . . . . . . . . . . . . . . . . . . . . . .1954,5751923,75998 .582 .21723,3882037110.49.94816Veteran status, race,and Hispanic originUnemployed NumberPercent ofNot In laborforcelabor forceTotalVietnam-era veteransVietnam theater . .Other Vietnam eraNonveterans . . . . . . . . . . . . . . . . . . .whiteVietnam-era veterans . . . . . . . . . . . . . . . . .Vietnam theater . . . . . . . . . . . . . . . . . . .Other Vietnam era . . . . . . . . . . . . . . . .Nonveterans . . . . . . . . . . . . . . . . . . . . . . .BlackOther Vietnam era . . . . . . . . . . . . . . . . .3,1933122,94729992 .395 .82,786263161365.412 .124613Hispanic originVietnam theater . . . . . . . . . . . . . . . . . . .16115093 .214096.311NOTE: Detail for the race and Hispanic-origin groups will riot sum to totals because data for the"other races" group are not presented and Hispanics are included in both the white and black population groups .Men who served in Southeast Asia accounted for twothirds of the nearly 800,000 Vietnam-era veterans who reported a service-connected disability . Their disability israted from 0 to 100 percent, representing the "average impairment in earning capacity" in civilian occupations resulting from diseases and injuries caused or aggravated by military service .' About half had disability ratings of less than30 percent.Labor forceVeterans of the Vietnam era are now in their prime working ages, and 7.5 million of a total of 7.9 million were in thelabor force in April 1985 . Being a large segment of theirgeneration, they account for more than 1 of 4 men in thelabor force between the ages of 30 and 44 . With a 94percent participation rate, Vietnam-era veterans were aslikely as their nonveteran peers to be in the labor force. (Seetable 1 .) Those who served in the Vietnam theater weresomewhat less likely to be labor force participants than otherveterans of that period (92 versus 95 percent), in part because a larger proportion had service-connected disabilities .Black and Hispanic veterans were as likely to be in the laborforce as whites, in contrast to the situation for nonveterans,among whom blacks have lower participation rates thanwhites and Hispanics. (See table 2.)For disabled Vietnam-era veterans, labor force participation varied widely, depending on the degree of disability .Those with disability ratings of less than 30 percent werenearly as likely to be in the labor force as those with nodisability . However, the participation rate was only 35 percent for those reporting disability ratings of 60 percent orhigher . (See table 3 .) Disabled veterans of the Vietnamtheater were about as likely to be labor force participants asdisabled veterans who had served elsewhere .Of course, the existence of other sources of income caninfluence the veteran's decision to seek employment . Mostdisabled veterans as defined in this report received regularmonthly compensation through the VA or Department ofDefense. Based on the extent of the reduced capacity towork, VA payments range from under 100 to around 4,000per month .7 For instance, a veteran whose only serviceconnected injury was the loss of the use of part of a fingeror toe may be eligible to receive 70 per month . At the otherextreme, a veteran whose military service resulted inquadriplegia may be entitled to around 4,000 (includingthe maximum allowance for dependents) .UnemploymentThe unemployment rate for Vietnam-era veterans was 6.0percent in April 1985 . Altogether, almost 450,000 of themen were looking for work . Those who actually served inSoutheast Asia were more likely to be unemployed thanother Vietnam-era veterans, 6.7 percent compared with 5 .4percent . This was partly the result of their higher incidenceof disability and also of factors which predated their militaryservice. For instance, men in the Vietnam theater had, onaverage, less education and were from poorer families thanother veterans of the same era. 8 Hence, they were already at13
MONTHLY LABOR REVIEWFebruary 1987 9Labor Force Status of Vietnam-Era Veteransa greater risk in terms of joblessness . A 1980 survey ofveterans identified "finding a job" as their biggest problem,but less than one-half attributed their difficulties to militaryservice.9The jobless rate for disabled Vietnam-era veterans, at 8.1percent, was much higher than that for those without disability (5 .6 percent) . Disabled veterans who served in SoutheastAsia were more likely to be unemployed than other disabledVietnam-era veterans (9 .2 versus 5.6 percent) . Of the former, those with disability ratings of 30 to 50 percent had aparticularly high jobless rate-16.0 percent.The jobless rate for black Vietnam-era veterans was substantially higher than that for their white and Hispanic counterparts, regardless of the theater of service. The rate forblack veterans averaged 22 to 3 times that for the whites,about the same relationship as in the general population .However, black and Hispanic veterans, like other veterans,had a lower jobless rate than their nonveteran counterparts .Two-thirds of the jobless Vietnam-era veterans were reentrants, a very high proportion, indicating more frequentbreaks from the labor force for veterans than for men whonever served in the Armed Forces . Almost none of theveterans were new entrants to the civilian labor force.The median length of joblessness for Vietnam-era veter-ans was 9.3 weeks, about 3 weeks less than the duration forall men 25 years and over . Those who .served .imSoutheastAsia were unemployed for a shorter time than were thosewho served outside the war zone . The men who served inthe Vietnam theater were also less likely to be among thelong-term unemployed (15 weeks and longer) .EmploymentBoth public and private sector employers have had various incentives to hire the Vietnam-era veteran. Many largeemployers, most notably the Federal, State, and local governments, give veterans preference in hiring, usually byadding points to their score on a competitive civil serviceexam . Public job service agencies in each State provideveterans with special assistance and counseling and havegiven them priority in referrals to job openings with Federalcontractors . The Department of Labor sponsors training programs, as does the Department of Defense . The Labor Department also has responsibility for enforcing veterans' reemployment rights . Many of these services were firmly inplace well before the war's end .10More than 18 million veterans were employed at the timethe survey was taken, including 7 million from the Vietnamperiod . While the most recent wartime veterans were aboutTable 3. Employment status of male Vietnam-era veterans, by presence of service-connected disability and reporteddisability rating, April 1985, not seasonally adjusted(Numbers in thousands)Civilian labor ptlapopulationEmployedTotal, 18 years and over . . . . . . . . . . . . . . .With service-Connected disability . . . . . . .7,9327717,44961693 .979 .97,0035664455060-percent or higher disability rating . .Disability rating not reported . . . . . . . .11963415834 .5(t)41563Presence andrating of disabllbyVietnam-era veteransLess than 30-percent disability rating . .30- to 50-percent disability rating . . . . .Without service-connected disability . . . .Presence of disability rat reported . . . . .3981903671516,8583026,570264Total, 18 years and over . . . . . . . . . . . . . . .3,67230- to 50-percent disability rating . . . . .60-percent or higher disability rating . .1377892 .279 .5Unemployed337133NumberPercent oflabor forceNot in laborforce6.08.1483156(r)(t)78729188.011 .9314095.887 .46,201236368275 .610 .3289393,38392.13,1582256 .72881063077.438.5893017-16 .0(1)3048118 .7Vietnam MresterWith service-connected disability . . . . . . .Less than 30-percent disability rating . .Disability rating rat reported . . . . . . . .Without service-connected disability . . . 04362,842Total, 18 years and over . . . . . . . . . . . . . . .With service-connected disability . . . . . . .4,2602564,06519995.477.73,845188Disability rating not reported . . . . . . . .Without service-connected disability . . . .Presence of disability not reported . . . . .243,854150213,727139(1)96.792.7213,535122Presence of disability not reported . . . . .153125381981 .71149.27 .89916(1)6.24162220115 .45 .61955719216(1)(1)5 .211 .831271128Other Vietnam eraLess than 30-percent disability rating . .30- to 50-percent disability rating . . . . .60-percent or higher disability rating . .t Data not shown where base is less than 75,000 .NoTE:14Dash indicates fewer than 500 persons.1385441123441189.1(t)(1)112441110-8 .5(1)15930
as likely to be working as their nonveteran peers, there weredifferences in the types and settings of employment ., Perhaps the most striking of these is the large proportion, particularly among the disabled, who were working in the public sector and in the Federal Government in particular .About 20 percent of the Vietnam-era veterans held publicsector jobs, compared with 11 percent of nonveterans .Those men who actually served in the Vietnam theater weresomewhat more likely to be public employees than otherveterans of the same period . Black and Hispanic veteranswere even more apt to be public sector employees than werewhites . The following tabulation shows the percent of employed veterans who were wage and salary workers in private industry (excluding the self-employed and unpaid family workers) and in government in April 1985 :Vietnam era . . . . . . . . . . . . . . .Disabled . . . . . . . . . . . . . . . .Not disabled . . . . . . . . . . . . .Vietnam theater . . . . . . . . . .Disabled . . . . . . . . . . . . . .Not disabled . . . . . . . . . . .Other Vietnam era . . . . . . . .Disabled . . . . . . . . . . . . . .Not disabled . . . . . . . . . . .GovernmentPrivateindustryTotalFederal70 .220 .38.619 .858 .171 .169 .358 .570 .671 .057 .471 .533 .019 .421 .733 .320.419 .231 .918 .67 .79 .518 .88.47 .921 .87 .2Among disabled Vietnam-era veterans with jobs, onethird were in the public sector, with about 1 of 5 employedby the Federal Government . This reflects several factors,including special hiring preferences given to the disabledveteran (in addition to preferences given to all who servedwhen the Nation was at war), special retention rights duringreductions in force, and perhaps an unusually strong commitment on the part of Federal agencies to hire handicappedworkers in general . 1 1Veterans of the Vietnam period were about as likely to beself-employed as other men their age . Disabled Vietnam-eraveterans were somewhat less likely to be self-employed thanother veterans .The average length of the workweek for Vietnam-eraveterans, at 45 hours, was about the same as that for adultmen in general, and varied little on the basis of theater ofservice or disability . However, disabled veterans were morelikely to work part time (less than 35 hours per week) thannondisabled veterans . Not surprisingly, disabled veteransreported more absenteeism than other veterans .Occupations .The role of education in occupational selection has beencritical for veterans . An estimated 70 percent of Vietnamera veterans returned to school after their military discharge, 13 the great majority taking advantage of veterans'educational benefits . t4 Despite this, veterans are less likelyto hold college and postgraduate degrees than their nonveteran peers, and this lower educational attainment is reflectedin the types of jobs they hold, on average. 15 In addition, theemployment situation of veterans cannot be viewed apartfrom the performance of the economy as a whole. Economicdislocations in recent years have limited the growth of bluecollar jobs in favor of managerial, professional, and technical positions, to the detriment of some veterans who left theservice with training and experience in craft, repair, andrelated fields .The Armed Forces provide certain trainingwhich is generally transferable to civilian jobs . While thereare some military specialties, such as infantry and guncrews, which have no civilian counterpart, jobs in management, repair, clerical, and craft specialties are similar tothose of civilians . 12Table 4 . Employed male Vietnam-era veterans and nonveterans by occupation and class of worker, April 1985,not seasonally adjusted(Percent 45100 .039,538100.027.525.529 .323.715.614.316 .712.0Technical, sales, andadministrative support . . . . . . . . .Technicians and related support .20.34.120 .04 .220 .64 .019.02 .7Administrative support, includingclerical . . . . . . . . . . . . . . . . . .6 .86 .66 .95 .37 .93 .94 .09 .25 .04 .17.03 .13.99 .52 .17 .423 .59 .47 .524 .59 .38 .522.79.56.620 .26 .97 .86.76.86.65.518 .418 .718.222 .17.27.27.38.57 .47.77 .27 .23.83.83.76.42.22.12 .45.5Wage and salary workers . . . . . . . .90.691 .090 .289.4Government . . . . . . . . . . . . . . . .Federal . . . . . . . . . . . . . . . . . .20.38.621 .79.519 .27 .911 .1hlOccupation and class of workerTotal, 18 years and over(in thousands) . . . . . . . . . . .Percent . . . . . . . . . . . . . . . . . .OccupationManagerial and professionalspecialty . . . . . . . . . . . . . . . . . . .Executive, administrative, andmanagerial . . . . . . . . . . . . . . .Professional specialty . . . . . . . . .Sales occupations . . . . . . . . . . .Service occupations . . . . . . . . . . . .Protective service . . . . . . . . . . . .Other service occupations . . . . . .Precision production, craft, andrepair . . . . . . . . . . . . . . . . . . . . . .Mechanics and repairers . . . . . . .Construction trades . . . . . . . . . . .Other precision production, craft,and repair . . . . . . . . . . . . . . . .Operators, fabricators, andlaborers . . . . . . . . . . . . . . . . . . . .Machine operators, assemblers,and inspectors . . . . . . . . . . . . .Transportation and materialmoving occupations . . . . . . . . .Handlers, equipment cleaners,helpers, and laborers . . . . . . . .Farming, forestry, and fishing . . . . .11 .99.511 .19.212 .69.711 .711 .0Class of workerPrivate . . . . . . . . . . . . . . . . . . . .State and local . . . . . . . . . . . .Self-employed and unpaid familyworkers . . . . . . . . . . . . . . . . . . . .70.211 .79.569.312.39.071 .011 .39.878.3Itl10.61 Data not available.15
MONTHLY LABOR REVIEWFebruary 1987 *Labor Force Status of Vietnam-Era VeteransVeterans who served in the Vietnam theater were lesslikely to hold managerial and professional positions thanothers of the same era, and more likely to hold skilled craftand protective service jobs . (See table 4.) DisabledVietnam-era veterans were more likely than their nondisabled counterparts to be professionals, clericals, and unskilled laborers, and less likely to be skilled craftworkersand machine operators. This followed the pattern of veterans of earlier wars, except that the older disabled veteranswere also more likely to be in sales.,The occupational distribution of black veterans variedfrom that of whites, paralleling the general situation. BlackVietnam-era veterans were less likely to be in managerialand professional positions and more likely to hold servicejobs than were whites . But they .were also less likely tooccupy unskilled and low paying laborer jobs and morelikely to hold lower level white-collar positions than nonvetBran blacks, indicating, perhaps, that military service confers a greater relative benefit to blacks than to whites .Out of the labor forceA small number of Vietnam-era veterans were not working or looking for work in April 1985. The majority of the480,000 veterans in this category reported that they wereretired, but ill health stemming from service injuries andillnesses also played a significant role in their labor forcestatus .-Black veterans were about as likely to be outside the laborforce as whites, a picture quite different from the populationas a whole, where blacks have a greater incidence of nonparticipation than whites .ElFOOTNOTESI Respondents to the April 1985 cps supplement were men only ; however, 1 million women were also veterans, including about 250,000 fromthe Vietnam era. For more information, see Female Veteran Population(Veterans Administration, 1984); and Maria L. Roca, "Women veteranstotal 1 million in first half of 1986," Monthly Labor Review, December1986, pp . 30-31 .2 Information from the April 1985 cps supplement was issued initially asnews release USDL 86-125, "BLS Issues First Time Study on DisabledVeterans," Mar. 31, 1986 . Historical data on Vietnam-era veterans arefound in Employment and Earnings, a monthly BLS publication, and TheEmployment Situation, a monthly BLS news release . For the latest article onthe subject, see John F. Stinson, Jr ., "Vietnam veterans in the labor marketof the 1970's," Monthly Labor Review, November 1979, pp . 3-11 .3 Statistical Abstract 1986 (Washington, U.S . Department of Commerce), p. 346.4 For a comparison of the attitudes of veterans, employers, and the publictoward the veterans, see Myth and Realities: A Study of Attitudes TowardVietnam Era Veterans, submitted by the Veterans Administration to theCommittee on Veterans' Affairs, U.S. House of Representatives, July 1980 .5 Statistical Abstract 1975 (Washington, U.S . Department of Commerce), p. 327 .6 Code of Federal Regulations, title 38 .7 Federal Benefits for Veterans and Dependents (Veterans Administra-APPENDIX :The estimates in this article are obtained from a supplement to the April 1985 Current Population Survey (cps).Special questions in this survey asked men 18 years andolder about their service in the Armed Forces and whetherthey had a service-connected disability . The cps, a monthlysurvey of about 59,500 occupied households, is conductedfor the Bureau of Labor Statistics by the Bureau of theCensus . It provides information on the employment status ofthe civilian noninstitutional population; the demographic,occupational, and other characteristics of the employed, theunemployed, and persons not in the labor force; and relateddata . The April 1985 survey was taken during the week ofthe 14th through the 20th and refers to the status of individ16tion, 1986), pp . 3-4 .s Legacies of Vietnam: Comparative Adjustment of Veteransand TheirPeers, a study preparedfor the Veterans Administration, submitted to theCommittee on Veterans' Affairs, U.S . House of Representatives, Mar. 9,1981, pp . 104-16 .9 Myths and Realities, pp . 108-19 .to See Elizabeth Waldman and Kathryn R. Gover, "Employment situation of Vietnam-era veterans," Monthly Labor Review, September 1971,pp . 3-11, for a discussion of programs and benefits for these veterans, aswell as a comparison of the job markets facing Vietnam, Korea, and WorldWar II veterans .11 See Veterans' Preference in FederalEmployment (Office of PersonnelManagement, 1985).12 See Carol Boyd Leon, "Working for Uncle Sam-a look at membersof the Armed Forces," Monthly Labor Review, July 1984, pp . 3-9 .13 Legacies of Vietnam, pp . 153-72 .14 The VA estimates that as of September 1985, 6 million Vietnam-eraveterans had received training under the Gi Bill, nearly two-thirds of themat the college level. For more information, see Veterans Benefits UnderCurrent Educational Programs, Fiscal Year 1985 (Veterans Administration).is Annual Report 1985 (Veterans Administration), p. 7.Notes on the datauals during the preceding week (7th through the 13th). Thedefinitions underlying the data in this article are as follows .Veteran status is provided from responses to the questions:Did you ever serve on active duty in the U.S. ArmedForces?When did you serve?Vietnam Era-Aug. 1964-Apt . 1975 .Korean War-June 1950-Jan . 1955 .World War II-Sept. 1940-July 1947World War IApr. 1917-Nov. 1918Other service-All other periods . . . .OOOOO
If the person served in more than one of the major conflicts, the most recent war period is marked . "Other service"is marked only if no time was served during one of the fourmajor conflicts . Vietnam-era veterans were asked this question to determine if service was actually in the Vietnamtheater:Did you serve in Vietnam, Laos, or Cambodia ; in thewaters in or around these countries; or fly missionsover these areas between August 1964 and April 1975?The presence of a service-connected disability is providedby the question :Has the Veterans Administration or the Department ofDefense determined that you have a service-connecteddisability, that is, a health condition or impairmentcaused or made worse by military service?The disability status must be determined by the VeteransAdministration or the Department of Defense. Selfdiagnosed or personal-physician-diagnosed disabilities arenot applicable . Service-connected disability ratings are determined from the question:What is your service-connected disability rating?Answers range from 0 to 100 percent. Disability ratingsare determined from a rating schedule published in theU.S . Code of Federal Regulations (title 38), "Pensions,Bonuses, and Veterans Relief," Part 4-"Schedule for Rating Disabilities ." The rating schedule is "primarily a guidein the evaluation of disability resulting from all types ofdiseases and injuries encountered as a result of or incidentto military service. The percentage ratings represent as faras can practicably be determined the average impairment inearning capacity resulting from such diseases and injuriesand their residual conditions in civil occupations ." Part 4lists hundreds of disorders by degree of severity and assignsa rating of 0 through 100 percent in steps
only by the 9.7 million veterans of World War 11.3 About 2.4 million veterans, or 9 percent, have a service-connected disability. Most served during wartime, with nearly 800,000 having served during the Vietnam era. In this study, the Vietnam-era veterans are those men who served in the Armed Forces anywhere during the Nation's