Transcription
Kularatna et al. Health and Quality of Life (2020) 18:115RESEARCHOpen AccessMapping the Minnesota living with heartfailure questionnaire (MLHFQ) to EQ-5D-5Lin patients with heart failureSanjeewa Kularatna1, Sameera Senanayake1*, Gang Chen2,3 and William Parsonage1,4AbstractBackground: Mapping algorithms can be used to convert scores from a non-preference based instrument tohealth state utilities. The objective of this study was to develop mapping algorithms which will enable theMinnesota Living with Heart Failure Questionnaire (MLHFQ) scores to be converted into EQ-5D-5L utility scores thatcan be used in heart failure related cost utility studies.Method: Patients diagnosed with heart failure were recruited from Australia. Mapping algorithms were developedusing both direct and indirect response mapping approach. Three model specifications were considered to predictthe EQ-5D-5 L utility score using MLHFQ total score (Model 1), MLHFQ domain scores (Model 2), or MLHFQ itemscores (Model 3). Six regression techniques, each of which has the capability to cope with either skewness,heteroscedasticity, ceiling effects and/or the potential presence of outliers in the data set were used to identify theoptimal mapping functions for each of the three models. Goodness-of-fit of the models were assessed using sixindicators. In the absence of an external validation dataset, predictive performance of was assessed using three-foldcross validation method. In the indirect response mapping, EQ. 5D 5 L responses were predicted separately usingthe MLHFQ item scores using ordered logit model.Results: A total of 141 patients participated in the study. The lowest mean absolute error (MAE) was recorded fromthe multivariable fractional polynomials (MFP) model in all three-model specifications. Regarding the indirectresponse mapping, results showed that the performance was comparable with the direct mapping approach basedon root mean squared error (RMSE) but was worse based on MAE.Conclusion: The MLHFQ can be mapped onto EQ-5D-5 L utilities with good predictive accuracy using both directand indirect response mapping techniques. The reported mapping algorithms would facilitate calculation of healthutility for economic evaluations related to heart failure.Keywords: Mapping, Minnesota Living with Heart Failure (MLHFQ), EQ-5D-5 L, Utility, Direct mapping, Indirectresponse mapping* Correspondence: sameerajayan.senanayake@hdr.qut.edu.au1Australian Centre for Health Service Innovation, School of Public Health andSocial Work, Institute of Health and Biomedical Innovation, QueenslandUniversity of Technology, 60 Musk Avenue, Kelvin Grove QLD, 4059, AustraliaFull list of author information is available at the end of the article The Author(s). 2020 Open Access This article is licensed under a Creative Commons Attribution 4.0 International License,which permits use, sharing, adaptation, distribution and reproduction in any medium or format, as long as you giveappropriate credit to the original author(s) and the source, provide a link to the Creative Commons licence, and indicate ifchanges were made. The images or other third party material in this article are included in the article's Creative Commonslicence, unless indicated otherwise in a credit line to the material. If material is not included in the article's Creative Commonslicence and your intended use is not permitted by statutory regulation or exceeds the permitted use, you will need to obtainpermission directly from the copyright holder. To view a copy of this licence, visit http://creativecommons.org/licenses/by/4.0/.The Creative Commons Public Domain Dedication waiver ) applies to thedata made available in this article, unless otherwise stated in a credit line to the data.
(2020) 18:115Page 2 of 12IntroductionCardiovascular disease (CVD) is one of the leadingcauses of death in the developed countries [1]. Heartfailure (HF) is the fastest growing CVD in the worldwhich poses a significant global burden, affecting nearly26 million people worldwide [2]. It is a chronic debilitating illness in which the symptoms worsen with progression of the disease. Disease progression is associatedwith significant impact to the physical and social wellbeing, increased hospitalization [3, 4] as well as increased mortality. It is estimated that over 61,000 (6.9per 1000 person-years) Australians aged 45 years arediagnosed with clinically over HF every year. Heart failure accounts for an estimated 150,000 hospitalisationsand over 1 million days in hospital per annum [5, 6] andposes a significant burden to the health budgets globally.It is estimated that 1–2% of total healthcare expenditures in Europe and North America is spent for thetreatment of HF [7]. In Australia, the annual cost ofmanaging HF in the community is approximately 900million and nearly 2.7 billion when considering theadditional cost of in-patient care [8].Economic evaluation presents evidence to inform comparative decisions, particularly about value for money. It isused by the regulatory agencies of Australia, United Kingdom and Switzerland in their evaluations of the costeffectiveness of new health interventions prior to funding.Cost-utility analysis (CUA) is one method of economicevaluation that has been used to inform resource allocation decisions [9]. In CUA, health benefits are usuallymeasured by quality-adjusted life-years (QALYs).QALYs incorporate both changes in life expectancyand quality of life in a single metric. Utility is the component of the QALY that accounts for the quality of lifewhich is measured using generic multi-attribute utilityinstruments (MAUIs) such as the EQ-5D or the SF-6D[10]. However, evidence indicate that the disease specificquality of life instruments are superior to generic instruments (eg. EQ-5D), owing to their superior sensitivity tochanges in quality of life [11–13]. However, most diseasespecific quality of life instruments are not preferencebased and cannot directly generate the utilities. Nonpreference base instruments are characterized by measuring, but not valuing health states. Currently there areno HF specific MAUIs available to estimate utility, thusgeneric instruments such as EQ-5D are widely used [14].In this context, mapping algorithms are of importance,as they can convert scores from a disease specific instrument to utilities. Mapping algorithms have been successfully developed to many disease specific quality of lifeinstruments including instruments related to cardiovascular diseases [15, 16]. However, to the authors’knowledge, currently there is no study on the development of a mapping algorithm for a heart failure specificstudy instrument. The main objective of this study wasto develop mapping algorithms which will enable theMinnesota Living with Heart Failure Questionnaire(MLHFQ) scores to be converted into utility scores thatcan be used in the heart failure related cost utilitystudies.Kularatna et al. Health and Quality of Life OutcomesMethodsStudy designAmbulatory patients were recruited from cardiologyout-patient clinics at Royal Brisbane and Women’s Hospital (RBWH), Brisbane, Australia. The RBWH is the largest hospital in Queensland and has nearly 1000 hospitalbeds. Patients with HF attending the between January2018 to March 2018 were included in the study. Patientswith documented evidence of HF were recruited to thestudy using convenient sampling method and upon recruitment, the diagnosis was confirmed by the clinicalcardiology staff.Following informed consent the study participantscompleted a three-sectioned questionnaire. The first section included the socio-demographic information suchas age and sex and diagnosis of the patient. The secondsection included the five-level EQ-5D questionnaire(EQ-5D-5 L) and the third section included the Minnesota Living with Heart Failure questionnaire (MLHFQ).Institutional ethics committee approval was obtainedfrom the Griffith University Human Research EthicsCommittee (Reference no. 2017/069).InstrumentsThe source instrument for mapping was the MLHFQand the target instrument was the EQ-5D-5 L.EuroQol five-dimensional questionnaire (EQ-5D)The three-level version EQ-5D is the most widely usedpreference-based instrument [17]. In 2011 the new versionof the instrument, the five-level EQ-5D (EQ-5D-5 L) wasdeveloped to improve the ability of the instrument tomeasure small changes in the health state, especially in patients with milder conditions [18]. EQ. 5D is an instrument which has been used to assess quality of life of heartfailure patients [19]. Furthermore, EQ-5D-5 L is a valid instrument to be used in health research in Australia [20].This instrument contains five domains: mobility, self-care,usual activities, pain/discomfort and anxiety/depression.Each domain has one item and each item has five response levels with one denoting no problems and five denoting extreme problems. Thus, EQ-5D-5 L can definemutually exclusive 3125 different health states [21]. Sincethen EQ-5D-5 L has been used to measure health stateutility of different disease conditions [22–24] includingcardiovascular disease [25, 26]. In this study the EQ-5D-5L was scored using the widely used UK tariff [21] since by
(2020) 18:115Page 3 of 12far the Australian-specific tariff is not yet available. Therefore, in Australia, UK tariffs are commonly used to calculate EQ-5D-5 L utility scores [27, 28]. The EQ-5D-5 Lutility scores (based on the UK tariff) range from 0.594(the worst health state) to 1.0 (the best health state), whilst0 equals being dead and negative values represent healthstatus considered worse than “dead”.differences between the observed and predicted utilityscores. The model assumes that the errors are normallydistributed with mean zero and has a constant variance(homoscedasticity) [36]. The OLS is the most widely reported method in mapping literature although violatingthe above assumptions [35].Kularatna et al. Health and Quality of Life Outcomes Generalized linear modelling (GLM)Minnesota living with heart failure questionnaire (MLHFQ)The MLHFQ is a self-administered, 21-item diseasespecific instrument for patients with heart failure [29].MLHFQ is an instrument which has been widely used toassess quality of life among heart failure patients [30–32]. Each item is scored in a 6-point Likert Scale (0 to5), thus the total score could range from 0 to 105, withhigher scores indicating more significant impairment inhealth-related quality of life. The MLHFQ has two domains; physical domain (eight items, score range from 0to 40) and emotional domain (five items, score rangefrom 0 to 25).GLM allows the errors to have a skewed distribution byhaving a priori specifying the distribution. All potentialcombination of family and link functions were investigatedand the ones with the best mapping performance waschosen for each model. For the Models 1 and 2, gammadistribution and identity link function produced the bestprediction model, while Gaussian distribution and ‘identity’ link function (which is equivalent to the OLS) produced the best prediction model for the Model 3.Statistical analysisThis method is best suited for outcome variables censored at lower or upper endpoints. This method usesmedian parameters rather than means, thus robust todistributional assumptions and heteroscedasticity [37].The patient characteristics were summarized using mean(standard deviation [SD]) and median for continuousvariables while frequency (percentage) was used for thecategorical variables. Normality of the continuous variables was assessed using the Shapiro-Wilks test. A scatter plot and Spearman correlation coefficient were usedto describe the correlation between the MLHFQ scoreand the EQ-5D-5 L utility score. The magnitude of thecorrelation coefficients (r) were interpreted according toGuilford’s criteria [33]. According to this criteria the correlation coefficients are divided in to five categories depending on the strength of the association, namely; verylow (r: 0.00–0.20), low (r: 0.21–0.40), moderate (r: 0.41–0.60), high (r: 0.61–0.80) and very high (r: 0.81–1.00).Both direct and indirect response mapping were conducted in the study.The best regression method to develop a predictivemodel is a widely discussed topic. The current consensusis that there is no one method that fits all data sets [34].To get around this uncertainty, during direct mapping,six regression techniques were used on the same datasetand the best was chosen based on validation parameters.Six regression techniques, each of which has the capability to cope with either skewness, heteroscedasticity, ceiling effects and/or the potential presence of outliers inthe data set [35], were used to identify the optimal mapping functions for each of the three models: Ordinary least square (OLS)In the OLS the coefficients and the intercept are calculated by minimising the sum of the squares of the Censored least absolute deviations (CLAD) Multivariable fractional polynomials (MFP)MFP is a useful modelling technique to be used whenthe dependant and the independent variables have anon-linear relationship [38]. Different regressionmethods were tested (such as OLS and GLM mentionedabove) and the median regression produced the best prediction model in all three models. Robust MM estimator (MM)This method is useful when presence of either heteroscedasticity or outliers limit the use of traditional regression methods [39]. Beta regression model (BETA)This method is robust to skewness and can estimateboth unimodal and bimodal utilities [35].The direct mapping algorithms were developed usingaforementioned regression techniques. In particular,three model specifications were considered to predictthe EQ-5D-5 L utility score mainly using MLHFQ totalscore (Model 1), MLHFQ domain scores (Model 2), orMLHFQ item scores (Model 3) (see below). Based onthe previous literature [40, 41], squared terms ofMLHFQ total score, MLHFQ domain scores andMLHFQ item scores were added as independent
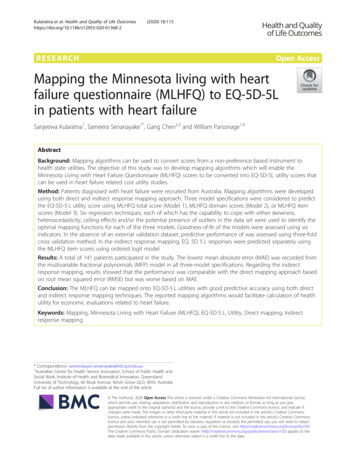
(2020) 18:115Page 4 of 12variables to the linear modes (i.e. OLS, CLAD, MM) inorder to account for the non-linear relationship betweenEQ-5D-5 L utility values and MLHFQ. However, for thenon-linear models, i.e. the GLM, MFP, and BETA, weonly included the original term in the modelling sincethe potential nonlinear relationship will be consideredduring the modelling process. Socio-demographic characteristics such as age and sex were included in themodels to improve the predictive performance. Forwardstepwise regression method was used to identify the statistically significant predictors (i.e. P 0.05) to be included in the final mapping functions.actual and predicted EQ-5D-5 L utilities was consideredas RMSE. However, more weight was given to MAE as itis easily interpretable and considered to be less sensitiveto outliers [43].Furthermore, four additional criteria were also considered to assess the modelsKularatna et al. Health and Quality of Life OutcomesEQ 5D 5 L utility score ¼ β0þ β1 MLHFQ total scoreþ β2 MLHFQ total score2þ β3 Ageþ β4 Sex ðModel 1ÞEQ 5D 5 L utility score ¼ β0 þ β1 MLHFQ Physical domain scoreþβ2 MLHFQ Physical domain score2þβ3 MLHFQ Emotional domain scoreþβ4 MLHFQ Emotional domain score2þβ5 Age þ β6 Sex ðModel 2ÞEQ 5D 5 L utility score ¼ β0 þþmXj¼1mXβ j MLHFQ item scoresβ j MLHFQ item scores2j¼1þβ2 Age þ β3 Sex ðModel 3ÞIn the indirect response mapping, EQ. 5D 5 L responses were predicted separately using the MLHFQitem scores using ordered logit model [42]. This willproduce a set of mapping algorithms which will predicteach of the 5 EQ. 5D 5 L dimension responses. This willenable calculating country-specific EQ-5D-5 L utilitiesby applying country-specific tariffs, not just the UK tariffthat was used for this study. The MLHFQ items thatshould be used to predict each of the EQ. 5D 5 L dimension responses were selected using forward stepwise regression technique.EQ 5D 5 L response ðeg:Mobility ÞmX¼β j MLHFQ item scoresj¼1Assessing model performanceGoodness-of-fit of the models were mainly assessedusing mean absolute error (MAE) and the root meansquare error (RMSE). MAE was computed as the meanof the absolute differences between the predicted and actual observed EQ-5D-5 L utilities, while the root squarevalue of the mean squared differences between thea) exactness of the predicted sample meanb) the range of predictionsc) the proportion of predicted utilities deviating fromobserved values by absolute error 0.03 and 0.05d) intra-class correlation coefficientsIn the absence of an external validation dataset, predictive performance of the models were assessed using3-fold cross validation method [44, 45]. The data set wasrandomly divided in to three equal-sized sections usingrandom number generation algorithms. During each iteration, two groups (67% of the data set) were allocatedto the “estimation sample” and all six regression modelswere applied to develop the coefficients. Then theremaining group (33% of the data set) was used as the‘validation sample’, where the estimates generated duringthe previous step were used to estimate the predictedvalues for the ‘validation sample’. This process was repeated three times, so as to make certain that each ofthe three subgroups was used in the estimation and validation iterations. Thereafter, the validation results werepooled together and model performance based on thepooled estimated goodness-of-fit statistics (MSE andMAE) was assessed.The “Mapping onto Preference-based measuresreporting Standards” (MAPS) checklist was followed inthis study [46]. All statistical analyses were conductedusing STATA Software version 15.0.ResultsSample characteristicsA total of 141 patients diagnosed with heart failure participated in the study. The mean age of the study participants was 63.3 (SD 14.8) years and more than half (n 96; 68.0%) of them were males (Table 1). The mean andthe median EQ-5D-5 L utility scores were 0.6619 (SD0.27) and 0.708 (0.553–0.877) respectively. The meanMLHFQ total score was 28.9 (SD 23.5). Frequency distribution plots of EQ-5D-5 L and MLHFQ total score isdepicted in Fig. 1. EQ-5D-5 L utility values were negatively skewed while the MLHFQ total score was positively skewed, indicating that both values were nonnormally distributed. This was further proven by ShapiroWilks test of normality (p 0.001). A moderately strongnegative correlation was observed between EQ-5D-5 Lutility scores and MLHFQ total score (Spearman correlation coefficient (r) 0.580; p 0.001) (Fig. 2).
Kularatna et al. Health and Quality of Life Outcomes(2020) 18:115Page 5 of 12Table 1 Participants characteristics (N 141)Prediction of EQ. 5D 5 L utility scoresCharacteristicIn the direct mapping, six regression methods and threemodel specifications were assessed separately. Age (p 0.2) and sex (p 0.8) were consistently insignificant inall regressions, thus they were excluded from the regression models. Of the 21 items in the instrument, onlythree items (item 04, 17 and 21) were found to be statistically significant in the forward stepwise regressionmethod. Thus, only those three items were included inthe final equation of the Model 3. Furthermore, squaredterms used in the OLS, CLAD, MM models were foundto be not significant, thus were removed from the finalmodel.Similar to direct mapping, age (p 0.05) and sex (p 0.05) were not significant in the indirect mapping response as well. Of the 21 items in the instrument, theitems which were statistically significant in predictingeach of the EQ-5D-5 L dimension responses (selectedusing the forward stepwise regression method) are indicated below.Mobility Item 3, Item 5 and Item 15.Self-care Item 4, Item 15, Item 16 and Item 17.Usual activity Item 2, Item 4, Item 14, Item15 andItem 17.Pain/Discomfort Item 1 and Item 13.Anxiety/depression Item 2, Item 4 and Item 21.Table 2 summarised the key goodness-of-fit statisticsfor different model and method combinations based onthe full sample (both direct and indirect response mapping). In the direct mapping, all models under predictedAge (Years)Mean (SD)63.3 (14.8)Median (IQR)66.0 (54.0–74.0)SexMale (%)96 (68.0)Female (%)45 (32.0)EQ-5D-5 L utility scoreMean (SD)0.6619 (0.27)Median (IQR)0.708 (0.553–0.877)MLHFQ total score (Max score 105)Mean (SD)28.9 (23.5)Median (IQR)24.0 (09.0–27.0)MLHFQ physical domain score (Max score 40)Mean (SD)13.4 (10.3)Median (IQR)13.0 (4.0–12.0)MLHFQ emotional domain score (Max 25)Mean (SD)6.6 (6.9)Median (IQR)4.0 (0.0–12.0)MLHFQ Minnesota Living with Heart Failure Questionnaire.Similarly, MLHFQ physical domain score (Spearmancorrelation coefficient (r) 0.5773; p 0.001) andMLHFQ emotional domain score (Spearman correlationcoefficient (r) 0.5498; p 0.001) were also moderatelycorrelated with the EQ-5D-5 L utility score.Fig. 1 Histogram of the MLHFQ total and domain scores and EQ-5D-5 L
Kularatna et al. Health and Quality of Life Outcomes(2020) 18:115Page 6 of 12Fig. 2 Scatter plot between the MLHFQ total score and the EQ-5D-5 L utilitiesthe maximum observed utility value (1.000), while allmodels over predicted the lowest observed utility ( 0.2630). The highest discrepancies between the predictedminimum and the observed minimum was found in MMestimates (Model 1) and lowest was in Beta (Model 3).Regarding the RMSE and MAE values, OLS and GLMhad the lowest RMSE value in each of the three modelspecifications. However, the lowest MAE was recordedfrom the MFP model in all three-model specifications.Regarding the indirect response mapping, results show thatthe performance was comparable with the direct mappingapproach based on RMSE but was worse based on MAE.ValidationIn the absence of an external validation dataset, predictive performance of the models was assessed using threefold cross validation method (Table 3). All models wereassessed for goodness of fit using the MAE and RMSEand a consistent pattern was seen in all three-modelspecifications (direct mapping); OLS and GLM showedthe lowest RMSE value and MFP estimates showed thelowest MAE value. Based on the results in Table 3, it isconcluded that mapping algorithms developed usingMFP regression technique exhibited the best predictiveability to predict the EQ-5D-5 L utility score usingMLHFQ total score, MLHFQ domain scores andMLHFQ item scores.Regarding the indirect response mapping, validationresults was very much similar to the results of the mainsample.Best performing modelsThe best models to predict the EQ-5D-5 L utility scoreusing MLHFQ total score, MLHFQ domain scores andMLHFQ item scores were selected on the basis of theirperformance in the cross validation step, with moreweight put on the MAE following evidence in the literature [43]. MFP regression technique performed best inall three-model specifications. Detailed Goodness-of-fitindicators for the above three models are indicated inthe Table 4. Fig. 3 illustrates the scatter plots of observed vs predicted EQ-5D-5 L using the selected bestperforming models. Table 4 and Fig. 3 indicate that themodel over predicted the severe health states. For example, in Model 1, observed 50th and 75th percentilewere 0.7520 and 0.8604 while the predicted values were0.7080 and 0.8770. However, in the Model 1 the observed 5th and 10th percentile were 0.0826 and 0.2593while the predicted values were 0.3653 and 0.4313. TheBland-Altman plot showed proportional error and widelimits of agreement (Fig. 4).Table 5 reports the detailed MFP regression coefficients for each model specification, which can be usedto predict the EQ-5D-5 L utility score in the three specification scenarios. The transformation scores of the MFPmodels are as follows.MLHF transformation factor - 28.92198582.MLHF Physical domain transformation factor 13.43971631.MLHF Emotional domain transformation factor 6.595744681.
Kularatna et al. Health and Quality of Life Outcomes(2020) 18:115Page 7 of 12Table 2 Goodness of fit results from full estimation sample (N 141)Model Specification Mean utility (SD) MinimumMaximum P.25Median P.75MAEAbs diff 0.03Abs diff 0.05ICC0.7966 0.22190.17829.916.20.6700.7966 0.22190.17829.916.20.6700.8109 0.22340.174011.318.30.6540.8604 0.22880.1713 12.718.30.6840.6124 0.77030.8732 0.23420.172412.719.70.6730.5885 0.80440.8912 0.23860.177810.616.20.7050.86310.5519 0.68180.8028 0.21850.17509.215.50.6900.23080.86310.5519 0.68180.8028 0.21850.17509.215.50.6900.27620.90720.5964 0.72720.8473 0.22300.168910.619.00.6890.72240.29200.92630.6132 0.74140.8653 0.22680.1684 11.316.90.6880.73730.28970.94290.6125 0.75860.8871 0.23130.16959.216.20.6970.72560.15050.93350.6154 0.78870.9019 7 0.69840.8222 97 0.69840.8222 126 0.73220.8370 77 0.74730.8655 0.22040.1676 13.420.40.700MM0.72600.27190.89530.6278 0.77950.8953 98 0.80270.9032 0.23210.174510.616.90.7310.64430.47900.76800.5410 0.59200.7680 0.23630.192710.615.50.5120.6619 0.26301.00000.5530 0.70800.8770OLS0.66190.24210.85750.5396 0.6952GLM0.66190.24210.85750.5396 0.6952CLAD0.68490.29200.86790.5705 0.7160MFP0.71640.26790.92540.5858 MSEModel 1Model 2Model 3Indirect mappingOLOGITDependant variable: EQ-5D-5 L utility score; Independent variables: Model 1 - MLHF total score; Model 2 – MLHF domain scores; Model 3 – MLHF item scores (Item04, 17 and 21).Abs diff. 0.03 (0.05)% - proportion of predicted utilities whose absolute values deviate from the mean of the observed utility values by less than 0.03 (0.05); P.25– 25th percentile; P.75 75th percentile, RMSE Root Mean Square Error; MAE Mean Absolute Error; ICC – Intra Class Correlation.OLS Ordinary least square, GLM Generalized linear modelling, CLAD Censored least absolute deviations, MFP Multivariable fractional polynomials, MM Robust MMestimator, BETA Mixture beta regression model, OLOGIT ordered logit (indirect response mapping).MLHF Item 04 score transformation factor 1.304964539.MLHF Item 17 score transformation factor 1.042553191.MLHF Item 21 score transformation factor 1.234042553.For example, the EQ-5D-5 L utility score could be predicted from MLHFQ total score using the followingequation.MFPStep 1 – calculate a transformed MLHF total score.MLHF transformed total score* MLHF total score 28.92198582.Step 2 – calculate the predicted EQ-5D-5 L utilityscore.EQ-5D-5 L utility predicted using MFP 0.7164347–0.0072258 x MLHF transformed total score*.Calculating the country specific utility values using indirect response mapping algorithms is a three-stepprocess.Step 1: Calculate the response score using the relevantcoefficients (Table 6).E.g.; Calculating EQ-5D-5 L mobility response score.MLHF items needed: item 3, item 5 and item 15 (seeTable 6).MLHF scores of each item (example): 5 (item 3), 3(item 5) and 3 (item 15).Predicted EQ-5D-5 L mobility response score (Item score x Coefficient). (5 0.275936) (3 0.56649) (3 0.27337). 3.899258.Step 2: Check the predicted EQ-5D-5 L mobility response score against the cut-off values (see Table 6).Predicted EQ-5D-5 L mobility response score 3.899258.
Kularatna et al. Health and Quality of Life Outcomes(2020) 18:115Table 3 Goodness of fit results from validation analysisValidation method (3-fold)Pooled sample (N 141)Mean utilityObservedRMSEMAEAbdiff 0.03Abdiff 0.050.6619Model 23180.174011.316.90.23530.19358.512.7Model 2Model 3Indirect mappingOLOGIT0.6498Dependant variable: EQ-5D-5 L utility score; Independent variables: Model1 - MLHF total score; Model 2 – MLHF domain scores; Model 3 – MLHFitem scores (Item 04, 17 and 21).Abs diff. 0.03 (0.05)% - proportion of predicted utilities whose absolutevalues deviate from the mean of the observed utility values by less than0.03 (0.05); RMSE – Root Mean Square Error; MAE – Mean Absolute Error.OLS - Ordinary least square; GLM - Generalized linear modelling; CLAD Censored least absolute deviations; MFP - Multivariable fractionalpolynomials; MM - Robust MM estimator; BETA - Mixture beta regressionmodel; OLOGIT ordered logit (indirect response mapping).Page 8 of 12Cut-offs in Mobility response.Less than 1.102055 Response 1.Between 1.102055 and 2.64014 Response 2.Between 2.64014 and 4.632778 Response 3.Between 4.632778 and 6.351936 Response 4.More than 6.351936 Response 5.Since 3.899258 is between 2.64014 and 4.632778 thefinal EQ-5D-5 L mobility response is 3. Conduct thesame process for all other EQ-5D-5 L domains.Step 3: Appy country-specific tariffs to calculate thecountry-specific EQ-5D-5 L utilities.DiscussionThis is the first study to map MLHF onto EQ-5D-5 Lutility scores using both direct and indirect responsemapping techniques. Any previous study which did notuse a preference-based instrument, but included MLHFquestionnaire for data collection can use this algorithmto calculate utility values and use them in estimatingcost effectiveness of the intervention in cost per QALYterms. Our regression analyses showed that the EQ-5D5 L utility scores of heart failure patients in our samplewas best predicted by the MFP regression model. Furthermore, results in
Minnesota living with heart failure questionnaire (MLHFQ) The MLHFQ is a self-administered, 21-item disease-specific instrument for patients with heart failure [29]. MLHFQ is an instrument which has been widely used to assess quality of life among heart failure patients [30- 32]. Each item is scored in a 6-point Likert Scale (0 to