Transcription
County Development Plan ReviewRural HousingBackground PaperNovember 2012Planning Policy UnitCork County Council
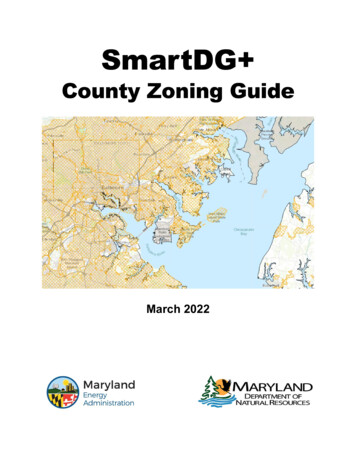
Rural Housing Background PaperNovember 2012ii
Rural Housing Background PaperNovember 2012Table of ContentsPageExecutive Summaryii1. Introduction12. Rural Population Change 2006 – 201133. Recent Patterns of Rural Housing Development74. Environmental Sensitivity and Rural Housing Pressure255. Defining Areas of Strong Urban Influence276. Identification of Rural Area Types317. Conclusions37Note: Although November 2012 is the cover date on this document the data usedto inform the document was largely collected in late 2011 and throughout 2012.i
Rural Housing Background PaperNovember 2012Executive Summaryi. Terms of ReferenceThe main outputs of this study are to:(a) Review policies for the Metropolitan Greenbelt and Rural Housing Control Zone and(b) A review of the rural housing policies applicable to the remainder of the County,based on the template put forward in the Sustainable Rural Housing Guidelines 2005.It was agreed at the Planning Policy Group Meeting of the 17th January 2012 thatalthough the initial aim of this study is to review the rural housing policies for theMetropolitan Greenbelt, this needs to be carried out in line with the overall approach torural housing set out in the Ministerial Guidelines. The following section outlined theagreed approach for the study which was adapted to address any emerging issues as thestudy progressed.The Approach of this Study is to: Use the Sustainable Rural Housing Guidelines as a template to revise and review the currentrural housing policy. The overall aim in the longer term context of the CDP review could be toproduce a rural housing policy for the entire Cork County area broadly in line with theapproach suggested in the guidelines. Review of policies for the Metropolitan Greenbelt and Rural Housing Control Zone whichwould include the following :Examine the approach taken by other Local Authorities when reviewing Rural Housingrequirements.Carry out an Analysis of the following data sources to inform the process of developing aTypology for the Rural Areas of Co Cork. Analysis of Geo-directory databases from 2007-2011 to ascertain the amount ofnew housing development in rural areas. Analysis of Planning Application database (or other forms of monitoring dataOdyssey etc) to examine the amount of individual houses granted permission inrural areas. Analysis of Census Data to examine trends in relation to rural areas experiencingsignificant population growth and population decline. Carry out a similar review of the rural housing policies applicable to the remainder of theCounty with a view to informing debate in the issues paper to be published in 2013. The Criteria in the following table will be used to develop a Typology of Rural Areas which willbe Map Based in accordance with the Sustainable Rural Housing Guidelines. In order to develop the Typology of Rural Areas within the County an analysis of demographic,social, economic and heritage issues / designations will need to be taken into account. Any new policies emerging from the study will need to be subject to both SEA and AAprocesses. Consider how to incorporate the requirements of Department Circular 5(08) relating to ruralbusiness. The development of the Typology and any policies emerging from the study should be setwithin the wider context of an overall policy for Rural County Cork which will deal with howbest to sustain and develop rural communities in all parts of the County over the lifetime ofthe new plan.ii
Rural Housing Background PaperNovember 2012The following criteria will be used in this study to develop a Typology for Rural Areas:Rural AreaTypeRural AreasunderstrongurbaninfluenceStrongerrural areasKey Elements associated with aTypical Policy Facilitate the housingrequirements of the ruralcommunity as identified bythe planning authority inlight of local conditions. Directing urban generateddevelopment to areas zonedfor new housingdevelopment within thesettlement network.Suggested Approach for Study It is proposed that clusters of DED’s withsimilar characteristics experiencingpopulation stability be examined to definethese stronger rural areas. It is proposed that clusters of DED’s withsimilar characteristics experiencing apersistent and significant decline inpopulation be examined to define thesestructurally weaker rural areas. It is proposed to examine if these types ofclustered settlement patterns exist incoastal areas of West Cork and examinethe most appropriate policy response toaddress any issues.It is proposed to examine the approachtaken by other Local Authorities (along thewestern seaboard) in defining these areas. Structurallyweakerrural areas Areas withclusteredsettlementpatterns Consolidate and sustain thestability of the population.Strike the appropriatebalance betweendevelopment activity insmaller towns and villagesand wider rural areas.Carefully monitordevelopment trends to avoidareas becomingoverdeveloped (i.e.extensive ribbondevelopment).Need to accommodate anydemand for permanentresidential development as itarises subject to goodpractice in design, locationand protection of importantlandscapes and anyenvironmentally sensitiveareas.Linkages to policies aimed atenhancing developmentpotential and availability ofindigenous employment inweaker areas.Monitoring the operation ofsettlement policies to avoidexcessive levels ofinappropriately locateddevelopment.Support the maintenance ofa vibrant rural population.Protect important landscapequality. iiiIt is proposed that an analysis beundertake to ascertain the extent of therural area of Co Cork which is under StrongUrban Influence.This analysis should be based on drivetimes from Cork City.An analysis of population growth, houseconstruction and planning permissionsgranted for rural dwellings will also beundertaken.
Rural Housing Background PaperNovember 2012ii. BackgroundThe Cork Area Strategic Plan (2001) recognised that the Green Belt was a centralconcept to its strategy and that controls on one-off rural housing should be extended tothe whole of Metropolitan Cork. The 2003 County Development Plan gave effect to thisrecommendation and extended the A1, A2, and A3 Greenbelt designations establishedin 1996 to most of Metropolitan Cork.In addition, the County Development Plan 2003, recognising the pressure for urbangenerated rural housing in the area within CASP but beyond the Metropolitan Area,established a ‘Rural Housing Control Zone’ (RHCZ) for part of this area, where somecontrols on rural housing also applied.Outside the Rural Housing Control Zone, the Electoral Area Local Area Plans of 2005replaced the ‘three-mile-zones’ around the main towns with mapped Green Belts thataimed to protect the visual setting of the town from unnecessary one-off rural housing.The 2009 CDP continued the rural housing policy contained in the 2003 CDP, withcontrols on rural housing in the Greenbelt Areas, Rural Housing Control Zone and‘Scenic and Coastal Areas’ of the County. The plan stated that in relation to the CASPRing Rural Area, ‘the rate at which permissions are granted for individual houses in ruralareas will need to be reduced significantly below the levels recorded in the last fewyears’ and ‘if current trends continue the County Council will introduce policy measuresto the entire CASP Ring Rural Areas’ to ensure that the targets in the development planare met.Outside of these areas, there are no settlement policy restrictions on rural housing andapplications are dealt with on their merits subject to normal proper planning andsustainable development considerations. This area equates to approximately 63% of thetotal land mass of the County.iii. Policy ContextThe Sustainable Rural Housing Guidelines are the current statement of governmentpolicy on rural housing. They were introduced in 2005 after the last major review of ourown rural housing policies. The salient points in relation to the review of Rural Housingpolicies in the Guidelines are as follows: The Guidelines highlight the importance of the planning system adopting a more‘analytically based and plan led approach’. The Guidelines state that it is ‘vitally important that a process of research andanalysis be carried out into population and development trends in rural areas’, whichshould include the identification of ‘Rural Area Types’ set out in the NSS, to include (a)Rural Areas under strong urban influence.(b)Stronger rural areas.(c)Structurally weaker rural areas.(d)Areas with clustered settlement patterns. The development plan should illustrate these areas on a single general map,avoiding an overly-detailed and prescriptive map.iv
Rural Housing Background PaperNovember 2012 The Guidelines state that the results of the analysis should be published (e.g.included in any ‘Issues paper’) to harness public support for the plans objectives. Having defined the ‘Rural Area Types’, the planning authority must then tailorpolicies that respond to:1) The different housing requirements of urban and rural communities.2) The varying characteristics of rural areas.Planning policies will need to make the distinctions in (1) and (2) above to avoid ribbon(example and definition cited in the guidelines) and haphazard development in ruralareas close to towns / cities. These policies should be addressed within the context of an ‘overall settlementstrategy’, which would set out a vision for urban and rural areas.iv. Survey and AnalysisThe main findings of this study on rural housing from 2007 to 2011 are as follows:-The study reveals that between 2007-2011, 43% of the new houses built outsidedevelopment boundaries were built in the West Cork Strategic Planning Area,followed by 32% in the CASP Ring SPA, 16% in the North SPA and 9% in MetropolitanCork.-Between 2007 and 2011, 54% of the total number of additional houses built outsidedevelopment boundaries within the County, were located in unrestricted areasequating to 4,751 dwellings (increase of 18%).-The housing stock outside development boundaries grew by 8,765 houses or 15%(Average of 1,753 houses per year) from 2007 to 2011.-The largest increase was experienced in the West Strategic Planning Area where thehousing stock outside development boundaries grew by 3,759 houses or 23%(Average of 752 houses per year) from 2007 to 2011, which is more than double theannual growth figure of 318 dwellings per year envisaged for the villages and ruralareas of the West SPA in the Core Strategy.-The housing stock outside development boundaries in the CASP Ring SPA grew by2,816 houses or 15% (Average of 563 houses per year) from 2007 to 2011.-The housing stock outside development boundaries in unrestricted areas of CASPgrew by 1,905 dwellings or 16% (Average of 381 houses per year) from 2007 to2011, which is substantially in excess of the entire figure for the North SPA duringthis period.-The levels of rural housing growth from 2007-2011 in the North SPA andMetropolitan Cork were marginally lower at 12% and 8% respectively, in excess ofthose at the beginning of 2007.-The average rural housing growth per DED for Co Cork from 2007 to 2011 wascalculated at 15%. There has been positive rural housing growth in all but 6 of thev
Rural Housing Background PaperNovember 2012Rural DED’s in County Cork from 2007-2011. These results indicate significantdevelopment pressure in rural areas of the CASP Ring Strategic Planning Area and inthe West Cork Strategic Planning Area.v. Census ResultsThe average percentage increase in population from 2006 to 2011 for Cork County was10.48 % which is slightly above the national average.The results of the Census reveal that the highest levels of population growth wereexperienced within CASP with the vast majority of DED’s experiencing above averagepopulation growth.There were lower levels of population growth in the DED’s of the West and NorthStrategic Planning Areas. In these areas, population growth was normally clusteredamong several DED’s which were primarily characterised by either proximity to a maintown or within the commuting catchment of Cork City.There were 47 DED’s which experienced a decline in population from 2006 to 2011. Themajority of these DED’s were located in the North Strategic Planning Area and WestStrategic Planning Area.The average percentage vacancy rate in 2011 for Cork County is 15.79 % which is slightlyabove the national average. The highest levels of vacancy rates are in the West StrategicPlanning Area, Coastal Areas of the County, and to a lesser extent the North StrategicPlanning Area.An analysis of vacancy rates for the West Strategic Planning Area, reveal that of the 105Rural DED’s located within the Strategic Planning Area, 86 DED’s have vacancy rates inexcess of the County average with Coastal DED’s experiencing the highest vacancy rates.These results suggest that a prevalence of holiday and second home development in theWest Strategic Planning Area has contributed to high vacancy rates.The National average % of the total population within the 65 Age Band is 11.67%, whilethe County average is slightly less at 11.48%. The 2011 Census results reveal that the %of total population within the 65 Age Band is greatest in DED’s in the North and WestCork Strategic Planning Areas in the DED’s most remote from urban areas.The Census results indicate that a higher than average Economic Dependency Ratio canbe found in DED’s clustered in the West Strategic Planning Area and the North StrategicPlanning Area.The Census results indicate that higher than average participation in the Agriculture,Forestry and Fishing sectors can be found clustered in the West Strategic Planning Areaand the North Strategic Planning Area.vi. Draft Rural Area TypesFollowing a detailed analysis based on an extensive list of criteria in Section 6 of thisreport, it was concluded that there are five distinct rural area types (which are detailedin Map 14).vi
Rural Housing Background PaperNovember 2012The five rural area types are:(1) Rural areas under strong urban influence. Rural areas within commutingdistance of Cork City and Environs. These areas exhibit characteristics such as rapidlyrising population, evidence of considerable pressure from the development of(urban generated) housing in the open countryside due to proximity to such urbanareas / major transport corridors, pressures on infrastructure such as the local roadnetwork and higher levels of environmental and landscape sensitivity.(2) Tourism and rural diversification areas. Part of the rural and coastal area ofCounty Cork. These areas exhibit characteristics such as evidence of considerablepressure for rural housing in particular higher demand for holiday and second homedevelopment. These rural areas are more distant from the major urban areas andthe associated pressure from urban generated housing. These areas also have higherhousing vacancy rates and evidence of a relatively stable population compared toweaker parts of the County. These areas have higher levels of environmental andlandscape sensitivity and a weaker economic structure with significant opportunitiesfor tourism and rural diversification.(3) Stronger rural areas. Rural areas to the north of the County that traditionallyhave had a strong agricultural base. In these areas population levels are generallystable within a well-developed town and village structure and in the wider ruralareas around them. This stability is supported by a traditionally strong agriculturaleconomic base, that is restructuring to cope with changes in the agricultural sectorand the level of individual housing development activity in these areas tends to belower and confined to certain areas as pressure for urban generated housing is less.(4) Transitional rural areas. Western and inland areas of the County. These ruralareas are more distant from the major urban areas and the associated pressure fromurban generated housing. Although there is a lower concentration of population,there is a more stable population base and less evidence of population decline thanother parts of the County. These areas also exhibit characteristics of a weakereconomic structure and have higher levels of environmental sensitivity.(5) Structurally weaker rural areas. North-west of the County. These less populatedareas exhibit characteristics such as persistent and significant population decline aswell as a weaker economic structure and lower levels of environmental sensitivity.These rural areas are more distant from the major urban areas and the associatedpressure from urban generated housing.vii
Rural Housing Background Paper1November 2012INTRODUCTIONBackground to rural housing policies in County Cork1.1. The 1996 County Development Plan introduced rural housing policy restrictions in thefollowing areas (1) Green Belt within 3 miles of the Cork City, (2) An area around thisGreen Belt roughly the same size as the LUTS area, (3) Transitional area to the southwest, (4) Areas within 3 miles of towns and (5) Coastal areas of the County.1.2. The Cork Area Strategic Plan (2001) recognised that the Green Belt was a centralconcept to it strategy and that controls on one-off rural housing should be extended tothe whole of Metropolitan Cork. The 2003 County Development Plan gave effect to thisrecommendation and extended the A1, A2, and A3 Greenbelt designations establishedin 1996 to most of Metropolitan Cork.1.3. In addition, the County Development Plan 2003, recognising the pressure for urbangenerated rural housing in the area within CASP but beyond the Metropolitan Area,established a ‘Rural Housing Control Zone’ (RHCZ) for part of this area, where somecontrols on rural housing also applied.1.4. Outside the Rural Housing Control Zone, the Electoral Area Local Area Plans of 2005replaced the ‘three-mile-zones’ around the main towns with mapped Green Belts thataimed to protect the visual setting of the town from unnecessary one-off rural housing.1.5. The 2009 CDP continued the rural housing policy contained in the 2003 CDP, withcontrols on rural housing in the Greenbelt Areas, Rural Housing Control Zone and ‘Scenicand Coastal Areas’ of the County. Outside of these areas, there are no settlement policyrestrictions on rural housing and applications are dealt with on their merits.Reasons for this study1.6. It is now 16 years since the first introduction of Rural Housing polices in the 1996County Development Plan. There has been no comprehensive review in that period.1.7. The 2005 Sustainable Rural Housing Guidelines are the current statement ofgovernment policy on rural housing. They were introduced in 2005 after the last majorreview of our own rural housing policies. These recommend a change in approach(identify a rural typology for the County as whole and develop an appropriate policyresponse for each rural area type) that has never been fully considered in County Cork.The Guidelines recommend that the development plan should illustrate these areas on asingle general map and the results of the analysis published (e.g. included in any ‘Issuespaper’) to harness public support for the plans objectives;1.8. The 2008 CASP Update (and both the 2006 and 2011 Census) has identified excessivepopulation growth trends in the CASP ring rural area and the management of these infuture requires the development of a policy response. The 2009 County Developmentplan stated that in relation to the CASP Ring Rural Area, ‘the rate at which permissionsare granted for individual houses in rural areas will need to be reduced significantlybelow the levels recorded in the last few years’ and ‘if current trends continue theCounty Council will introduce policy measures to the entire CASP Ring Rural Areas’ toensure that the targets in the development plan are met.1
Rural Housing Background PaperNovember 2012Overall approach to this study1.9. The Overall Approach to this study is to:1.10. Use the Sustainable Rural Housing Guidelines as a template to revise and review thecurrent rural housing policy. The overall aim in the longer term context of the CDPreview could be to produce a rural housing policy for the entire Cork County areabroadly in line with the approach suggested in the guidelines.1.11. Review of policies for the Metropolitan Greenbelt and Rural Housing Control Zonewhich would include the following:-Examine the approach taken by other Local Authorities when reviewing RuralHousing requirements.Carry out an Analysis of the following data sources to inform the process ofdeveloping a Typology for the Rural Areas of Co Cork. Analysis of Geo-directory databases from 2005-2011 to ascertain theamount of new housing development in rural areas. Analysis of Planning Application database (or other forms of monitoringdata Odyssey etc) to examine the amount of individual houses grantedpermission in rural areas. Analysis of Census Data to examine trends in relation to rural areasexperiencing significant population growth and population decline.1.12. Carry out a similar review of the rural housing policies applicable to the remainder ofthe County with a view to informing debate in the issues paper to be published in 2013.1.13. Develop a Typology of Rural Areas which will be Map Based in accordance with theSustainable Rural Housing Guidelines based on set criteria.1.14.Analysis of demographic, social, economic and heritage issues / designations.1.15. Any new policies emerging from the study will need to be subject to both SEA andAA processes.1.16. Consider how to incorporate the requirements of Department Circular 5(08) relatingto rural business.1.17. The development of the Typology and any policies emerging from the study shouldbe set within the wider context of an overall policy for Rural County Cork which will dealwith how best to sustain and develop rural communities in all parts of the County overthe lifetime of the new plan.2
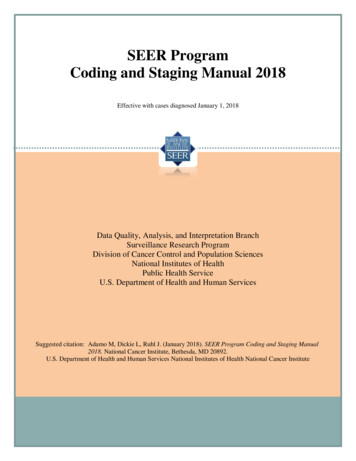
Rural Housing Background PaperNovember 20122. POPULATION CHANGE 2006-20112.1. The results of the Population Change analysis for County Cork DED’s (which includedurban and rural areas) from 2006 to 2011 are illustrated in Map 1 below.2.2. According to the 2011 Census results, the average National percentage populationincrease (by DED) is 8.22 %.2.3. The average percentage increase in population from 2006 to 2011 in Cork County was10.48 % which is slightly above the national average.2.4. The results of the Census analysis of Population change reveal that the highest levels ofpopulation growth were experienced within CASP with the vast majority of DED’sexperiencing above average population growth.2.5. There were lower levels of population growth in the DED’s of the West and NorthStrategic Planning Areas. In these areas, population growth was normally clusteredamong several DED’s which were primarily characterised by either proximity to a maintown or within the commuting catchment of Cork City.2.6. There were 47 DED’s which experienced a decline in population from 2006 to 2011. Themajority of these DED’s were located in the North Strategic Planning Area and the WestStrategic Planning Area.Map 1: Population Change % by DED from 2006-2011 based on the PreliminaryCensus Results3
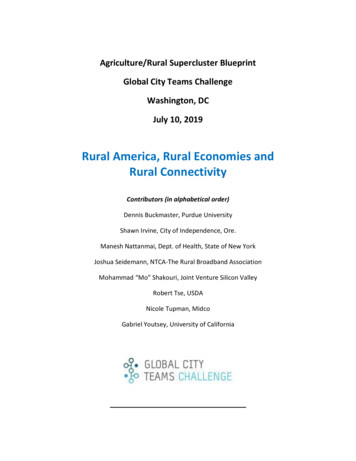
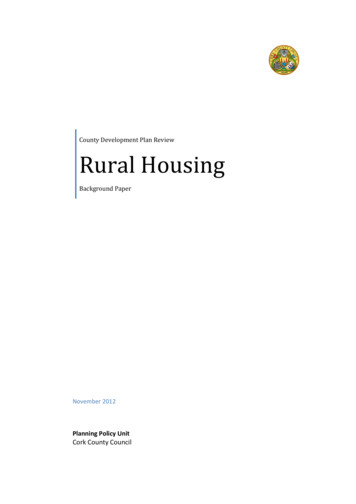
Rural Housing Background PaperNovember 2012Total Population within 65 Age Band – Census 20112.7. The National average % of the total population within the 65 Age Band (which includedurban and rural areas) is 11.67%, while the County average is slightly less at 11.48%which represents a slight increase on 2006 Census figures for this age band.2.8. The 2011 Census (Map 2) results reveal that the % of total population within the 65 Age Band is greatest in DED’s in the North and West Cork Strategic Planning Areas in theDED’s most remote from urban areas.Map 2: % Total Population within 65 Age BandSource: http://www.airo.ie/4
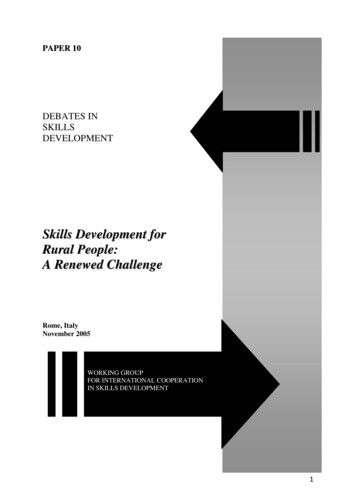
Rural Housing Background PaperNovember 2012Economic Dependency Ratio – Census 20062.9. The Economic Dependency Ratio (EDR) is calculated as the ratio of the total economicinactive population (Children 14 and under, Unemployed, First Time Job Seekers, HomeDuties, Retired, Students, Unable to Work) to those at Work.2.10. The resulting ratio is the number of inactive persons to every one active person.Therefore the higher the EDR, the more inactive people are dependent on the activepopulation. The EDR helps to highlight those areas with smaller numbers of incomeearners relative to the economically dependent population of the area.2.11. Map 3 shows the Economic Dependency Ratio by DED (which included urban andrural areas). The results indicate that higher than average EDR’s are to be foundclustered in the West Strategic Planning Area and the North Strategic Planning Area.Map 3: Economic Dependency Ratio – 2006Source: http://www.airo.ie/5
Rural Housing Background PaperNovember 2012Agriculture, Forestry and Fishing Involvement – Census 20112.12. Map 4 shows the percentage involvement in Agriculture, Forestry and Fishing by DED(which included urban and rural areas) based on the 2011 Census. The results indicatethat higher than average participation in these sectors can be found clustered in theWest Strategic Planning Area and the North Strategic Planning Area.Map 4: Percentage Agriculture, Forestry & Fishing 2011Source: http://www.airo.ie/6
Rural Housing Background PaperNovember 20123. RURAL HOUSING ANALYSIS USING THE GEODIRECTORY DATABASE1st January 2007 to 31st December 20113.1. This section outlines the results of a study on the quantity and distribution of ruralhousing growth in Co Cork for the period 01.01.07 to 31.12.11. This report wasgenerated following the completion of a Spatial Analysis (using Mapinfo v 10.0.1) of oneselected Geodirectory database per year for the period 2007-2011.What is the Geodirectory?3.2. The Geodirectory is the definitive address database of buildings in the Republic ofIreland. GeoDirectory was established by An Post and Ordnance Survey Ireland toidentify the precise address and location of every residential and commercial propertyin the State. The GeoDirectory assigns each property its own individual fingerprint – aunique, verified address in a standardised format, together with a precise geocode.Study Methodology3.3. This study on rural housing was carried out to inform the review process of the 2009County Development Plan. The Spatial Analysis of GeoDirectory addresses were carriedout for all rural areas of the County, outside of the defined development boundaries. Aseries of spatial queries were then carried out on these databases which are presentedin the following Tables, Charts and Thematic Maps.Rural Housing Analysis by Strategic Planning Area for the period 2007 - 2011Table 3.1: Number of houses per Strategic Planning AreaNumber of houses in Rural Areas of Cork CountyStrategic PlanningArea20072008200920102011TotalIncrease2007 2011Metropolitan CorkCASP Ring SPANorth SPAWest 3%Total Overall% Increase ofRural HousingStock per SPA2007-20118%15%12%23%Total Rural stribution ofRural Housinggrowth per SPA2007-2011Results of the Rural Housing Analysis by Strategic Planning AreaCounty Rural3.4. The housing stock outside development boundaries grew by 8,765 houses or 15%(Average of 1,753 houses per year) from 2007 to 2011.3.5. The analysis reveals that between 2007-2011, 43% of the new houses built outsidedevelopment boundaries were built in the West Cork Strategic Planning Area, followedby 32% in the CASP Ring SPA, 16% in the North SPA and 9% in Metropolitan Cork.7
Rural Housing Background PaperNovember 2012West Strategic Planning Area3.6. The largest increase was experienced in the West Strategic Planning Area where thehousing stock outside development boundaries grew by 3,759 houses or 23% (Averageof 752 houses per year) from 2007 to 2011.3.7. This area also recorded the highest percentage of vacant dwellings in the County,suggesting that demand for second homes or holiday homes is a significant factoraffecting the overall demand for rural housing.CASP Ring Strategic Planning Area3.8. The housing stock outside development boundaries grew by 2,816 houses or 15%(Average of 563 houses per year) from 2007 to 2011.North & Metropolitan Cork Strategic Planning Areas3.9. The levels of rural housing growth from 2007-2011 in the North SPA and MetropolitanCork were marginally lower at 12% and 8% respectively, in excess of those at thebeginning of 2007.8
Rural Housing Background PaperNovember 2012Rural Housing Analysis within CASP for the period 2007 - 2011Table 3.2: Number of houses in Rural Areas of CASPCASP BreakdownGreen Belt A1Green Belt A2Green Belt A3Rural Housing ControlZoneRemainder of CASPRuralTotal CASP 215201130Distributionof RuralHousinggrowthwithin ease20072011TotalOverallIncrease20072011 %10%11%3%3.10. The housing stock outside development boundaries in CASP grew by 3,640 houses or13% (Average of 728 houses per year) from 2007 to 2011.3.11. The housing stock outside development boundaries in unrestricted areas of CASPgrew by 1,905 dwellings or 16% (Average of 381 houses per year) from 2007 to 2011,which is substantially in excess of the entire figure for the North SPA during this period.3.12. The analysis reveals that between 2007 and 2011, 52% of the new houses builtoutside development boundaries within the CASP area, were located in unrestrictedareas of CASP outside of the RHCZ.3.13. Between 2007-2011, the total number of new dwellings in the A1 Greenbelte
The main findings of this study on rural housing from 2007 to 2011 are as follows: - The study reveals that between 2007-2011, 43% of the new houses built outside development boundaries were built in the West Cork Strategic Planning Area, followed by 32% in the CASP Ring SPA, 16% in the North SPA and 9% in Metropolitan Cork.