Transcription
General InternalMedicine ProfileUpdatedDecember 2019
GENERAL INTERNALMEDICINETable of ContentsSlide General Information Total number & number/100,000 population by province, 20196 Number/100,000 population, 1995-20197 Number by gender & year, 1995-20198 Percentage by gender & age, 20199 Number by gender & age, 201910 Percentage by main work setting, 201911 Percentage by practice organization, 201712 Hours worked per week (excluding on-call), 201913 On-call duty hours per month, 201914 Percentage by remuneration method15 Professional & work-life balance satisfaction, 201916 Number of retirees during the three year period of 2016-201817 Employment situation, 201718 Links to additional resources19Click on any of the contents below to navigate to the slide. Please click the “home icon” located at the top right ofeach slide to return to the “table of contents” slide.3-52
General informationInternal medicine is a broad-based specialty that has its roots in primary care and is dedicated toproviding primary and specialty care to adults. Internists diagnose and manage diseases involvingany of the organ systems and are specially trained to manage seriously ill patients suffering fromadvanced illness and/or diseases of more than one system.Internists provide care in an office setting, in hospitals and on a continuing ambulatory basis.They tend to the general medical needs of their patients in the office, including disease prevention,early detection of disease, screening, patient education and follow-up care from hospitalization.In the hospital and ambulatory setting, internists manage acute and chronic illness of their patientsand other patients that have been referred to them by other practitioners such as family physicians.They are also trained to meet the special needs of the geriatric population.Source: Pathway evaluation program3
General informationInternists are trained in many procedures from many different disciplines and they perform theseindependently. They may also take additional training and subspecialize in the following areas ofinternal medicine: Critical care medicineCardiologyInfectious diseasesNeurologyRespiratory medicineRheumatologyEndocrinology and metabolism GastroenterologyGeneral Internal MedicineGeriatricsHematologyMedical oncologyClinical allergy and immunologyDermatologySource: Pathway evaluation program4
General informationIn addition to their medical work, internists also organize and co-ordinate their patient’s care andensure that they gain access to the care they need.After completing medical school, to become an internist requires additional training that takes4 years. Those who choose to subspecialize are required to complete 2 years of subspecialtytraining, which they can begin once completing the three core years of the internists program,for a total of 5 years of postgraduate education.For further details on training requirements please go to:Royal College of Physicians and Surgeons of CanadaCanadian Society of Internal MedicineSource: Pathway evaluation program5
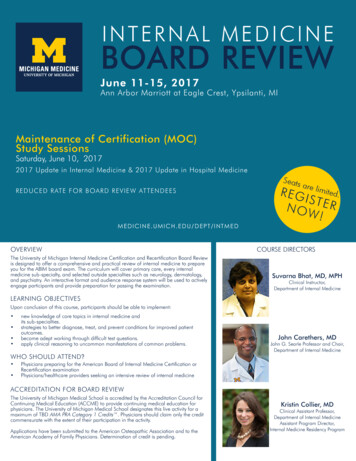
Total number & number/100,000 populationby province, 2019Province/TerritoryNewfoundland/LabradorPrince Edward IslandNova ScotiaNew ritish ColumbiaTerritoriesCANADASource: 2019 CMA Phys/100k pop'n8.07.17.55.410.38.76.76.68.28.00.88.66
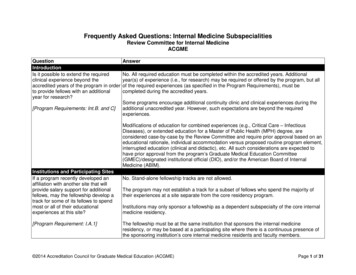
Number/100,000 population, 1995 to 20198.88.68.48.28.07.87.67.47.27.06.81995 1997 1999 2001 2003 2005 2007 2009 2011 2013 2015 2017 2019Source: 1995-2019 CMA Masterfiles7
Number by gender & year, 1995 to 03TotalSource: 2019 CMA ales8
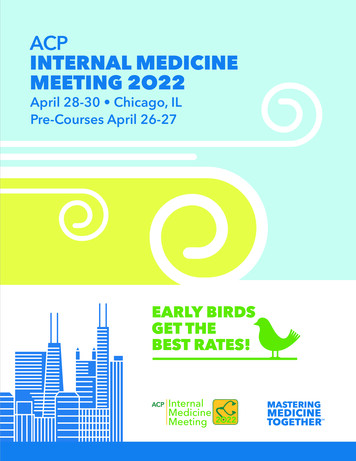
Percentage by gender & age, 2019GenderAge Group19%21%37%16%63%23%21%MaleFemale65 55 - 6445 - 5435 - 44 35Excludes those where gender or age is unknown.Source: 2019 CMA Masterfile9
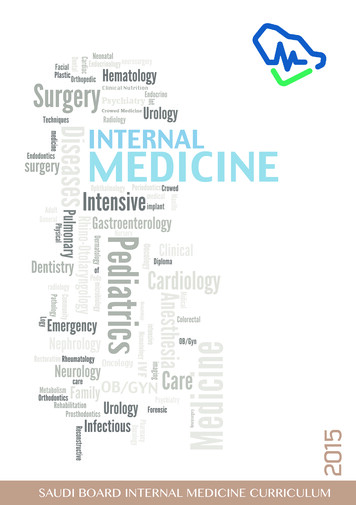
Number by gender & age, 201965 55-64[VALUE]50414545-5435-44 35355245412349352302331FemaleMaleExcludes those where gender or age is unknown.Source: 2019 CMA Masterfile10
Percentage by main work setting, 2019Academic Health Sciences Centre32%Community Hospital29%Private Office/Clinic22%Non-AHSC Teaching Hospital7%OtherFree-standing Walk-in ClinicCommunity Clinic/Health-centre3%2%1%Source: 2019 CMA Physician Workforce Survey. Canadian Medical Association11
Percentage by practice organization, 2017*3%16%Solo Practice8%6%Group PracticeInterprofessional PracticeHospital-based PracticeNR67%*Most recent available data for this specialtySource: 2017 CMA Workforce Survey. Canadian Medical Association12
Hours worked per week (excluding on-call), 2019ActivityHours worked per weekDirect patient care without teaching component23.0Direct patient care with teaching component9.2Teaching without patient care2.3Indirect patient care7.8Health facility committees1.0Administration2.7Research2.4Managing practice1.4Continued professional development2.0Other1.0TOTAL HOURS PER WEEK52.9Source: 2019 CMA Physician Workforce Survey. Canadian Medical Association13
On-call duty hours per month, 2019 73% provide on-call services On-call hours 110 hours/month On-call hours spent in direct patient care 55 hours/monthSource: 2019 CMA Physician Workforce Survey. Canadian Medical Association14
Percentage by remuneration methodPrimary payment method1 in 20170%Average gross payment per physician for InternalMedicine & subspecialties in 2017/18 (thoseearning at least 60,000) 437,000231%57%Average percent overhead reported by InternalMedicine specialists in 2017 21%37%* Other includes capitation, sessional, contract or other method5%12017 CMA Workforce Survey. Canadian Medical Association90% fee-for-service90% salary2National Physician Database, 2017/18, CIHI90% other*Blended32017 CMA Workforce Survey. Canadian Medical Association15
Professional & work-life balance satisfaction, 2019Balance of personal& professionalcommitmentsCurrentprofessional lifeNR27%10%26%48%13%Dissatisfied or very dissatisfiedSource: 2019 CMA Physician Workforce Survey. Canadian Medical Association78%NeutralSatisfied or very satisfied16
Number of retirees during the three year period of 2016-2018115103MaleFemale26211234 and Under12135-4445-5455-64165 and overUnknownTotalAge GroupSource: CMA Masterfile – year over year comparisonsNote: “Retired” is based on giving up licence and therefore excludes those who have retired from clinical practice but are still licensed;those younger than 45 may include physicians who have temporarily given up their licence but return to practice at a later date.17
Employment situation, 20175%2%1%32%Overworked in my disciplineEmployed in my discipline to my satisfactionUnderemployed in my disciplineNot employed in my disciplineNo response60%*Most recent available data for this specialtySource: 2017 CMA Workforce Survey. Canadian Medical Association18
Links to additional resources Association of Faculties of Medicine of Canada Canadian Institute for Health Information Canadian Medical Association’s Physician Data Centre Canadian Post-MD Education Registry (CAPER) College of Family Physicians of Canada National Physician Survey (2004-2014) Royal College of Physicians and Surgeons of Canada19
MEDICINE Table of Contents Slide General Information 3-5 Total number & number/100,000 population by province, 2019 6 Number/100,000 population, 1995-2019 7 Number by gender & year, 1995-2019 8 Percentage by gender & age, 2019 9 Number by gender & age, 2019 10 Percentage by main work setting, 2019 11