Transcription
The 2021 Belgian Stata ConferenceVirtual – Monday, June 7, 2021 (09:00-09:45)Machine Learningusing Stata/PythonGiovanni CerulliIRCrES-CNRResearch Institute on Sustainable Economic GrowthNational Research Council of Italy1
Machine LearningDefinition, relevance, applications2
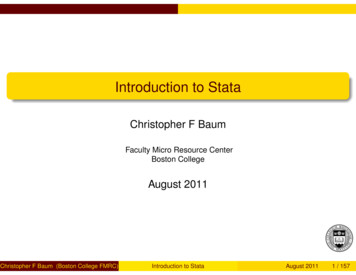
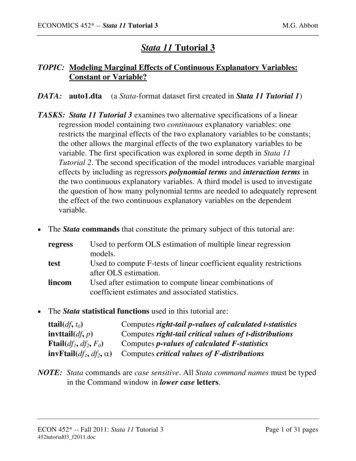
Growth of computer power (1971 - 2018)Plot ofTransistor counts forCPU by date of introduction3
What is Machine Learning ?Machine LearningA relatively new approach to data analytics, which places itself inthe intersection between statistics, computer science, and artificialintelligenceML objectiveTurning information into knowledge and value by “letting thedata speak”4
Machine learning taxonomyMachine ricaloutcomeCategoricaloutcomeGeneratedoutcome5
ML purposesLimitingprior assumptionsModel-freephilosophyBased on algorithmcomputation, graphicsMostly focused onprediction thaninferenceTargeted toBig DataTargeted to complexityreduction6
ML l-from-noiseextractionCorrect specificationvia model ing7
Machine Learning application examplesIdentifyingrisk factorsfor prostatecancerPredicting heartattack bydemographic,diet and clinicalmeasurementsCustomizingemail spamdetectionsystemPredict stockmarket pricevariationSelf-drivingcarsClassifyingpixels in aland-satelliteimagesEstablishing therelationshipbetween salaryand many of ocalrecognitionsystems(AmazonAlexa)8
MLprediction9
Train-MSE vs Test-MSETraining datasetN in-sample available observationsOverfitting as flexibility increasesTesting datasetM out-of-sample observationsTrue fitting accuracy10
Train-MSE overfittingTest-MSETrain-MSEo As long as model flexibility (i.e.,degree-of-freedom) increases, thetrain-MSE decreases monotonically.This phenomenon is calledoverfittingo On the contrary, the test-MSE firstdecreases, and then decreases, thusshowing a minimum11
Decomposition of the Test-MSETest-MSEVarianceof the specificML methodBias squareof the specificML methodVariance of theIrreducibleerror term12
The variance-bias trade-off------ Error varianceObserve that the error variancerepresents a lower boundfor the Test-MSE13
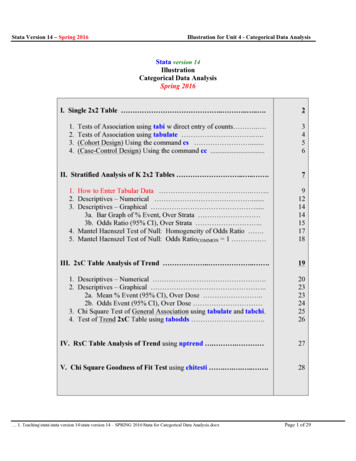
1936Timeline of Machine Learning methodsDiscriminant Analysis1957Neural Network(Fisher)(Rosenblatt)19951989Support Vector Machines(Cortes and Vapnik)Convolutional Neural Network(LeCun et al.)1967Nearest Neighbor Algorithm(Cover & Hart)1986Backfitting and GAMs(Hastie and et Selection(Breiman and Freedman)1976Classification and Regression Trees(Breiman and Meisel)1979Bootstrap(Efron)1995Boosting(Freund and Schapire)1996Lasso and Ridge Regression(Tibshirani)2001Random Forests(Breiman)2006Deep Learning(Hinton, Osindero, Teh)1996Bagging(Breiman)Source: Cerulli (2019)14
Machine Learning MethodsLinearNonlinearElastic nShrinkageParametricf(X) E(Y X)NonparametricGlobalPowerseriesPolynomialand nomialKernelK-NN15
Software16
SoftwareGeneral purposeML platformDeep LearningplatformDeep Learningplatform17
SoftwarePython/Stata fullyintegrated platform viathe SFI environmentVarious ML packages butpoor deep learninglibrariesPython Scikit-learn platformStatistics and Machine Learning ToolboxDeep Learning Toolboxc ml stata & r ml stata (by G. Cerulli, 2020)18
Implementation ofr ml stata & c ml stata19
Stata command r ml stataRegression20
Stata command c ml stataClassification21
Practicalimplementation(in 8 steps)22
Set the stageStep 1. Before starting, install Python (from version 2.7 onwards), and the Python packages scikit-learn, numpy, andpandas. If you want suggestion on how to install Python and its packages look here.Step 2. Once you have Python installed in your machine, you need to install the Stata ML command:. ssc install r ml stataand look at the documentation file of the command to explore its syntax:. help r ml stataStep 3. The command requires to provide a dataset with no missing values. It is your responsibility to assure this. We canthus load the training dataset I have prepared for this example:. use "r ml stata data example"This dataset contains one target variable (y) and 13 features (x1, x2, . , x13). All variables are numerical and thussuitable for running our regression tree.23
Before running the command a testing dataset must be provided This is a dataset made of the same features of the training one, butwith "new" instances. Observe that this dataset must neither containmissing values, nor include the target variable (y) Here,weconsidera"r ml stata data new example"testingdatasetcalled24
Step 4. We have now all the ingredients to run our regression tree. Wesimply run these lines of code in Stata:. r ml stata y x1-x13 , mlmodel("tree") in prediction("in pred")cross validation("CV") out sample("r ml stata data new example")out prediction("out pred") seed(10) save graph cv("graph cv")25
Meaning of the syntaxq"tree" tells Stata to run a "tree" regression. Other options are available (see the help-file)q"in pred" tells Stata to generate a dataset "in pred.dta" containing the in-sample predictions of theestimated model. They are the prediction only for the training datasetq"out pred" tells Stata to generate a dataset "out pred.dta" containing the out-of-sample predictionsof the estimated model. They are predictions only for the testing datasetq"r ml stata data new example" tells Stata to use this one as testing datasetq"seed(10)" necessary to replicate the same results and must be an integerq"graph cv" tells Stata to save the cross-validation results graph in your current directory26
Step 5. In order to access the main results, we can look at the command's "ereturn" list by typing:. ereturn ars:e(OPT LEAVES) 4e(TEST ACCURACY) .2027650052251946e(TRAIN ACCURACY) .8911061692860425e(BEST INDEX) --------------------------------------------We observe that the cross-validated (CV) optimal number of leaves (namely, the tree optimal final nodes) is 4,the CV optimal train accuracy is 0.89, while the CV optimal test accuracy is much smaller, i.e. 0.20. The accuracymeasure is the share of the total outcome variance explained by the model (it is closely similar to an adjustedR-squared)27
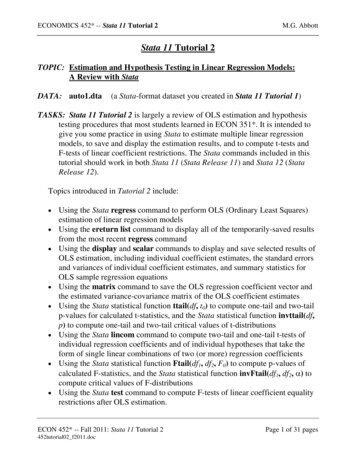
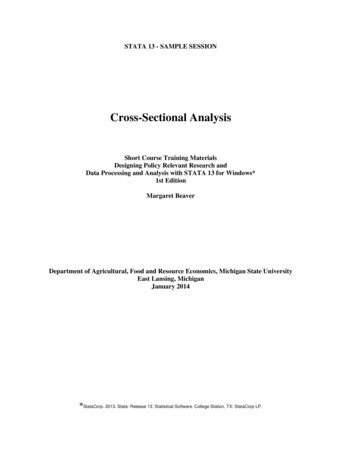
Step 6. The command provides a graphical representation of the 10-fold cross-validationwith the optimal grid search indexAt this index, the test accuracy is maximum (over the grid). It is also useful to observe theoverfitting pattern of the train accuracy going to one (maximum accuracy) as long as themodel complexity increases.This phenomenon justifies ML focus on just the test accuracy which shows, in this graph,a clear variance-bias trade-off.28
-.50Accuracy.51CV graphical representation051015IndexTEST ACCURACYLearner treeOptimal index 3TRAIN ACCURACY29
Step 7. We can go even deeper into the understanding of the cross-validation results, by opening the CV results' dataset"CV.dta" and list its content:. use CV , clear. listResults show, by every grid index, the train accuracy, the test accuracy, and thestandard error of the test accuracy estimated over the 10-fold runs.The standard error is important, as it measures the precision we get whenestimating the test accuracy. In this example, at the optimal index (i.e., 3), thetest accuracy's standard error is 0.74, which should be compared with thoseobtained from other ML algorithms.This means that the choice of the ML model to employ for prediction purposesshould ponder not only the level of the achieved test accuracy, but also itsstandard error.30
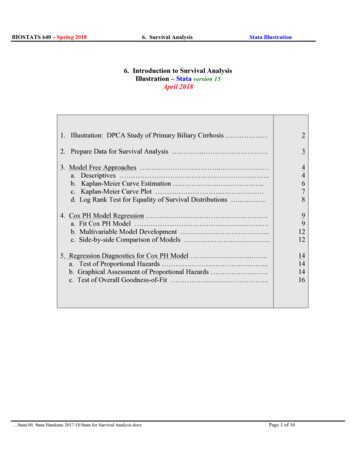
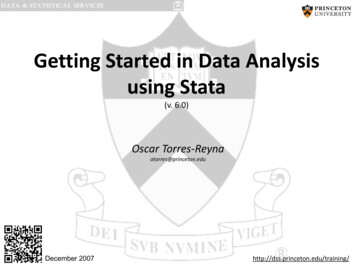
Step 8. Finally, we can have a look at the out-of-sample predictions. This can be done by opening andlisting the "out pred" dataset:. use out pred , clear. listWe observe that the predictions are made of only three values[21.62, 16.23, 27.42] corresponding to three out of the fouroptimal terminal tree leaves. Graphically it represents a stepfunction (omitted for the sake of brevity).31
Optimal tree (depth 4)32
Referencesq Cerulli, G. 2020. C ML STATA: Stata module to implement machine learning classification in Stata. Statistical are/bocbocode/s458830.htmq Cerulli, G. 2020. R ML STATA: Stata module to implement machine learning regression in Stata. Statistical are/bocbocode/s458831.htmq Cerulli, G. 2020. A super-learning machine for predicting economic outcomes, MPRA Paper 99111, University Library ofMunich, Germany, 2020q Cerulli, G. 2020. Improving econometric prediction by machine learning, Applied Economics Letters, Forthcoming.q Gareth, J., Witten, D., Hastie, D.T., Tibshirani, R. 2013. An Introduction to Statistical Learning : with Application in R. NewYork, Springerq Raschka, S., Mirjalili, V. 2019. Python Machine Learning. 3rd Edition, Packt Publishing.33
Machine Learning using Stata/Python 1 The 2021 BelgianStata Conference Virtual -Monday, June7, 2021 (09:00-09:45) Giovanni Cerulli . systems (Amazon Alexa) 9 ML prediction. 10 Train-MSEvs Test-MSE Trainingdataset Nin-sampleavailable observations Overfittingas flexibility increases