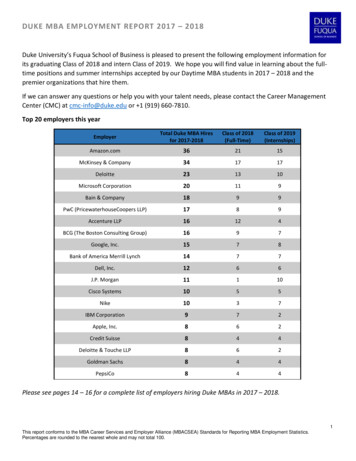
Transcription
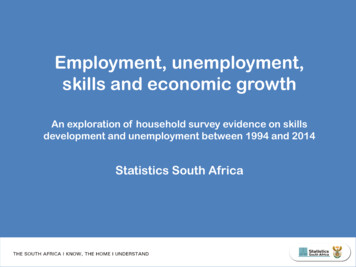
Employment, unemployment,skills and economic growthAn exploration of household survey evidence on skillsdevelopment and unemployment between 1994 and 2014Statistics South Africa
Overview
Exploration of skills within the South African workforceover the last 20 years, using data from: 1994: October Household Survey 2014: Quarterly Labour Force Survey Exploration of skills trends in terms of: Race Age
“The single most important investmentany country can makeis in its people.”National Development Plan
Economic growthGood times!7,5%The South African economy(2003-2014)Growth in GDP quarter-on-quarter (annualised)Currently slow economic conditionsin global economy, but domesticfactors as well. Is SA generating theskills necessary for economicdevelopment?First q/qcontractionsince 2009Recession
Occupational composition of thethree skill levels
Breakdown ofskill level sClerksSemiskilledSales & servicesSkilled agricultureCraftMachine operatorsElementaryLowskilledDomestic workers
How has the South Africanworkforce shifted in terms ofthese skill levels since 1994?
Trends in terms of race
Number of workers in the labourforce by race9%WhiteIndian /AsianThe highest growthwas experienced inblack n95%02 0004 0006 000('000)8 00010 00012 000
The proportion of black African workersin the labour force has also increasedsince 199419942014
How has the racial composition of each skill level changed?Within the skilled workforce , the proportions of all non-white race groups increased.
However, to see a more complete picture oftransformation, trends within race groups needto be explored
Percentage of workers within each race group who are skilled(managers, professionals, technicians)by 3% pointsby 11% pointsby 26% pointsby 19% points
Trends in terms of age
Black AfricanColouredIndianWhitePercentage of workers in each age group who are skilled (managers,professionals, 45-5435-4425-3415-24There were much weakergains in the black Africangroup for all 5-240%10%20%30%40%50%60%70%80%
Black AfricanColouredIndianWhitePercentage of workers in each age group who are skilled (managers,professionals, 45-5435-4425-3415-24The percentage ofworkers in skilledoccupations increased inall age and all racegroups, except for blackAfricans aged 25-34,which 5-3415-240%10%20%30%40%50%60%70%80%
What the data show in terms of skills
Gains in skilled employment from 1994 to 2014 Gains in black African employment from 1994 to 2014 Across population groups, the proportion of black African,coloured, and Indian/Asian workers within the skilled workforceincreased However, there was uneven distribution of progress withinpopulation groups. Within black African employment the growth inskills, as a proportion, was much lower than in the otherpopulation groups Within the black African 25-34 age group, the skilled proportion ofemployment decreased
Unemployment
The officialunemployment rate forSouth Africa increasedfrom22%in 1994 to25%in 2014
The expandedunemploymentrate for SouthAfrica was35%in both 1994 and2014
Labour market dynamics (1994 vs 2014)Number of individuals19942014ChangeChange (%)StrictEmployed (000)8 89615 0556 15969,2Unemployed (000)2 4895 0672 578103,4Labour force (000)11 38620 1228 73676,722%25% 3,3 % points-Unemployed (000)4 7078 1573 45073,3Labour force (000)13 60323 2129 60970,635%35%unchanged-Unemployment rateExpandedUnemployment rateThe number of employed has increased by 6,1 million since 1994. The number of unemployed (expandeddefinition) has increased by 3,4 million. The percentage growth of the unemployed (73,3%), however, hasbeen higher than the growth of the employed (69,2%).
Number of unemployed and unemployment rates by race (1994 vs 2014)8 00045%Number of unemployed (000)6 000The numbers ofunemployed haveincreased for all racegroups43%40%5 00040%35%30%28%4 00025%24%3 000199420141994rate2014rate2 00020%18%15%17%8%1 0007%10%5%0%0BlackAfricanColouredIndian /AsianWhiteUnemployment rate7 000
Number of unemployed and unemployment rates by highest level of education(1994 vs 2014)6 0005 00042%201419942014Number (000)4 00040%34%3 00028%45%Unemployment hasincreased for alleducational levels. Theunemployment rate forthose with tertiaryqualifications hasincreased from 6% to14%40%35%30%25%20%2 00014%15%10%1 0006%0Less than matricMatricTertiary5%0%Unemploymentrate1994
Unemployment rates for individuals by highest education level and race50%The unemployment rateamongst black Africanswho have a tertiaryeducation hasincreased. However, theunemployment rateamongst black Africanswith a matric lack African19942014ColouredLess than matric19942014Indian / AsianMatricTertiary19942014White
Index, Q1 2007 100; employment indices based on Quarterly Employment Statistics130Employment growth has been below real GDP growthin most Mar/12Real GDPMiningManufacturingTradeFinance and businessCommunity servicesMar/13ConstructionMar/14
Transition ratesFrom one quarter to the next quarter, average for 2010 to 2013From employmentFrom unemployed to unemployed orto employed (%) not economicallyactive (%)Total11,24,3Primary14,05,7Secondary not 2,9By highest education level:Secondary completedTertiaryBy age:
Unemployment rate by age (2008-2014)
Unemployment rate for the youth, by race (2008-2014)
Discouraged work-seekers (percentage of working age) (2008-2014)
Final remarks
NDP sees skills development as critical “SA has set itself the goals of eradicating poverty, reducinginequality, growing the economy by an average of 5,4%, and cuttingthe unemployment rate to 6% by 2030. Education, training andinnovation are critical to the attainment of these goals” (NDP: 2967). NDP enabling milestone: “ensure that skilled, technical,professional and managerial posts better reflect the country’sracial, gender and disability makeup” (NDP: 34) NDP critical action: “an education accountability chain, with linesof responsibility from state to classroom” (NDP: 34) “Improving the quality of education outcomes throughout theeducation system [is] one of the highest priorities over the next 18years, and beyond” (NDP: 133)
Inadequate education system – findings from the NDP NDP chapter 9: Improving education, training and innovation SA faces a low growth, middle income trap, characterised by: Weak competition for goods and services High unemployment Low savings A POOR SKILLS profile The quality of education for most black children is poor By the end of Grade 12, SA has lost HALF of every cohort enteringthe schooling system which wastes human potential and harms life-chances of ouryouth
Inadequate education system – findings from the NDP The post-school system is not well designed to meet our skillsdevelopment needs The performance of universities is uneven Further education and training (FET): too small, poor output, noteffective (65% of college students unable to find work experience) Problems with sectoral education and training authorities (SETAs): Poor governance Inadequate human resources Poor management No proper monitoring and evaluation No accurate records of beneficiaries and impact No linkages with the post-school sector
Why is our skills development not optimal? Apartheid legacy? Closure of teacher training colleges? Inappropriate merging of educational institutions? Outcomes-based education? Weak administration (e.g. delivery of school books)? Firms not willing to invest in training of employees? Other (e.g. role of parents)?
Conclusion The QLFS data strongly support the findings of the NDP that theeducation system is not adequately serving skills development, andis in urgent need of reform Weak GDP data since 2008 further support the NDP’s findings thata broad programme of reform needs to be implemented, with skillsdevelopment as one of its key features Employment growth between 1994 and 2014 was completelyinadequate to reduce unemployment, further raising the level ofurgency with which skills development should be treated
Thank you
Gains in skilled employment from 1994 to 2014 Gains in black African employment from 1994 to 2014 Across population groups, the proportion of black African, coloured, and Indian/Asian workers within the skilled workforce increased However, there was uneven distribution of progress within population groups.