Transcription
Quantitative trading andbacktesting28 July 2016CERN Finance Clubc.laner@cern.ch
Contents1) Introduce quantitative trading andbacktesting from a theoretical point of view2) Show how to implement in Python abacktesting environment for simple tradingstrategies2
Quantitative trading Also called systematic trading or algorithmic tradingCreates a set of rules to generate trade signals andrisk management of positions with minimal managerinterventionAttempts to identify statistically significant andrepeatable market behaviour that can be exploited togenerate profitsLow-frequency (weekly, daily) through to highfrequency (seconds, milliseconds.)3
Quantitative trading system Four major components of a quantitative tradingsystem:1) Strategy identification2) Strategy backtesting3) Execution system4) Risk management Focus on first two, last two won’t be covered here4
Strategy identification Research strategies in blogs, forums, journals, etc. Forexample: Journal of Investment Strategies Quantpedia.com Many more (GIYF)Many of these strategies are either not profitable anymoreor only slightly profitable (they get “crowded” or“arbitraged away”)Key to making them highly profitable is to build on them,e.g. adapt them to new market conditions or optimisetheir parameters5
Strategy identification Two main categories of strategies: Trend-following: Trades on momentum, i.e. on the basisof the slow diffusion of information Mean reversion: trades on the deviation of a stationarytime series (price or spread) from its expected valueRange of trading frequencies Low frequency trading (LFT): days-years High frequency trading (HFT): intraday Ultra high frequency trading (UHFT): secondsmillisecondsHigh frequency trading requires detailed knowledge ofmarket microstructure (how the order book and exchangework)6
Backtesting Once a strategy is identified, need to test its performanceusing historical data as well as out-of-sample data Data Many types: fundamental, OHLC, sentiment, news Many frequencies: intraday, daily Many instruments: equities, futures Many sources: many are expensive, but there are a few goodfree sources, e.g. Yahoo Finance, QuandlQualities of good data: Clean and accurate (no erroneous entries)Free of survivorship bias (see next slide)Adjusted for stock splits and dividends7
Backtesting BiasesBiases tend to inflate performance. A backtest is likely an upperbound on the actual performanceOptimisation bias Over fitting the data as a result of too many free parameters Strategy will fail with real dataLookahead bias Introduction of future information into past data e.g. using the day’s high/low, calculating a parameter usingdata that would not have been available at the timeSurvivorship bias Using only instruments which exist at present Companies that went bankrupt would have made yourperformance worse8
Backtesting Transaction costsBacktest performance is inflated if transaction costs are not modelledappropriatelyCommissions/fees A commission is paid to the broker for every transaction Bid-ask spread is also important, especially for illiquid instrumentsSlippage Price difference between time of trade signal and time of order fill Depends on the volatility of the asset and the latency between thetrading system, the broker and the exchange Especially important for HFTMarket impact Placing large orders can “move the market” against you May want to break the transaction into smaller chunks9
Execution and risk management The last two components of a quantitative trading systemwould entail a whole other talk. Very briefly:Execution systemGenerates trades in real timeProvides an interface to the broker (e.g. via an API)Risk managementDecides how to act on trade signalsControls leverageAssigns capital to trades or strategies as optimally aspossible10
Analysing performance Some common measures of performanceCompounded growth rate Usually annualised, gives the average annual returnVolatility Usually annualised, given by the standard deviation of annualreturns Measure of riskSharpe ratio Measure of reward/risk ratio Usually annualised and measured with respect to a benchmark b(e.g. risk-free rate or S&P500)11
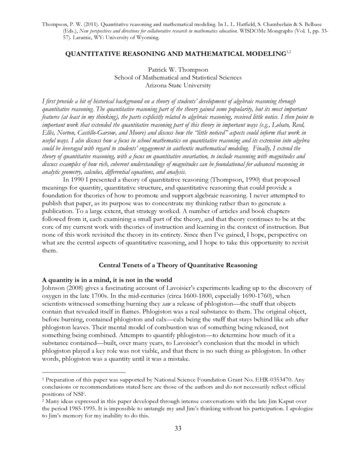
Analysing performance Some common measures of performanceDrawdown A period of time in whichequity is below the highestpeak so far Can calculate maximumdrawdown and maximumdrawdown duration Alpha, Beta Fit a straight line (security characteristic line) to strategy returnsagainst the returns of a benchmark (e.g. S&P or “the market”) Beta is the gradient – the variance/correlation with respect to themarket i.e. gives a measure of systematic risk (want beta 0) Alpha is the intercept – the excess return over the market, i.e. ameasure of performance (want large positive alpha)12
Python backtester Let’s put this into practice with PythonMy backtesting code: www.github.com/Xtian9/QuantCode * Disclaimer: Very simple and incomplete Feel free to use it or contribute!Makes use of pandas, numpy, and matplotlibEmploys vectorised calculations as opposed to an ‘eventloop’ (so less realistic as a simulation, but handy for doingquick research)* Inspired olio13
Python backtester Components of the backtesterData handler Downloads OHLC data from QuandlStrategy Generates signals for each day 1 long, -1 short, 0 cash (no position)Portfolio Generates/rebalances positions e.g. assign equal dollar weights to all assets Computes returns (potentially for risk management)Analyser Analyses the performance of the backtest e.g. equity curve, Sharpe ratio, etc.Still missing: transaction costs, risk manager 14
Moving average crossover Let’s look at a “hello world” example strategy Moving average crossover This is a momentum strategyStrategy rules: Create two simple moving averages (SMA) of a price series withdifferent lookback periods, e.g. 9 days and 200 days If the short MA exceeds the long MA then “go long” If the long MA exceeds the short MA then “go short”ShortLong15
Config file backtests/macross/macross cfg.py Choose trading parameters: tickers, dates, frequency, window lengths Initialise strategy, portfolio, analyser and backtest classes Run the backtest!16
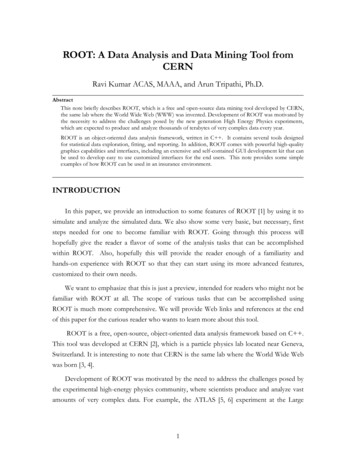
Data handler The DataHandler class fetches data from Quandl and returns apandas DataFrame of prices, e.g.The Backtest class then creates empty signals and weightsDataFrames that need to be filled by the Strategy andPortfoflio classes, respectively17
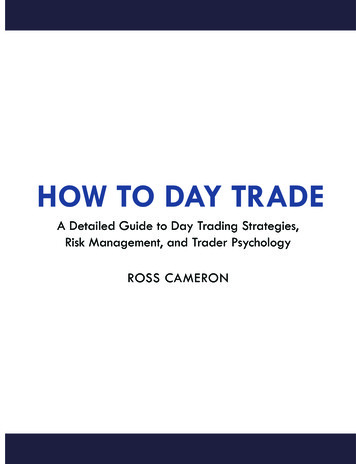
Strategy class strategies/macross.py Create a MovingAverageCrossoverStrategy that inherits from Strategy Implement a generate signals method that fills in the signalsDataFrame18
Portfolio class portfolios/equalweights.py Create a EqualWeightsPortfolio that inherits from Portfolio Implement a generate positions method that fills in theweights DataFrameIf weights sum to 1, total return of portfoflio is the weightedaverage of the assets’ returns19
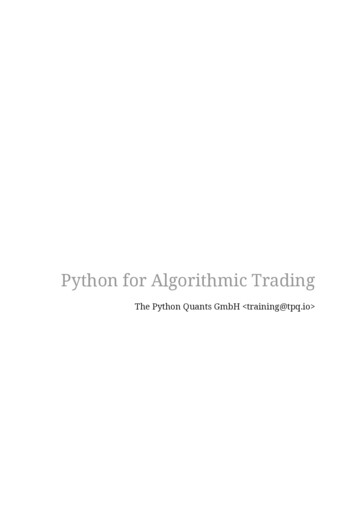
Analyser class analysers/performance.pyGeneric Analyser that computes performance measures likeSharpe ratio, drawdown etc. and makes performance plots likeequity curve etc.Can also create and add additional Analyser sub-classes to thebacktest20
Analyser class Performance plots21
Outlook Would like to expand on this to build a more sophisticatedquantitative trading system with many improvements: Event-driven backtesting Realistic handling of transaction costs Risk management framework GUI? Real time executionAs well as doing actual quant researchWould anyone like to work on this together? We could set up a quant trading or quant researcharm within the club22
Bibliography Michael H. Moorewww.quantstart.com Ernest P. Chan Quantitative Trading: How to Build Your OwnAlgorithmic Trading BusinessErnest P. ChanAlgorithmic Trading: Winning Strategies and TheirRationale23
Strategy identification Two main categories of strategies: Trend-following: Trades on momentum, i.e. on the basis of the slow diffusion of information Mean reversion: trades on the deviation of a stationary time series (price or spread) from its expected value Range of trading frequencies Low frequency trading (LFT): days-year