Transcription
WEBMOZIS – WEB-BASED AND MOBILE ZOO INFORMATION SYSTEM- A CASE STUDY FOR THE CITY OF OSNABRUECK Ulrich Michel, Christian Plass, Constanze Tschritter, Manfred EhlersUniversity of Osnabrueck, Institute for Geoinformatics and Remote Sensing (IGF), Germany –umichel@igf.uni-osnabrueck.deSeminarstr. 19 a/b, 49069 Osnabrueck, GermanyCommission IV, WG IV/5KEYWORDS: Spatial Database, Open Source, Pocket PC, Web Mapping, GIS, Content Management SystemABSTRACT:The use of modern electronic media offers new ways of (environmental) knowledge transfer. All kind of information can be madequickly available as well as queryable and can be processed individually.The Institute for Geoinformatics and Remote Sensing (IGF)in collaboration with the Osnabrueck Zoo, is developing a zoo information system, especially for new media (e.g. mobile devices),which provides information about the animals living there, their natural habitat and endangerment status. Thereby multimediainformation is being offered to the zoo visitors.The implementation of the 2D/3D components is realized by modern database andMapserver technologies. Among other technologies, the VRML (Virtual Reality Modeling Language) standard is used for therealization of the 3D visualization so that it can be viewed in every conventional web browser. Also, a mobile information systemfor Pocket PCs, Smartphones and Ultra Mobile PCs (UMPC) is being developed.All contents, including the coordinates, are storedin a PostgreSQL database. The data input, the processing and other administrative operations are executed by a content managementsystem (CMS).In contrast to the standard information often provided at thezoos by information boards or brochures, in our project thevisitor will be able to obtain a very comprehensive set ofinformation (texts, maps and multimedia elements such asphotos, audio and video streams) about the zoo’s specimens,which will significantly contribute to environmental education.Our software environment mainly consists of non-proprietarysoftware solutions, which will be used to develop a capable,reliable and flexible application. Within the system we willdevelop a 2D/3D zoo information system, available online, bymeans of modern mapserver technology and 3D visualizationprocedures such as VRML (Virtual Reality Modeling Language)(Michel, U. und T. Bockmühl, 2006). Furthermore, we will usea consistent database and a content management system (CMS)for data entry, processing and other data managementoperations.1. INTRODUCTIONThe use of modern electronic media offers new ways of(environmental) knowledge transfer. The possibility of userinteraction makes the exploration of certain topic moreattractive. The internet, nowadays one of the most importanttools for information delivery, is utilized by all majorinstitutions and business companies to reach a wide audience inthe most efficient, attractive and clear way. Unfortunately,websites are often limited to a preset of information. Thecontent of these websites is presented normally as texts orpictures, with little or no topicality. As a result, these websitesshow a lack of interactive elements. Furthermore, even“simple” options for systematic enquiries, such as text-basedsearch are deficiently implemented. Three-dimensional contentis virtually nonexistent in web presentations.This paper describes a new project of the Institute forGeoinformatics and Remote Sensing at the University ofOsnabrueck, funded by the DBU (Deutsche BundesstiftungUmwelt, www.dbu.de).All contents (including coordinates) are stored within theobject-relational database PostgreSQL, which supportsgeographic objects through the database extension PostGIS.The objects and their attributes can be easily administeredonline by the CMS and are displayed as well within an adaptedMapbender application. The combination of WebGIS and CMSis a very innovative and effective method for the project’spurposes. The interactive mapping application comprisesfundamental necessary GIS functions and allows thedigitalization of geo-objects that can be administeredimmediately by the CMS. It is no longer necessary to editattribute tables of geo-objects laboriously. The (geo)-data canbe updated at any time even by non-experts. All informationabout selected (geo)-objects can be generated dynamically sothat they are always up to date.One goal of this project is to develop a mobile zoo informationsystem for Pocket PCs and Smart phones (Michel, U., 2007).Visitors of the zoo will be able to use their own mobile devicesor borrow Pocket PCs from the zoo. The zoo informationsystem will provide additional multimedia-based informationsuch as audio material, animal video clips and maps of theirnatural habitat. To this end, we are currently collecting a largeamount of information, such as, species facts and characteristicsand any additional background information. Once theinformation is incorporated users will have access to the projectat the zoo via wireless local area network or by downloadingthe necessary files using, for example, their internet connectionat home.A three-dimensional zoo information system is a modern andinnovative way of external representation. Its technical839
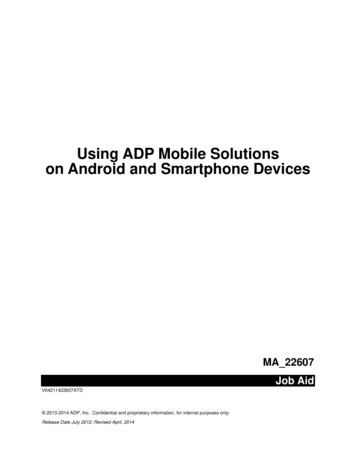
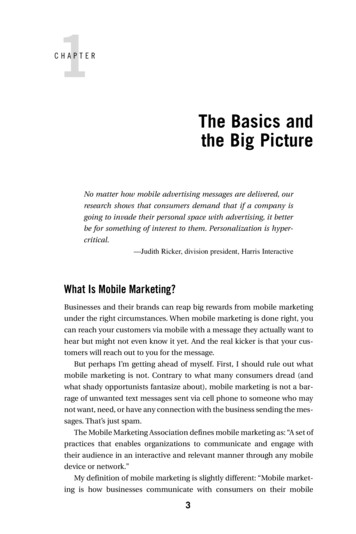
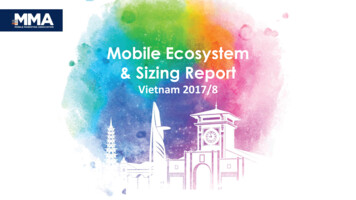
The International Archives of the Photogrammetry, Remote Sensing and Spatial Information Sciences. Vol. XXXVII. Part B4. Beijing 2008implementation is only one aspect of this. The key factor isultimately determined by the intention of institutions andcompanies to represent themselves as open-minded, modern andresourceful and in this context to let people partake in occurringevents and happenings. A virtual reality zoo provides aninformation platform for all interested visitors. Users haveaccess to current information and high-quality multimediamaterial. Web presentations with virtual reality content are stillvery uncommon. This is particularly based on the fact that thecreation of 3D worlds requires a great effort if not doneautomatically.The information to be offered to the zoo visitor will go beyondthe already existing information boards attached to the animalcages. The visitor will be able to access for example a mapdisplaying the natural distribution area of the animal, to seepictures of this area, short video clips showing the animal inaction and/or in his natural environment, hear animal sounds, orlisten to interviews with zoo keepers or veterinarians.4. SYSTEM COMPONENTS AND APPLICATIONSFigure 2 shows the general structure of the zoo informationsystems and its components.The project is ideally suited to enable zoo visitors to achieve anunderstanding of duties and responsibilities of zoologicalgardens and to create public awareness and interest inenvironmental issues.2. AREA OF INVESTIGATIONOur area of investigation is the zoo of the city of Osnabrueck inLower Saxony, Germany (Figure 1). Osnabrueck is the thirdlargest city in Lower Saxony with 164,000 inhabitants. It is theonly German city situated in a national park – the ‘UNESCOGeo park TERRA.vita’, which includes the Teutoburg Forestand the ‘Wiehengebirge’.Osnabrueck is a university and a diocesan town. The GermanFoundation for the Environment and the German Foundation forPeace Research are also based here. Osnabrueck is the culturalcentre of the western part of Lower Saxony and the vital centreof an economic region with around 780,000 inhabitants, whichincludes not only Lower Saxony but also parts of North RhineWestphalia. Its geographical location is 8 3’ 2” Longitude eastand 52 16’ 28” Latitude north.Figure 2. System components and applicationsThe core of the system is the content management system andits database underneath (see section 5). For accessing thesystem environment a conventional web browser could be used.This works not only on desktop PCs but also on mobile deviceslike Pocket PCs, Smartphone’s and Ultra Mobile PCs (UMPC),which could be connected by LAN or wireless via WLAN orUMTS. Our software environment mainly consists of nonproprietary software solutions, which will be used to develop acapable, reliable and flexible application. We will developwithin the system a 2D/3D zoo information system availableonline by means of modern mapserver technology and 3Dvisualization procedures such as VRML (Virtual RealityModeling Language). Furthermore, we will use a consistentdatabase and a content management system (CMS) for dataentry, processing and other data management operations.Figure 1. Area of investigation3. GOALSThe project goal is to test and apply new media forenvironmental education. In collaboration with the OsnabrueckZoo information about the zoo animals, their natural habitat andendangerment status are to be presented clearly. For thatpurpose two popular media types are used. On the one handinformation is presented in advance via a three-dimensionalweb-based tour to the zoo. On the other hand it is available viaa mobile electronic zoo guide during the visit.5. CMS – CONTENT MANAGEMENT SYSTEMThe in-house developed bilingual CMS for the administrationof the animal data (Figure 3) is the central part of the ZooInformation System. It is already installed on a server and in840
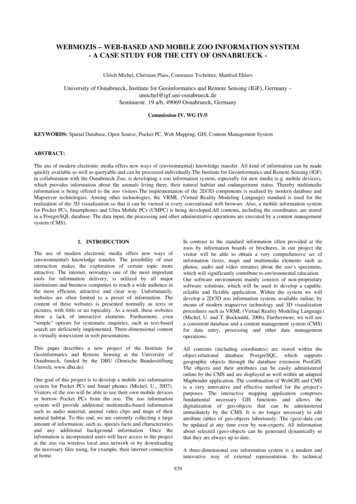
The International Archives of the Photogrammetry, Remote Sensing and Spatial Information Sciences. Vol. XXXVII. Part B4. Beijing 2008use. The PHP-based CMS allows the access and manipulationof the data stored in the spatial database PostgreSQL/PostGIS.6.23D VisualizationGoogle SketchUp is an efficient, intuitively-operated programto create complex 3D models. The basic version is free ofcharge. What makes SketchUp so special is its ability tointegrate three-dimensional objects directly into Google Earth.A previously selected image part in Google Earth can beimported to SketchUp in one step. In this process all spatialreferences are retained. In this way the 3D buildings - which areto be constructed - or any other three-dimensional objects canbe placed according to the air photo. The 3D models can beintegrated into Google Earth directly after their construction.The following Figure (Figure 6) shows the generation of thezoo main building with SketchUp.Figure 3. Content Management System6. PRESENTATION6.1Mobile ApplicationThe mobile zoo guide for PDAs (Figure 4) and an UMPCversion for disabled people (Figure 5) are currently indeveloping phase.Figure 6. Modelling the main building with Google SketchUpUp to now only the main building in the entrance area of theOsnabrueck Zoo has been modelled with SketchUp for testingand presentation purposes. The ground plan of this complexbuilding was extracted from a Google Earth air photo. Anespecially authentic look of the model was achieved by placingreal photo textures on all surfaces of the main building.Additionally, the roof textures were extracted from a highresolution air photo, whereas the textures for walls, doors andwindows were generated from pictures taken especially for thispurpose. For some areas of the building no realistic texturingcould be achieved, because the respective outside facades wereinaccessible or covered by vegetation.Figure 4. Mobile zoo guide for PDAAdditionally, the existing application is converted into anappropriate UMPC version for data acquisition purposes.The following Figure (Figure 7) shows the final model of thezoo main building in Google Earth.Figure 5. Zoo guide suitable for the disabledFigure 7. The model within Google Earth841
The International Archives of the Photogrammetry, Remote Sensing and Spatial Information Sciences. Vol. XXXVII. Part B4. Beijing 2008In the future other buildings of the Osnabrueck Zoo, e.g. theaquarium, will be modelled this way. SketchUp offers manypossibilities for this, for example, for the design of interiorrooms.6.2.1VRML with connection to the databaseAt present, a first 3D test scene was developed in VRML,which, among other things, will help to better estimate futurerequirements regarding file sizes, resolutions, accuracies andefforts. At the same time, this first scene is used for presentationpurposes, because it provides a preview, which alreadydemonstrates one important concept of the zoo informationsystem: the connection of a 3D object with the database.Figure 9. Africa panorama from birds viewThe VRML scene shows the so-called „Africa panorama“ withthe impalas, Masai ostriches, common Eland, Grevy’s zebras,giraffes and crested guinea fowl. In addition, a few trees andsome shrubs were integrated into the 3D scene as inventory.The user, who can move around the scene freely, can accessassociated information in the database by simply clicking on theanimals. The following screenshot (Figure 8) shows the 3Dscene in the left main window and the dynamically generatedanimal information in the right window. In this example thegiraffe is selected.6.2.2Embedded panoramic graphicsThe techniques of typical panoramic videos were used (Figure10) also for orientation and visualisation purposes. We use thistechnology not stand alone but embedded in our mapserverapplication. From there the user will be able to access thepanoramic videos by clicking on a given panoramic symbol.With this technique we are able to implement changes to thezoo’s environment very quickly. For example the zoo will havealso an underground zoo next year, which could be representedby panoramic views.Figure 8. VRML linked to the databaseFigure 10. Panoramic view of the monkey houseOne important goal in the design of interactive 3D worlds is tofind the best compromise between performance and visualquality. Another aim is a semi-automated generation of theVRML code, where the dimensions of the displayed objects,among other things, play a major role.6.36.3.12D VisualizationGeotaggingThe term geotagging (geocoding) is used, for instance, whenphotos are ‘tagged’ with coordinates. This can happen directly,when the photos are taken with a GPS camera or as a secondstep, when a GPS track is recorded in addition to photos takenwith a common digital camera (Figure 11).The current 3D scene, whose underground consists of an airphoto, is already true to scale, i.e. the animals are in proportionto each other and to the air photo. In this regard, there will beconsiderations concerning which objects are to be modelled andwhich not. For example there is an observation deck with tablesand chairs, which belongs to the Africa panorama. Although theintegration of such models increases the visual quality of the 3Dscene, their realization is time-consuming and they providevirtually no information content related to the project. Thefollowing Figure (Figure 9) shows the first version of theAfrica panorama from bird’s eye view. The non-textured greyitem is a test object, whose position corresponds to a part ofobservation deck.Figure 11. Geotagging operation modeThe digital photograph, containing information about its time oforigin can only incorporate coordinates if the time stamps ofcamera and the GPS track match (Figure 9). In this case theimage file can simply be extended to include the corresponding842
The International Archives of the Photogrammetry, Remote Sensing and Spatial Information Sciences. Vol. XXXVII. Part B4. Beijing 2008coordinates. For that purpose various software programs exist,often accessible free of charge. Geocoded photos can beembedded in Google Earth as a data layer in the form ofsymbols, whereas the corresponding pictures are displayed afterclicking the symbol. To realize this in Google Earth a folderwith these photos, as well as a KML file is necessary. In thiscontext, it is probably possible to implement a KML exportfrom the database because the KML file is a kind of text file.For that, all objects and pictures have to be geocoded.Geocoded photos from objects of varying categories (waste bin,bench, information board, miscellaneous, art / culture andanimal ), were previously generated to test possible fields ofapplication. Figure 12 shows different embedded data layers inGoogle Earth (left side), the associated symbols in thebackground of the main window, and a linked photo, whichopens after one of the symbols was clicked.Figure 13. 2D Web-Mapping7. CONCLUSIONThe new project of the Institute for Geoinformatics and RemoteSensing at the University of Osnabrueck, was funded by theDBU (Deutsche Bundesstiftung Umwelt, www.dbu.de).The information provided by our system to the zoo visitor isintended to represent a major step forward respect to the typicalinformation available in zoos, which up to now consists mainlyof boards attached to the animal cages and brochures. Byaccessing interactive maps displaying the location of theanimals in the zoo; and by, for example, watching short videoclips showing the animals in action and/or in their naturalenvironment, or listen to animal sounds, or to interviews withzoo keepers and veterinarians, the visitor is able to come intocloser contact with the animals and achieve a deeper andbroader knowledge of their biology.Figure 12. Geotagged objects and visualisation in Google Earth6.4Our software environment mainly consists of non-proprietarysoftware solutions, which will be used to develop a capable,reliable and flexible application (Michel et al, 2007b). Wedevelop a 2D/3D zoo information system available online bymeans of modern mapserver- and 3D-technology. We also useda spatial database and a content management system (CMS) fordata entry, processing and other data management operations.Web-MappingA major part of the project is dedicated to the 2D mappingapplication. The visualization principle of georeferenced data issimilar to that introduced in the previous section, but morecomplex. The data layers are displayed within an interactiveenvironment on the basis of an aerial or a satellite photo. Themapping application, which is based on the Open Sourceproduct Mapbender (www.Mapbender.org), goes far beyond thepossibilities of Google Earth (Michel et al, 2007a). Thisincludes the use of a high resolution air photo, which containsmore detail than the corresponding Google Earth image. Inaddition the displayed objects (species) are linked to a databaseand the application allows the recording of locations. Currentlythe map application can be launched from the CMS. Up to now,48 species are geocoded, i.e. they have assigned coordinates,which are transferred when the map application is invoked.Thus, the animal location can be displayed immediately. Assoon as the project is finished, we will have approximate 300species geocoded. The following screenshot (Figure 13) showsthe map application directly after it was launched by the CMS.In future developments we will have additional applications fordifferent purposes and specific user groups, such a as zoo staffmembers, handicapped people (by means of ultra mobile PCs,UMPC), and teachers or students.The project will be finished in April 2009 and its results andapplications will be openly available for their use.REFERENCESMichel, U. und T. Bockmühl, 2006. GIS and Remote Sensingfor 3D Urban Modelling by means of VRML Technology.Proceedings, SPIE Conference, Stockholm, Sweden, Vol. 6366.Michel et al, 2007a. Virtuell über den ganzen Campus. GISBusiness 5/2007, pp. 20-23.Michel et al, 2007b. WebGIS kostenlos. GIS-Business 1/2 2007,pp. 30-32.Michel, U., 2007. MoZis – Mobile Zoo Information System- Acase study for the city of Osnabrueck. Proceedings, SPIEConference, Firenze, Italy, Vol. 6749.843
The International Archives of the Photogrammetry, Remote Sensing and Spatial Information Sciences. Vol. XXXVII. Part B4. Beijing 2008844
Google SketchUp is an efficient, intuitively-operated program to create complex 3D models. The basic version is free of charge. What makes SketchUp so special is its ability to integrate three-dimensional objects directly into Google Earth. A previously selected image part in Google Earth can be imported to SketchUp in one step.