Transcription
HOW GREEN ARE ELECTRIC CARS?Gautam Kalghatgi versus Auke HoekstraThe Global Warming Policy FoundationOpen debate 1
How Green are Electric Cars?Gautam Kalghatgi versus Auke HoekstraOpen debate 1, The Global Warming Policy Foundation Copyright 2020, The Global Warming Policy Foundation
ContentsAbout the debaters iiiForeword vA critique of Hoekstra and Steinbuch 1Rebuttal by Hoekstra 9Response from Kalghatgi 25Concluding comments from Hoekstra 31About the Global Warming Policy Foundation 39About the debatersGautam KalghatgiGautam Kalghatgi is a fellow of the Royal Academy of Engineering, the Institute of MechanicalEngineers and the Society of Automotive Engineers. He is currently a visiting professor at OxfordUniversity, and has held similar professorial appointments at Imperial College, Sheffield University,KTH Stockholm and TU Eindhoven. He has 39 years of experience in combustion, fuels, engine andenergy research; 31 years with Shell and 8 years with Saudi Aramco.Auke HoekstraAuke Hoekstra is founder and director of the NEON research program, which compares the climateimpact of fossil and renewable technologies at the Eindhoven University of Technology. His firmZenmo Simulations models zero-emission energy and mobility. He wrote his first book on electriccars in 2008 and has been researching and writing about them ever since. Calculating the CO2emission of electric vehicles versus combustion engine vehicles is his speciality.iii
ForewordHow green are battery electric cars? Are they really greenerand more environmentally friendly than the cleanest conventional cars? That's a question that is dividing opinion,even among environmentalists. In a recent Guardian column, environmental activist George Monbiot warned thatelectric cars won’t solve the problems of car pollution:If, as a forecast by the National Grid proposes, the current fleetis replaced by 35m electric cars, we’ll simply create anotherenvironmental disaster.In early September, Thomas Ingenlath, the chief executiveof electric car company Polestar, acknowledged that electriccars are not clean, but that they are the future and will become cleaner:Electric cars are not clean. As the chief executive of an electriccar company I am not supposed to say that. Let me be clear,electric cars are the future. Electric cars offer a genuine routeto zero carbon impact, but it is time for honest analysis, toughquestions and some even tougher answers to ensure weachieve this goal. That is what I want to address today, callingfor the entire industry to become more transparent.Ingenlath warned that the public has been misled by policymakers and the car industry before, when diesel cars werepromoted as a green alternative to petrol:The fraudulent abuse of public trust in order to maximise profitability must rank as one of the most immoral actions everperpetrated by the automotive industry. Families bought diesel cars because they wanted to help protect the environment.They were lied to. That must never happen again.Lifecycle CO2 analysis of the environmental impact ofelectric vehicles – from the moment metals are mined, andmaterials produced for their manufacture, to the end of theirlives and the recycling and disposal of batteries and components – and comparisons to conventional cars remain highlycontentious. Thanks to their batteries, electric cars don'tneed to burn any fuel and therefore they emit no CO2 whiledriving. However, if the source of energy to power electriccars doesn't come from renewable or nuclear energy, theirindirect CO2 emissions will be much higher. In other words,if the electricity used to charge battery cars comes fromcoal or gas-fired power plants, as it does in most countriesaround the world, it doesn’t matter if electric cars are notemitting CO2 directly because this already happened, and inlarge amounts, in a conventional power plant.The process of producing a car includes the extractionand refinement of raw materials, which are then transportedand manufactured into numerous components, which are fi-
nally assembled in a car factory. While this process is more orless the same in both conventional and electric cars, the production of electric cars generate significant CO2 emissionsdue to the production of the batteries. These use materialssuch as lithium, nickel, cobalt or graphite, the mining andextraction of which can be energy-intensive and highly polluting. The number of battery electric cars needs to increaseat least 300-fold to replace all conventional cars. As theirnumber increases, can the world continue to ignore their impacts on human health, water requirements and eco-toxicityjust because these environmental impacts are exported tocountries where the mining takes place?That’s one of the reasons why the question of whetherelectric cars are greener or not remains contentious.Recently Auke Hoekstra and Professor Maarten Steinbuch published a study that claims electric vehicles alreadyemit less than half the CO2 of combustion engine vehicles.*Professor Gautam Kalghatgi wrote a critique of this newstudy, claiming that the advantages of electric vehicles weresmaller. We approached Mr Hoekstra with a request to reactto this criticism. Professor Kalghatgi in turn reacted to thatand we gave Mr Hoekstra the final word.Auke Hoekstra thinks the report he wrote simply presents straightforward facts and calculations that representthe findings of most academic research in this area and thathe rebutted all of Gautham Kalghatgi’s criticisms. GautamKalghatgi sees this differently and thinks Auke Hoekstrapaints the electric vehicle in much too positive a light. At theGlobal Warming Policy Foundation we encourage robustacademic discussion and in that light we present the entireexchange so readers can draw their own conclusions.The GWPF has no collective view on this question, butwe are keen to encourage and foster a culture of open andfact-based discussions on all aspects of climate and energypolicy. This is why we are very pleased to be publishing thefollowing exchange between two eminent researchers andhope readers will find the discussion informative, enlightening and encouraging.Benny PeiserDirector, Global Warming Policy FoundationHoekstra A and Steinbuch M, Comparing the Lifetime Greenhouse Gas Emissions of Electric Cars with the Emissions of Carsusing Gasoline or Diesel. Technical report, Technical Universityof Eindhoven, 2020. 649046englisch StudieEAutoversusVerbrenner CO2.pdf*v
A critique of Hoekstra and SteinbuchGautam KalghatgiIntroductionA report by Hoekstra and Steinbuch (hereafter ‘theauthors’), commissioned by the German Green Party,bends over backwards to show battery electric vehicles(BEVs) in the best possible light.1 It is full of criticisms ofother studies for being ‘unscientific’ or ‘influenced byoutside sources’.2 However, the authors do not seem torecognise that their own views are prejudiced and notvery objective; they have, perhaps, been doing theirvery best to please their sponsors! In fact, all availabletechnologies, including BEVs, need to be used sensiblyto improve the sustainability of the transport sector.Hyping up one technology – BEVs – while ignoring thevery serious barriers to its unlimited expansion and exaggerating the shortcomings of internal combustionengine vehicles (ICEVs) to get to the answer they seemto want, is not very helpful.This note outlines some of the problematic assumptions in the Hoekstra and Steinbuch paper, focusing on their comparison of the Mercedes C220d withthe Tesla Model 3. The final section outlines alternativecalculations, using perfectly plausible assumptions,which show that the difference between BEVs and ICEVs is very much smaller than claimed by the authors.Emissions from battery productionThe authors assume battery production is responsible for greenhouse gas emissions of 75 kg CO2eq/kWhof capacity. However, their source,3 which they quoteapprovingly elsewhere, actually suggests a range of61–106 kg CO2eq/kWh. Note, however, that these figures are for the future, when electricity generation,and hence the energy used for battery manufacture,is assumed to be free of fossil fuels. Currently, batterymanufacture, and mining and refining of the materialsinvolved,4 takes place in countries such as China andthe Democratic Republic of Congo, which are not going to decarbonise their energy systems anytime soon.For example, China accounts for 70% of global batteryproduction, and most of the processing of lithium andcobalt salts needed for lithium-ion batteries. And evenif batteries were manufactured with CO2-free energy inEurope, the embedded emissions would still be muchhigher than assumed by the authors – perhaps as highas 106 kg CO2eq/kWh – because of the emissions fromthe mineral extraction and processing in developingcountries.1
Overestimating battery lifeThe authors criticise an earlier paper by Buchal and Sinn,who had assumed a battery life of 150,000 km, suggestingthat a figure of 250,000 km should be used. However, Teslaguarantee the battery for a Model 3 BEV for 8 years.5 Let usassume that the average Tesla Model 3 does 10,000 miles annually, like the average British car.6,7 This is an overestimatebecause the average BEV would do less mileage because itwill drive shorter distances than the average ICEV. So in 8years, we should expect the average Tesla Model 3 to do little more than 80,000 miles or 129,000 km. This is the practical, realistic battery life, over which the embedded CO2 emissions should be distributed. In other words, Buchal and Sinnare much nearer the mark than the authors, who seem to expect the average BEV to last over 15 years, driving 16,000 kmannually.Carbon intensity of electricityEven if the electricity used by BEVs is generated from renewables, so that the carbon intensity is very low, the extraelectricity demand from BEVs has to be met with marginal(backup) electricity generation, which can quickly respondto changing demand. This usually relies on fossil fuels, especially if nuclear power is not in favour. The authors acceptthis fact, but then later dismiss it8 because it is ‘subjective’and launch into a long, subjective defence of their decision.However, this does not make them right. Notably, the average carbon intensity of the German grid, which uses a highproportion of renewables, is 469 g/kWh.9 Despite this, theauthors use a value of 250 g/kWh on the assumption thatelectricity grids will decarbonise in future. By the same argument, ICEVs will also get better over the years!Fuel consumption of ICEVsThe authors reject standard industry numbers for fuel economy and carbon dioxide emissions, preferring to use figuresthey say are from the US Environmental Protection Agency,although they do not give a direct reference to the figuresused, only citing a website, www.fueleconomy.gov. However, the vehicle they use as a comparator for the Tesla Model3, the Mercedes C220d, is not listed on that website. For theMercedes C220d, they assign a value of 228 gCO2eq/km fordriving emissions,10 compared to a maximum WLTP figurequoted by Mercedes of 151 gCO2eq/km.11 So the total emissions – i.e. manufacture and driving – for the C220d shouldbe only 183 gCO2eq/km rather than 260 gCO2eq/km.Ignoring wider impacts and costsWhile criticising others for ‘ignoring the larger system’, theauthors ignore or gloss over many issues that will becomeincreasingly important as the number of BEVs increases.2
These include in particular, the significant environmentaland human-health issues – worse for BEVs than for ICEVs –associated with mining and processing of materials.12,13 Justbecause these problems are exported from where BEVs areused does not mean that they are not important environmental issues.Then there are the large requirements for infrastructure,in terms of charging, electricity generation and distribution.As the number of BEVs increases, there are significant issues with electricity distribution at both micro and macrolevels and existing distribution infrastructure will need to berebuilt.14,15The authors also gloss over the challenges posed by recycling the batteries from EVs, which are considerable because of the weight and complexity of batteries. Currently,it is difficult to recover commercially useful material fromspent batteries, although the technology might improve.Fossil fuel production emissionsThere is a big push in the oil industry to improve energy efficiency and reduce/eliminate flaring. For instance, SaudiAramco have been steadily reducing flaring for at least twodecades. The result is that their upstream carbon intensity isnow only 4.6 gCO2eq/MJ, less than half the world average.16Using this best current value, the total CO2 emission for diesel comes to 3091 gCO2eq/litre, about 7% lower than the figure quoted by the authors.17Ignoring electrical lossesIf fossil fuel production efficiencies are to be considered forICEVs, the following must also be taken into account for BEVs transmission and distribution losses for electricity,which vary from 16% in low-income countries to 6% inhigh-income countries18 losses while charging the BEV battery, which amountto about 16%.19So the total efficiency for BEVs, from electricity production to charging, is only around 79% in rich countries, anoverall efficiency less than for diesel, including crude oil production and refining, even using the authors’ figures.20Future developmentsHoekstra and Steinbuch seem to think that there is no scopeto improve ICEVs. However, there is little doubt that withbetter combustion, control and after-treatment systems,and with partial electrification and weight reduction, fuelconsumption of gasoline engines can be reduced, perhapsby as much as 50%.21 Similarly, as discussed above, crudeproduction and refining can be expected to become moreefficient. Why do the authors assume such improvements3
will not happen?And as an aside, ICEVs may soon be seen as preferable toBEVs in terms of their non-greenhouse pollution standards.Modern (Euro VI) diesels can meet or beat the most stringentNOx standards and have negligible particulate emissions inreal driving conditions.21 And as ICEV exhaust managementsystems improve, particulates such as those released fromtyre wear become more important contributors to pollution.BEVs, because of their greater weight (because of the battery), will be worse for particulates.An alternative calculationOn what basis did the authors select the Tesla Model 3 andMercedes C220d for making their comparison? In this section, we show that it is easy enough to draw different conclusions by making other plausible assumptions. In otherwords, the authors' results are subjective.Table 1 reworks the calculations using the MercedesA220d Saloon and the Tesla Model 3 Long Range (75 kW).These two vehicles are used because they have comparabledimensions and the range of the Tesla, quoted at 320 miles,is more in line with that of the A220d. However, the kerbweight of the A220d is 1484 kg compared to 1847 kg for theTesla Model 3 Long Range. This is primarily because the Tesla’s battery weighs 480 kg.22Reasonable assumptions – different to those of Hoekstra and Steinbuch – are made about the emissions involvedin manufacture and use. These assumptions are as follows.For the battery, we assume 106 kg CO2eq/kWh of battery capacity to account for the fact that, in the future, mining and processing of metals will continue to take place incountries with high carbon intensity, even if final battery assembly/manufacture takes place in Europe, with fossil-freeelectricity. Tesla guarantees the Model 3 Long Range batteryfor eight years or 120,000 miles (192,000 km). We assume aten-year battery life and 16,000 km annual distance covered.So, the realistic, practical distance over which the embeddedbattery manufacture emissions can be distributed is takento be 160,000 km. Thus, emissions associated with batterymanufacture component is 49.7 gCO2 eq/km.We assume for this exercise that the manufacturingemissions, excluding those for the battery, are the same forboth vehicles.For driving emissions, we take the maximum WLTP figure quoted by Mercedes Benz of 143 g CO2 eq/km for theA220d Saloon.10As noted above, BEVs on average will be charged bymarginal (backup) electricity generation, which can quicklyrespond to changing demand. It is not credible that millionsof BEVs will charge only when they detect the electricity coming down the cable to be zero-carbon! This will probably be4
fossil-fuel based for many years in Germany, because nuclear energy is being phased out and ways to store renewableelectricity at scale are not viable. So, a more credible number(probably an underestimate) for the carbon intensity of theBEV charging grid is 500 g CO2 eq/kWh, slightly higher thanthe current average figure for Germany of 469 gCO2 eq/kWh.The combined city and motorway driving energy usefor the Tesla Model 3 is 240 Wh/mile or 149 Wh/km.23 Hencethe driving contribution is 74.5 gCO2 eq/km.We can also add end-of-life GHG emissions – the emissions associated with recycling and/or disposing of the materials used. For BEVs a figure of around 15 g CO2 eq/kWh isused,24 while for ICEVs, a figure for end-of-life emission of400–800 kg,25 and an assumption of a 200,000 km lifetimefor the Mercedes A220d, gives a result of 2–4 g CO2 eq/km.Table 1: Results of the alternative calculationICEVBEVMercedes A220dSaloonTesla Model 3Long Rangeg CO2 eq/kmg CO2 eq/kmManufacturing yclingTotalThe results are shown in Table 1.There are other very serious environmental and health impacts of BEVs which cannot be ignored as their numberincreases, as explained above. BEVs also require the development of significant new infrastructure for charging andelectricity generation and distribution. In the UK, the TeslaModel 3 Long Range is listed at around 47,000 and the Mercedes A220d Saloon, which can be refuelled in about fiveminutes using existing infrastructure, at around 31,000.5
Notes1. Hoekstra A and Steinbuch M, Comparing the Lifetime Greenhouse Gas Emissions of Electric Cars with theEmissions of Cars using Gasoline or Diesel. Technical report, Technical University of Eindhoven, 2020.2.See, for example, their p. 7.3. Emilsson E and Dahllöf L. Lithium-Ion Vehicle Battery Production. Technical report C 444, IVLSwedish Environmental Research Institute, 2019. 1070/1574923989017/C444.pdf.4.Notably lithium, cobalt and graphite.5. Dow J. ‘Tesla now covers degradation in Model S/X warranty — but leaves software loophole’. Electrek,2 February 2020. ranty-70-capacity-150k-mile/.6. Statista. Distribution of the average annual mileage of all motorists in the United Kingdom (UK) in 2017and 2018. Statista, September 2018. mileage-of-motorists-in-the-united-kingdom-uk.7. Although the authors quote on p. 12 that the average European car does 13,202 km, or 8200 miles,annually.8.See p. 16.9.Country specific electricity grid greenhouse gas emission factors. Carbonfootprint.com, June 2019.10. See table on p. 5.11. Mercedes. WLTP fuel consumption and emission values. p-fuel-consumption-and-emission-values/. WLTP refers to the Worldwide Harmonised LightVehicle Test Procedure, a standardise way of measuring fuel economy.12. Electric Vehicles from Life Cycle and Circular Economy Perspectives. Report No 13/2018, European Environment Agency. -EN-N%20TERM%202018.pdf.13. Commodities at a Glance: Special issue on strategic battery raw materials.14. Muratori M. Impact of uncoordinated plug-in electric vehicle charging on residential power demand.Nature Energy 3(3).15. Travers M. The Hidden Cost of Net Zero: Rewiring the UK. Briefing 48, The Global Warming Policy Foundation, 2020.16. The figure is shown on p. 23 of the report, presumably taken from the ref. 44.17. See their p. 22.18. Electric power transmission and distribution losses (% of output). World Bank. S.19. DOE: 77%-82% of energy put into an electric car is used to move the car down the road. Green Car Congress website, 5 September 2018. fotw.html20. 2670/3310. See p. 22.21. Leach F et al. The scope for improving the efficiency and environmental impact of internal combustionengines. Transportation Engineering 2020;1: 100005.22. Incidentally, on average, 500 times this weight or 240 tons, of rock will have to be removed to extractthe materials needed to make the battery. See Mills M. Mines, minerals, and “green” energy: a reality check.Manhattan Institute, 9 July 2020. -and-green-energy-reality-check.23. The Worldwide Harmonised Light Vehicle Test Procedure. dard-Range#: :text a%20traditional%20petrol%20car.24. Romare M and Dahllöf L. The Life Cycle Energy Consumption and Greenhouse Gas Emissions from Lithi-6
um-Ion Batteries. Technical report, C 243, IVL Swedish Environmental Research Institute, 2017.25. Nakano K and Shibahara N. Comparative assessment on greenhouse gas emissions of end-of-life vehicles recycling methods. Journal of Material Cycles and Waste Management 2017; 19: 505–515.7
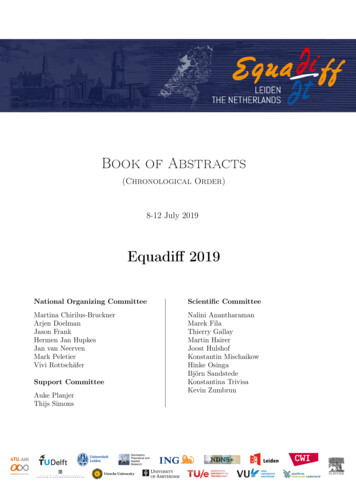
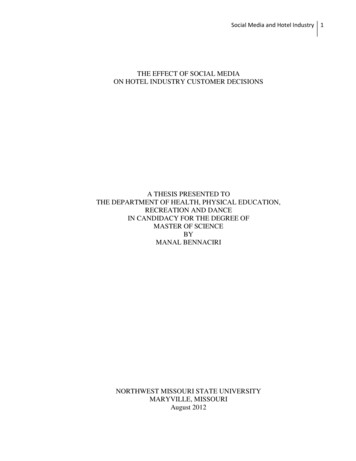
Rebuttal by HoekstraAuke HoekstraSummaryMr Kalghatgi challenges our scientific integrity and assumptions but ignores that we published this information beforewithout sponsoring and that each of our assumptions is wellsupported by multiple sources. He on the other hand forgets toinclude entire emission categories and makes up assumptionswith little or no sourcing.I will react to Mr Kalghatgi’s response using his section titlesand will refer to him as GK. I will summarise first (in italics),followed by a quote from GK and rebuttal from me.IntroductionWe did not bend over backward to please our sponsor as evidenced by the fact that I had already published almost exactlythe same results before in a scientific journal.Regarding GK’s suggestion that ‘they have, perhaps, beendoing their very best to please their sponsors!’, I would liketo point out that before I wrote this study, I had been making exactly the same points for years on Twitter and that Iwrote an unsponsored article for the scientific journal Joule– requested by the editor at the start of 2019 – in which Ipointed out exactly the same errors and came to the sameconclusions (with some minor updates due to new studiesappearing in 2020).1 Figure 1 shows the title and abstract,and Figure 2 the table, with the main conclusions, so you canjudge for yourself.Figure 1: Abstract from my paper in Joule.Now that we have conclusively established that we reachedalmost the same results before we were sponsored to dothis study, making the entire accusation of changing themto suit our sponsors baseless, I would like to make two further points.9
Figure 2: Key emissions datafrom my paper in Joule. First: we were asked to reformat our existing researchin a way better suited to the discussion on the topic inGermany. Never were we asked to reach a certain conclusion, only to present our earlier research. This we did. Second: GK joined Saudi Aramco in 2010 after 31years with Shell and all his publications are on combustion engines. If anyone is vulnerable to ad-hominemattacks that imply his standpoints are due to ‘bendingover backwards’ for sponsors instead of having scientific integrity, it would be him. That someone with sucha fossil-fuel background implies that it is our scientificintegrity that is lacking, without even taking the troubleof establishing that we had previously reported similarresults (which would have been obvious after a quickGoogle search) is not smart in my opinion.But let’s forego any more mudslinging and concentrate onthe facts and arguments.Emissions from battery productionGK misunderstands the one source he claims we use, and ignores the other seventeen. He then picks the highest value ofthat one source, without supporting this choice by sources.Statement by GK‘However, their source,2 which they quote approvingly elsewhere, actually suggests a range of 61–106 kg CO2eq/kWh.’RebuttalWe cite that range of 61–106 ourselves. So, the use of theword ‘actually’ seems out of place here. Furthermore, wediscuss a total of 18 sources in some depth,2–19 not one. Wecriticise many of them (mostly by pointing out that the values used are based on outdated manufacturing practices),but we cite at least six of them approvingly (to use the term10
adoped by GK)2,4,5,17–19 and point out that even sources wecriticise agree that most of the carbon reduction stems fromimproved production processes in larger factories.15 GK onlypoints to emissions from the electricity generating system,but if you do the maths, scaling up is even more important.Statement by GK‘Note, however, that these figures are for the future, whenelectricity generation, and hence the energy used for batterymanufacture, is assumed to be free of fossil fuels.’RebuttalThis is simply wrong. As Emilsson and Dähllof state in theirsummary: ‘Based on the new and transparent data, an estimate of 61–106 kgCO2eq/kWh battery capacity was calculated for the most common type, the NMC chemistry. Thedifference in the range depends mainly on varying the electricity mix for cell production.’2So only the lower end of the scale (the value of61 kgCO2eq/kWh) is for a future where the factory uses renewable energy. And this fact was clearly communicated inthe summary.Furthermore, we are actually pretty critical of Emilssonand Dähllof (since it is the follow up to a study that wasbroadly maligned as being unrealistically pessimistic), whichis why we take so much time to explain how it differs fromother studies and why we supplement it with five othersources that we consider more thorough and which usemore recent data.Statement by GK‘Currently, battery manufacture, and mining and refining ofthe materials involved, takes place in countries such as Chinaand the Democratic Republic of Congo, which are not goingto decarbonise their energy systems anytime soon. For example, China accounts for 70% of global battery production, andmost of the processing of lithium and cobalt salts needed forlithium-ion batteries.’RebuttalGK seems to be confusing battery production with mining,since Congo is only relevant for cobalt mining. The artisanmines in Congo, the working conditions of which are rightlycriticised, hardly have a problem in being fossil-fuel powered, since they use human muscle, pickaxes, and buckets.Furthermore, GK and I were both comparing the dieselvehicle to the Tesla Model 3, and Tesla actually publishedbattery manufacturing emissions for their battery production plant. So it is encouraging that the value we use for2020 (based on multiple sources) comes very close to thevalue Tesla reported for 2019.11
Anticipating this ‘but China’ argument – which we haveheard often before – we included two sources in our studythat looked at battery production in China specifically andthey underscore our point,4,5 not GK’s. It’s a shame he seemsto have missed that.Statement by GK‘And even if batteries were manufactured with CO2-free energy in Europe, the embedded emissions would still be muchhigher than assumed by the authors – perhaps as high as106 kgCO2eq/kWh – because of the emissions from the mineral extraction and processing in developing countries.’RebuttalGK seems to misunderstand the one source that he uses.2 Heseems to think that the entire range of 61–106 kgCO2eq/kWhpertains to production with emission free energy. Insteadthis is just the case for the lowest number. Apart from that,GK does also not defend taking the highest value from thisrange of one source. All in all I think that he should study thetopic more closely before attacking others.Overestimating battery lifeGK confuses warranty with lifetime, and makes up an exampleinstead of using reliable sources as we did.Statement by GK‘The authors criticize an earlier paper by Buchal and Sinn, whohad assumed a battery life of 150,000 km, suggesting that afigure of 250,000 km should be used. However, Tesla guarantee the battery for a Model 3 BEV for 8 years.5 Let us assumethat the average Tesla Model 3 does 10,000 miles annually, likethe average British car.6,7 This is an overestimate because theaverage BEV would do less mileage because it will drive shorter distances than the average ICEV. So in 8 years, we shouldexpect the average Tesla Model 3 to do little more than 80,000miles or 129,000 km. This is the practical, realistic battery life,over which the embedded CO2 emissions should be distributed. In other words, Buchal and Sinn are much nearer the markthan the authors, who seem to expect the average BEV to lastover 15 years, driving 16,000 km annually.’RebuttalThat the Tesla guarantee is less than the assumed lifetimeis irrelevant. No car gives a guarantee on any part (e.g. themotor) that is anywhere close to the lifetime. GK simply assumes an electric vehicle drives less than average and willfail once the guarantee is up. This is laughingly simplistic.We quote multiple sources to back up our claim that modern batteries easily outlast the lifetime of the car.20–23 GK onlyhas his ‘but that can’t be true because they would last longer12
than the warranty’ argument. We showed a detailed analysis of European data to come up with an average car lifetime(something GK doesn’t even attempt to improve or commentupon), an approach that was groundbreaking the first time wepublished about it,1 and which has now been corroborated bya new and very extensive study by Rica
They were lied to. That must never happen again. Lifecycle CO 2 analysis of the environmental impact of electric vehicles - from the moment metals are mined, and materials produced for their manufacture, to the end of their lives and the recycling and disposal of batteries and compo - nents - and comparisons to conventional cars remain highly