Transcription
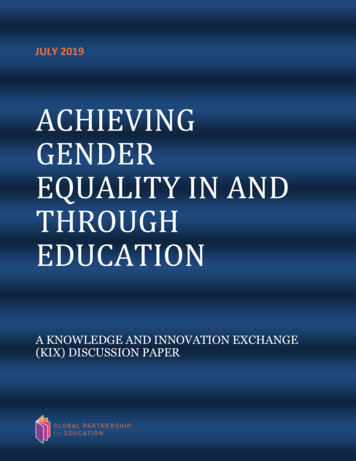
Gender Differences inNeeding and Taking LeaveJane Herr, Radha Roy, Jacob Alex Klerman November 2020Using data from the 2018 Family andMedicalLeaveAct(FMLA)Employee Survey, this paper explorespatterns of needing and taking leavefrom work for a family or medicalreason—either for one’s own health,or to care for someone else. i The 2018FMLA Employee Survey asks USemployees about their need for leavefor a family or medical reason,whether they took leave, and theirexperiences while on leave—all forthe twelve months prior to the survey. iiThis paper begins by exploringpatterns in needing and taking leavebetween women and men. iii It thenexplores how these patterns varybetween single and partnered women.Differences by GenderThe need for leave from work for afamily or medical reason often varieswith employees’ demographics—forinstance, their age, parental status, andwhether they are a single parent.AmongUSemployees,thecharacteristics of male and femaleemployees are generally similar(Exhibit 1). For instance, male andfemale employees are on average thesame age, and approximately the samepercentage have children under age 18living in the household. However,compared to employed men, a higherpercentage of employed women aredivorced, separated, or widowed, and ahigher percentage are heads of a singleparent household. iv Male and femaleKey Findings Compared to men, more women need leave (24 percentversus 17 percent) and take leave (18 percent versus14 percent). Yet more women than men still have unmet need for leave(9 percent versus 6 percent). Women and men need and take leave from work for thesame reasons. Among all leave needers, approximately50 percent need leave for their own health, 30 percent tocare for someone else, and 20 percent for a new child. The average length of women’s leaves is longer thanmen’s (34 days versus 21 days), primarily because womentake longer leaves for a new child (54 days versus18 days). While on leave, substantially fewer women than menreceive full pay (32 percent versus 55 percent), and morereceive no pay (41 percent versus 25 percent). Thesedifferences are not exclusively driven by women takinglonger leaves. Among women, single and partnered women take leave atthe same rate (approximately 18 percent), and take equallylong leaves (approximately 33 days), but more singlewomen take leave for their own health (60 percent versus46 percent). Compared to partnered women, more single womenreceive no pay while on leave (52 percent versus33 percent), and more lose their job because of takingleave (15 percent versus 3 percent).About the 2018 FMLA SurveysIn 1993, the United States Congress passed the Family andMedical Leave Act (FMLA), updating it in the years since. Tounderstand how employees and employers understand andexperience the FMLA, the U.S. Department of Labor surveyedemployees and employers in 1995, 2000, 2012, and 2018.The present paper is part of a series of publications onfindings from the 2018 FMLA Surveys conducted by AbtAssociates, including Results from the 2018 Surveys,Methodology Report for the 2018 Surveys, and GenderDifferences in Needing and Taking Leave.Gender Differences in Leave
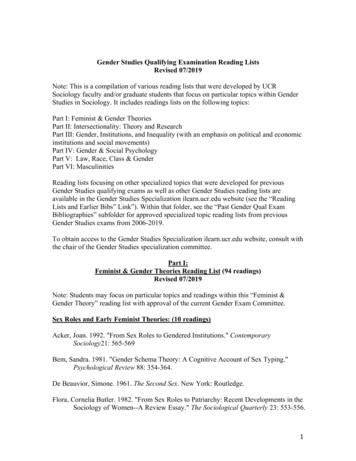
employees also vary by race; compared to employed men, a higher percentage of employed womenare African American.Exhibit 1. Percentage of US employees by selected demographic characteristics, by gender*/** difference statistically significant at the 5%/1% level. Percentages may not add to 100 percent due to rounding.Source: 2018 Family and Medical Leave Act (FMLA) Employee SurveyLeave Needed and Taken for aFamily or Medical ReasonExhibit 2. Percentage of employees who need,take, and have unmet need for leave, by genderCompared to men, more women needleave from work for a family or medicalreason; that is, for one’s own serious healthcondition, to care for a new child (by birth,adoption, or foster placement), or to carefor another individual with a serious healthcondition (24 percent versus 17 percent,Exhibit 2). v Consistent with more need forleave, more women take leave from workfor a family or medical reason (18 percent**/* difference statistically significant at the 1%/5% level.versus 14 percent). Yet despite takingSource: 2018 Family and Medical Leave Act (FMLA)leave at higher rates than men, moreEmployee Surveywomen still have unmet need for leave fora family or medical reason—namely, a higher percentage of employed women than men do nottake leave when leave is needed (9 percent versus 6 percent).2
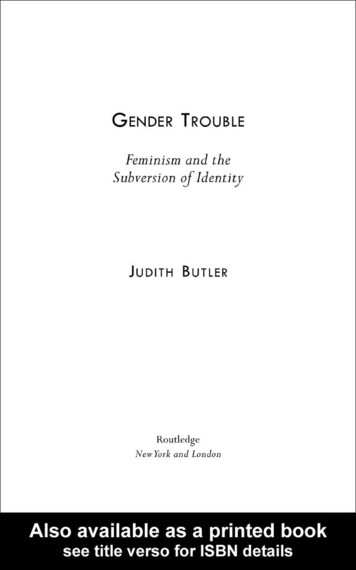
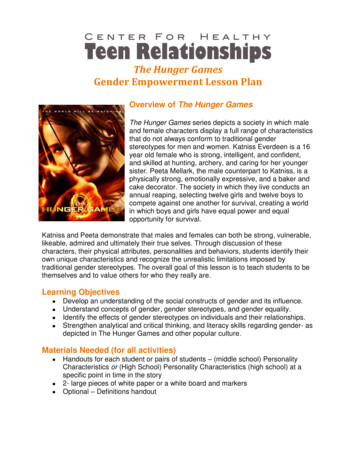
Unlike the rates of needing and taking leave, women and men have similar reasons for leave (seeExhibit 3 for reasons among all employees who needed leave). vi Approximately half need and takeleave for their own illness. An almost equal percentage of women and men also need and takeleave for a new child, vii and to care for a child with a serious health condition (4 percent and 5percent, respectively, results not shown).Exhibit 3. Percentage of leave needers by reason for needing leave, by gender1Ownillness includes all serious health conditions except those related to pregnancy or miscarriage.for or bonding with a newborn, a newly adopted child, or a newly placed foster child, and miscarriage and pregnancy-related own serioushealth conditions.3To care for another person with a serious health condition, including a respondent’s child, spouse, parent, other family member, or anunrelated person.2CareSource: 2018 Family and Medical Leave Act (FMLA) Employee SurveyAlthough women and men take leave for the same reasons, women take substantially longer leavesthan men, on average 34 days versus 21 days (Exhibit 4). This difference is driven almostexclusively by the difference in length of leave taken for a new child. On average, women take54 days of leave from work for reasons related to a new child, three times longer than men (18 daysfor a new child). There is a smaller difference in length of leave for own illness (32 days amongwomen versus 25 days among men), and no difference for leaves taken to care for another person.Exhibit 4. Average length of leave in business days, overall and by reason, by gender**/* difference statistically significant at the 1%/5% level.Source: 2018 Family and Medical Leave Act (FMLA) Employee Survey3
Pay Received While on LeavePay while on leave differs strongly bygender, and is not only driven bydifferences in leave length. viii Across allleaves, substantially fewer women thanmen receive full pay while on leave (32percent versus 55 percent, Exhibit 5), andsubstantially more receive no pay (41percent versus 25 percent). In part, fewerwomen receive full pay because on averagethey take longer leaves, and for bothgenders fewer of those taking longer leaves(41 days or more) receive full pay thanthose taking shorter leaves (10 days orfewer). Yet even for the shortest leaves (10days or fewer), fewer women than menreceive full pay (52 percent versus 73percent) and more receive no pay (39percent versus 20 percent). Note, however,that among the longest leaves (41 days orlonger), more women than men receivepartial pay (53 percent versus 31 percent).Exhibit 6. Percentage of leave takersreporting degree of difficulty makingends meet among those receiving lessthan full pay, by gender*/** difference statistically significant at the 5%/1% level.Source: 2018 Family and Medical Leave Act (FMLA)Employee SurveyExhibit 5. Percentage of leave takers receivingfull, partial, or no pay, by gender*/** difference statistically significant at the 5%/1% level.Percentages may not add to 100 percent due to rounding.Source: 2018 Family and Medical Leave Act (FMLA)Employee SurveyAmong leave takers who receive less than fullpay while on leave, more women report financialdistress than men. While almost half of menreport that it is as easy to make ends meet asbefore leave (47 percent, Exhibit 6), only 21percent of women report this. Conversely,almost three quarters of women report that it ismore difficult to make ends meet, with more thana third reporting that it is much more difficult.4
Women and men use different methodsto make up for lost earnings while onleave. More women than men borrowmoney (39 percent versus 25 percent,Exhibit 7), put off paying bills (35percent versus 20 percent), and go onpublic assistance (20 percent versus 7percent).Exhibit 7. Percentage of leave takers that usereported methods to cover reduced earningsamong those receiving less than full pay, by genderDifferences by Women’sPartner StatusThis section considers patterns in leaveneeding and taking among women bytheir partner status. Women areclassified as “partnered,” that is part ofa dual-adult family, if they report that*/** difference statistically significant at the 5%/1% level.Source: 2018 Family and Medical Leave Act (FMLA) Employee Surveythey are living with a partner (whethermarried or not); women are classified as“single,” that is part of a single-adult family, if they report that they are never married, separated,divorced, widowed, or are married with their partner living outside of the household. ix Exhibit 8shows demographic characteristics by women’s partner status. Among the employed, compared tosingle women, partnered women are on average older, have more children under age 18 living athome, and a lower percentage are African American.Exhibit 8. Percentage of female US employees by selected demographic characteristics, bywomen’s partner status*/** difference statistically significant at the 5%/1% level. Percentages may not add to 100 percent due to rounding.Source: 2018 Family and Medical Leave Act (FMLA) Employee Survey5
Among women there is no difference by partner status in the rates of needing leave, taking leave, orhaving unmet need for leave (Exhibit 9). However, compared to partnered women, more singlewomen need and take leave for their own illness (see Exhibit 10 for reasons for needed leave).Although single and partnered women take leave for different reasons, on average they take leaves ofthe same length (34 days among partnered women, 33 days among single women, results not shown).Exhibit 9. Percentage of women who need, take, Exhibit 10. Percentage of female leave needersand have unmet need for leave, by partner status by reason for needing leave, by partner statusSource: 2018 Family and Medical Leave Act (FMLA) EmployeeSurveyAmong women there are significantdifferences by partner status inreceipt of pay while on leave.Although an approximately equalpercentage receive full pay,compared to partnered women,fewer single women receive partialpay (20 percent versus 33 percent,Exhibit 11), and substantially morereceive no pay (52 percent versus33 percent). These differences aredriven largely by those taking longleaves (41 days or longer).Among those who receive less thanfull pay, more single women reportfinancial distress than partneredwomen. Substantially more singlewomen report that it is “much moredifficult” to make ends meet while* difference statistically significant at the 5% level.Source: 2018 Family and Medical Leave Act (FMLA) EmployeeSurveyExhibit 11.Percentage offemale leavetakers receivingfull, partial, orno pay, bypartner status*/** differencestatistically significantat the 5%/1% level.Percentages may notadd to 100 percentdue to rounding.Source: 2018 Familyand Medical Leave Act(FMLA) EmployeeSurvey6
on leave (50 percent versus 24 percent, Exhibit 12), while more partnered women report that it isonly “somewhat more difficult” (49 percent versus 26 percent). Fewer single women thanpartnered women use savings put aside for the leave (31 percent versus 49 percent, Exhibit 13),and more borrow money (51 percent versus 31 percent).Exhibit 12. Percentage of female leave takersreporting degree of difficulty making endsmeet among those receivingless than full pay, by partner statusExhibit 13. Percentage of female leave takersthat use reported methods to cover reducedearnings among those receiving less than fullpay, by partner status*/** difference statistically significant at the 5%/1% level.Percentages may not add to 100 percent due to rounding.Source: 2018 Family and Medical Leave Act (FMLA) EmployeeSurvey* difference statistically significant at the 5% level.Source: 2018 Family and Medical Leave Act (FMLA) EmployeeSurveyFinally, among all female leave takers, moresingle women than partnered women reportthat they lost their job because of taking leave(15 percent versus 3 percent, Exhibit 14).xExhibit 14. Percentage of all female leavetakers who experience negative effectsfrom taking leave, by partner statusSummary of FindingsThis paper explores differences by gender, andamong women by partner status, in theexperiences of needing and taking leave fromwork for a family or medical reason. Thisanalysis shows that women and men need andtake leave from work for the same reasons. Yet*/** difference statistically significant at the 5%/1% level.more women than men need leave.Source: 2018 Family and Medical Leave Act (FMLA)Employee SurveyFurthermore, although more women take leavethan men, a higher percentage of women alsoforgo taking leave when it is needed. Women also take much longer leaves, driven primarily bythose taking leave for a new child: maternity leaves are on average three times longer than paternityleaves.7
Compared to men, women also face a larger financial loss when taking leave, and this differenceis not driven exclusively by long maternity leaves. Single women also face greater financialpenalties than partnered women, as well as greater career penalties for taking leave.ReferencesNavaie-Waliser, M., A. Springs, and P. H. Feldman, “Informal Caregiving: DifferentialExperiences by Gender,” Medical Care, V. 40(12): 1249-1259.Neal, M., B. Ingersoll-Dayton, and M. Starrels, 1997, “Gender and Relationship Differences inCaregiving Patterns and Consequences Among Employed Caregivers,” The Gerontologist, V.37(6): 804-816.Patten, E., 2015, “How American parents balance work and family life when both work,” PewResearch Center, November 4, 2015Parker, K. and W. Wang, 2013, “Modern Parenthood: Roles of Moms and Dads Converge as theyBalance Work and Family,” Pew Research Center, March 14, 2013In the 2018 FMLA Employee Survey “family and medical reasons” include the following four reasons for needingleave from work: (1) To address an employee’s own serious health condition, including miscarriage/pregnancy-relatedreasons; (2) To care for or bond with an employee’s new child (by birth, adoption, or foster placement); (3) To carefor an immediate family member (child, spouse, or parent) with a serious health condition; and (4) To care for anindividual who is not an immediate family member with a serious health condition. The first three reasons qualify forprotection under the Family and Medical Leave Act; the fourth does not. A “serious health condition” includes acondition that lasted more than three days and required treatment by a health care provider, a condition that requiredan overnight hospital stay, or a long-lasting condition for which one must see a health care provider at least twice ayear for treatment. See the glossary of the Results from the 2018 FMLA Surveys for additional technical details on keydefinitions. The survey was fielded from March 2018 through February 2019. The survey collected information oninstances of needing or taking leave from work for family or medical reasons, not instances of taking an FMLAprotected leave.iThe weighted survey response rates for the 2018 FMLA Employee Survey were 5.8 percent for cell phones,5.5 percent for landlines, and 5.5 percent for the web. The results reported here apply survey weights developed toprovide a sample that matches the U.S. population of adults (aged 18 ) who are employed for wage/salary in theprivate sector or a public agency, excluding the self-employed. See the Methodology Report for the 2018 Surveys andthe Results from the 2018 FMLA Surveys for more detail.iiResearch finds that over time men are performing more hours of unpaid care for other individuals—both of children(Parker and Wang, 2013) and of older adults (Neal et al., 1997). Nevertheless, it remains true that women performsubstantially more hours of unpaid care than men (Patten, 2015, Navaie-Waliser et. al, 2002). This paper exploreshow these gender differences in caring for others translates into patterns of needing and taking time off from work forcaring responsibilities.iiiSingle parents include employees with children under age 18 in the household who report that they are never married,divorced, separated, widowed, or married with their spouse not living in the household. Partnered parents are thosewho report that they are married with their spouse living in the household, or living with a partner.ivThroughout this paper, all reported differences are significant at the 5 or 1 percent level, indicated with one or twostars, respectively. Results in exhibits with no stars are not significantly different across groups.vviReasons for leaves among the subset of employees who take leave are also almost identical by gender and are notshown in the exhibit.8
Among all employees who need leave for a family or medical reason, among both women and men approximately20 percent need leave to care for a new child, and 30 percent need leave to care for another person (Exhibit 3). Becauseemployees are more likely to take leave if it is needed for a new child, among the subset of employees who take leave,an almost equal percentage take leave for a new child and to care for someone else (25 percent and 24 percent,respectively).viiSources of pay include paid sick or vacation time, temporary disability pay, or paid family or medical leave injurisdictions where this is offered. Leaves taken under FMLA are unpaid, but employees may take accrued paid timeoff while on leave.viiiNote that respondents classified as “single” may live with other adults (e.g., a parent or a roommate), and some maybe part of a couple but not living with their partner; for these purposes, the analysis only considers cohabiting romanticpartners. These classifications are defined based on a question about marital status which included the followingresponse categories: married, living with a partner, separated, divorced, widowed, or never married. If a respondentwere both divorced and living with a partner, this person would be classified based on which of these two responseswas reported: “partnered” if she reported “living with a partner” and “single” if she reported “divorced.”ixAmong all leave takers, an approximately equal percentage of women and men report losing their job or losing jobseniority because of taking leave.xSuggested citation for this brief: Herr, J., Roy, R., & Klerman, J. A. (2020). Gender Differences in Needing and Taking Leave.Produced for the U.S. Department of Labor, Chief Evaluation Office. Rockville, MD: Abt Associates Inc.Other reports in the Employee and Worksite Perspectives of the FMLA study series include Executive Summary for Resultsfrom the 2018 Surveys; Results from the 2018 Surveys; Supplemental Results from the 2018 Surveys; Methodology Reportfor the 2018 Surveys; Methodology Report Appendices for the 2018 Surveys. All briefs and final reports from this series areavailable online: etedstudiesThis project was funded, either wholly or in part, with Federal funds from the U.S. Department of Labor’s Chief EvaluationOffice under Contract # DOLQ129633231/DOL-OPS-16-U-00141. The views expressed are those of the authors and shouldnot be attributed to DOL, nor does mention of trade names, commercial products, or organizations imply endorsement of thesame by the U.S. Government.9
women take leave for their own health (60 percent versus 46 percent). Compared to partnered women, more single women receive no pay while on leave (52 percent versus 33 percent), and more lose their job because of taking leave (15 percent versus 3 percent). About the 2018 FMLA Surveys .