Transcription
About FICCIEstablished in 1927, FICCI is one of the largest and oldest apex business organizations inIndia. FICCI's history is closely interwoven with India's struggle for independence,industrialization and emergence as one of the most rapidly growing global economies.FICCI has contributed to this historical process by encouraging debate, articulating theprivate sector's views and influencing policy.POTENTIAL OF PLASTICS INDUSTRY INNORTHERN INDIA WITH SPECIAL FOCUS ONPLASTICULTURE AND FOOD PROCESSING -2014A report on plastics industryA not-for-profit organization, FICCI is the voice of India's business and industry.FICCI draws its membership from the corporate sector, both private and public, includingMNCs; FICCI enjoys direct and indirect membership of over 2,50,000 companies fromvarious regional chambers of commerce and through its 70 industry association.FICCI provides a platform for sector specific consensus building and networking and is thefirst port of call for Indian industry and the international business community.Our VisionTo be the thought leader for industry, its voice for policy change and its guardian foreffective implementation.Our MissionTo carry forward our initiatives in support of rapid, inclusive and sustainable growth thatencompasses health, education, livelihood, governance and skill development.To enhance the efficiency and global competitiveness of the Indian industry and to expandbusiness opportunities both in domestic and foreign markets through a range ofspecialized services and global linkages.For details contactKnowledge &Strategy Partner
POTENTIAL OF PLASTICS INDUSTRY INNORTHERN INDIA WITH SPECIAL FOCUS ONPLASTICULTURE AND FOOD PROCESSING -2014A report on plastics industryKnowledge &Strategy Partner
Federation ofIndian Chambersof Commerce and IndustryFederation HouseTansen MargNew Delhi 110001T 91 11 2335 7364F 91 11 2332 9369E i.comSidharth BirlaPresidentIndustry’s Voice for Policy ChangeA report onPlastics Industry
CONTENTI.Executive summary . . . . . . . . . . . . . . . . . . . . . . . . . . . . . . . . . . . . . . . . . . . . . . 03II.Introduction . . . . . . . . . . . . . . . . . . . . . . . . . . . . . . . . . . . . . . . . . . . . . . . . . . . . 05III. Plastic industry in India . . . . . . . . . . . . . . . . . . . . . . . . . . . . . . . . . . . . . . . . . . . 07IV. Plastics applications in Agriculture. . . . . . . . . . . . . . . . . . . . . . . . . . . . . . . . . . . 17V.Plastics applications in Food Processing . . . . . . . . . . . . . . . . . . . . . . . . . . . . . . 21VI. Factors promoting opportunity in Northern India . . . . . . . . . . . . . . . . . . . . . . 24VII. Challenges for plastics industry in Northern India . . . . . . . . . . . . . . . . . . . . . . 251. Addressing environmental myths . . . . . . . . . . . . . . . . . . . . . . . . . . . . . . . . . 252. Technology needs . . . . . . . . . . . . . . . . . . . . . . . . . . . . . . . . . . . . . . . . . . . . . 253. Price pressure . . . . . . . . . . . . . . . . . . . . . . . . . . . . . . . . . . . . . . . . . . . . . . . . 26VIII. Recycling & Waste Management of plastics . . . . . . . . . . . . . . . . . . . . . . . . . . . 27IX. Conclusion . . . . . . . . . . . . . . . . . . . . . . . . . . . . . . . . . . . . . . . . . . . . . . . . . . . . . 29X.References . . . . . . . . . . . . . . . . . . . . . . . . . . . . . . . . . . . . . . . . . . . . . . . . . . . . . 31XI. About Tata Strategic. . . . . . . . . . . . . . . . . . . . . . . . . . . . . . . . . . . . . . . . . . . . . . 32Tata Strategic Contacts . . . . . . . . . . . . . . . . . . . . . . . . . . . . . . . . . . . . . . . . . . . . . . . 33About FICCI. . . . . . . . . . . . . . . . . . . . . . . . . . . . . . . . . . . . . . . . . . . . . . . . . . . . . . . . . 34Knowledge &Strategy PartnerA report onPlastics Industry
Table of FiguresFigure 1 : Per capita plastic products consumption (Kg/person) . . . . . . . . . . . . . . 5Figure 2 : Polymer utilization by application, FY13 . . . . . . . . . . . . . . . . . . . . . . . . . . 6Figure 3 : Demand growth of plastics ('000 TPA), CAGR, FY08-13 . . . . . . . . . . . . . 8Figure 4 : Demand breakup of plastics by types, FY13 . . . . . . . . . . . . . . . . . . . . . . . 8Figure 5 : India - Region wise plastic consumption, 2013 . . . . . . . . . . . . . . . . . . . . 10Figure 6 : Indicative list of some end use industries in Northern India . . . . . . . . . 10Figure 7 : Production Capacity and Operating efficiency of plastics, FY13 . . . . . . . 11Figure 8 : Plastic production capacities in Northern India . . . . . . . . . . . . . . . . . . . 13Figure 9 : Demand-supply scenario of plastics, FY13. . . . . . . . . . . . . . . . . . . . . . . . 14Figure 10 : Import-export scenario of plastics (in KT), Fy13 . . . . . . . . . . . . . . . . . . . 15Figure 11 : Exports of value added plastic products (Bn USD). . . . . . . . . . . . . . . . . 15Figure 12 : Product wise breakup of plastic product exports in 2012-13 . . . . . . . . . 16Figure 13 : Potential growth in Agriculture-GDP (in Rs. Cr.) through . . . . . . . . . . . 20Plasticulture, FY13Figure 14 : Food processing segments (% share). . . . . . . . . . . . . . . . . . . . . . . . . . . . 21Figure 15 : Growth projections for food processing sector (USD billion) . . . . . . . . 21Figure 16 : Plastics in flexible packaging (% share) . . . . . . . . . . . . . . . . . . . . . . . . . . 22Figure 17 : Indian packaging industry growth projection (USD billion). . . . . . . . . . 22Figure 18 : Plastic recycling flow diagram . . . . . . . . . . . . . . . . . . . . . . . . . . . . . . . . . 27Table 1 : Classification of plastic products by type of process. . . . . . . . . . . . . . . . . 9Table 2 : Production Capacity of plastics by major players, FY13 . . . . . . . . . . . . . . 12Table 3 : Major Plasticulture Applications . . . . . . . . . . . . . . . . . . . . . . . . . . . . . . . . 17Table 4 : Polymers used in Plasticulture applications . . . . . . . . . . . . . . . . . . . . . . . 18Table 5 : Region specific agriculture issues . . . . . . . . . . . . . . . . . . . . . . . . . . . . . . . 19Table 6 : Potential benefits from Plasticulture applications . . . . . . . . . . . . . . . . . . 19Knowledge &Strategy PartnerA report onPlastics Industry
PrefaceManish PanchalCharu KapoorP S SinghPractice Head - Chemical & EnergyTata Strategic Management GroupManish.panchal@tsmg.comPrincipal - ChemicalsTata Strategic Management Groupcharu.kapoor@tsmg.comHead- Chemicals & ration of Indian Chambers of Commerce & Industry (FICCI) & TATA Strategic ManagementGroup (TSMG) have been regularly tracking the petrochemicals industry and supportingcompanies, both big and small, across various chains to achieve business excellence. The sameknowledge and experience gives us an additional advantage to realize this report.Accelerated globalization, rapid change in technology and growing consumerism have broughtwith it sweeping changes and abundant opportunities for petrochemical companies to growlocally and globally. Significant investments are coming up in India in this sector in the next fewyears. For example, Reliance is planning to invest USD 8 billion over next four years inpetrochemical projects. Indian Oil is investing USD 1.3 billion in setting up petrochemicalcomplex at Paradip refinery. Besides these, four PCPIR's are under various stages ofdevelopment which will further improve the petrochemical landscape in India. In addition, lowplastics consumption (per capita basis) in India compared to many developed nations, offers aplatform for immense growth.Historically, major percentage of the population in northern India has been engaged inagriculture. Though the land is very fertile and supplied with abundant water, the farmers arestill affected with the problems of low productivity and low return on investment primarily dueto heavy dependence on monsoons. Going forward, plasticulture applications has the potentialto offer them the much needed solutions to improve productivity and reduce dependence onmonsoons and therefore will drive demand for plastics.As per industry estimates, 35-40% of the food products produced in India are wasted due todeficient infrastructure and lack of food processing capabilities. Plastics find applications inpackaging which protects the longevity and quality of food. This sector in India also offerssignificant potential for growth leading to increase in demand for plastics.We sincerely thank all industry leaders whose valuable inputs have helped in developing thisreport. As always it was an insightful experience for the team to materialize this report. Wehope it acts as a guiding light both for the players and the consumers of plastics.Knowledge &Strategy PartnerA report onPlastics Industry01
1Executive SummaryPlastic industry is making significant contribution to the economic developmentand growth of various key sectors in the country such as: Automotive,Construction, Electronics, Healthcare, Textiles, and FMCG etc. Its demand hasbeen growing rapidly at 10% CAGR to reach 10 MnTPA by FY13. India is currently netimporter of PolyEthylene (PE), however with the commissioning of IOCL plant atPanipat, the imports are expected to go down significantly.India observes significant regional diversity in consumption of plastics with WesternIndia accounting for 47%, Northern India for 23% and Southern India for 21%. Bulk of theconsumption in Northern India is from end use industries of Auto, packaging (includingbulk packaging), plasticulture applications, electronic appliances etc. which areconcentrated mostly in UP and Delhi- NCR ( 50%). However, plastic processing in otherparts like Rajasthan, Punjab, Haryana, Uttarakhand, J&K and Himachal Pradesh areexpected to grow based on increased availability of feedstock and higher focus onmanufacturing sectors.Northern India is said to have an inherent disadvantage of being away from ports hencea difficult target for low cost supply of plastics through import. However this samesituation makes the domestic plastic processing more competitive and providessignificant opportunity. Current low levels of per capita consumption (9.7 Kgs) alongwith increased growth in end use industries could propel the growth of plastics inNorth India further. Plastics application in agriculture can also lead to huge monetarybenefits as well as improve the overall productivity. Besides Plasticulture can also be agood answer to the falling water table in North India. Additionally, full potential ofplastics in food processing is yet to be tapped and that can help in meeting the foodand nutrition security of the nation.Knowledge &Strategy PartnerA report onPlastics Industry03
Indian Plastic industry faces environmental myths and lacks in technology. Goingahead recycling & reuse of plastics could be a foremost step towards fosteringinnovation and sustainability. Also increased awareness through help of industrygroups and Government could help address some of these challenges.Knowledge &Strategy Partner04A report onPlastics Industry
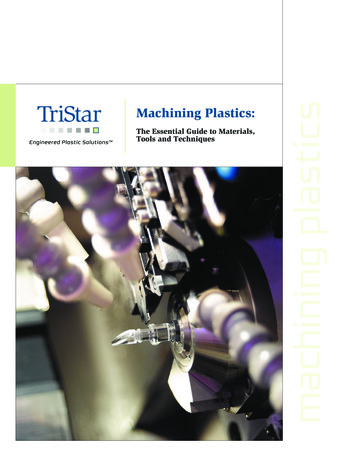
2IntroductionThe chemical industry is critical for the economic development of any country.Indian chemical sector accounts for 13% of the gross value added by theindustries segment. With Asia's increasing contribution to the global chemicalindustry, India emerges as one of the focus destinations for chemical companiesworldwide. Chemical industry is critical for the economic development of any countryas it offers products and solutions for virtually all sectors of economy.The chemical industry in India currently stands at USD 115 Bn in FY13 and is expected togrow at 8% p.a. over the next 5 years. Indian petrochemical industry which includesthe end products like polymers, synthetic fibers, surfactants etc. constitute 20% i.e. USD 23 Bn market.Petrochemical products permeate the entire spectrum of daily use items and coveralmost every sphere of life like clothing, housing, construction, furniture, automobiles,household items, agriculture, horticulture, irrigation, packaging, medical appliances,electronics and electrical etc. These industries hence drive the demand growth ofpetrochemicals. Current low per capita consumption level of plastic products ascompared to developed countries per capita consumption suggests that India offers ahuge opportunity over long term (Refer Figure 1).Figure 1: Per capita plastic products consumption urce: PlastIndia, Business Press, Research by Tata StrategicKnowledge &Strategy PartnerA report onPlastics Industry05
Packaging industry in India has seen a strong penetration of plastics as compared toglobal standards. However, agriculture sector still hasn't explored the benefits ofplastics to a large extent. Global average for plastics demand in agriculture is 8% whileIndia is substantially lower at only 2%.Figure 2: Polymer utilization by application, Fy13Global averageIndiaSubstantially lowerconsumption in India43%35%25%21%17% cultureIndia offers strong opportunity for manufacturing of petrochemicals in future with itsplan to increase the share of manufacturing in GDP from 16% to 25% by 2022. Theincreasing demographic dividend, urbanization, growing income levels all support astrong case of increase in both demand and supply of petrochemicals in India. Plasticsare the major product that account for bulk of the Indian petrochemical industry.Knowledge &Strategy Partner06A report onPlastics Industry
3APlastic industryin Indiawide variety of plastics raw materials are produced to meet the materialneeds of different sectors of the economy. These polymeric materials arebroadly categorized as commodity, engineering and specialty plastics.Commodity plastics are the major products that account for bulk of the plastics and inturn for petrochemical industry. Commodity plastics comprise of Polyethylene (PE),Polypropylene (PP), Polyvinyl Chloride (PVC) and Polystyrene. While engineering andspecialty plastics are plastics that exhibit superior mechanical and thermal propertiesin a wide range of conditions over and above more commonly used commodity plasticsand are used for specific purpose. These include styrene derivatives (PS/EPS &SAN/ABS), polycarbonate, poly methyl methacrylate, polycarbonates, poly oxymethylene (POM) plastics etc.There are three broad types of PE, viz: Low-density Polyethylene (LDPE), High-densityPolyethylene (HDPE) and Linear Low-density Polyethylene (LLDPE). Major plasticmaterials like PE and PP are derived from Ethylene and Propylene respectively, whileother plastics such as PVC, PS & ABS and PC are produced from benzene, butadiene andother feedstock.1) Demand overviewPlastics industry is one of the fastest growing industries in India. It has expanded at 8%CAGR over the last five years to reach 8.5 MnTPA (million tonnes per annum) in FY13from 6 MnTPA in FY08. (Refer Figure 3).Knowledge &Strategy PartnerA report onPlastics Industry07
Figure 3: Demand growth of plastics ('000 TPA), CAGR, ource: Chemicals & Petrochemical Statistics, Analysis by Tata StrategicPolyethylene (PE) is the most largely used plastic raw-material by Indian industry. Itsdemand has grown at 8% CAGR in last 5 years to reach 3.6 MnTPA in FY13.Polypropylene (PP) is the second largest with consumption growing from 1.8 MnTPA inFY08 to 2.1 MnTPA in FY13 at a growth rate of 2% p.a.Polyvinyl Chloride (PVC) demand has grown at 10% p.a. from 1.2 MnTPA to 2.1 MnTPA inFY13. Poly-Styrene (PS) has observed a slower growth rate of 3% p.a. to reach 250,000TPA in FY13, while other (PC/ ABS etc.) have grown at 7% p.a. from 94,000 TPA to141,000 TPA in FY13 (Ref figure 4)Figure 4: Demand breakup of plastics by types, Fy13LDPE5%PS 3%Others2%PVC 28%LLDPE 18%HDPE 20%Source: Chemicals & Petrochemical Statistics, Analysis by Tata StrategicKnowledge &Strategy Partner08PP 24%A report onPlastics Industry
Polyethylene (PE), which includes HDPE, LLDPE and LDPE (High Density PE, LowDensity PE and Linear Low density PE), accounts for the largest share i.e., 43% of totalconsumption, while PP accounts for 24% of total consumption. Within PE, HDPE isobserving a moderate growth and has a consumption share of 20%. LLDPE is expectedto grow at higher pace due to its increased penetration in LLDPE applications. Othersinclude PS/EPS, ABS and engineering plastics.To manufacture finished products, polymers are processed through various types oftechniques namely extrusion, injection moulding, blow moulding and roto moulding.Various products manufactured through these processes are highlighted in thefollowing table (Refer Table 1)Table 1: Classification of plastic products by type of processPlasticproductsExtrusionFilms and Sheets, Fibre and Filaments Pipes, Conduits and profiles,Miscellaneous applicationsInjection mouldingIndustrial Injection Moulding, Household Injection Moulding and Thermoware/ Moulded luggageBlow mouldingBottles, containers, Toys and HousewaresRoto mouldingLarge circular tanks such as water tanksSource: CIPETExtrusion process is the most commonly used process in India and accounts for 60% oftotal consumption by downstream plastic processing industries. Injection moulding isthe other popular process accounting for 25% of the consumption. Blow moulding isused for 5% while Rotomoulding 1% while the rest of the plastic is processed throughother processes.1.1 Scenario in Northern IndiaWestern India has traditionally been the largest consumer of plastics accounting foralmost 47% of the total consumption. The region wise distribution of consumption isgiven in Figure 5.Knowledge &Strategy PartnerA report onPlastics Industry09
Figure 5: India - Region wise plastic consumption, 2013Easternregion, 9%Southernregion, 21%Westernregion, 47%Northernregion, 23%Source: IOCL, Industry reports, Research by Tata StrategicWestern region comprise of Maharashtra, Gujarat, the union territories of Daman andDiu & Dadra and Nagar Haveli along with Madhya Pradesh and Chhattisgarh. The totalconsumption of plastics in India in 2012-13 was 10 MnTPA. Out of this Northern Indiaaccounted for 23%. For the purpose of this report Northern India comprises of J&K,Himachal Pradesh, Punjab, Haryana, Uttarakhand, Rajasthan, UP, Delhi and NCRregion.Bulk of the consumption in Northern India is from end use industries of Auto,packaging (including bulk packaging), plasticulture applications, electronic appliancesetc. Figure below reflects indicative list of some end use industries (Refer Figure 6) inNorthern India.Figure 6: Indicative list of some end use industries in Northern IndiaPassenger carsNCR (Noida, Gurgaon, Pantnagar)41% of domestic capacity Maruti Suzuki Honda Tata MotorsAuto component (excluding Tyre)Northern India36% of domesticoutput Lumax Bony polymers Asahi AmtekPackagingUttarakhand(Haridwar, Rudrapur, Pant Nagar)(13% of organized flexible packaging) Essel Propack Paper Products (Rudrapur) RadhaMadhu Group (Rudrapur) TCPL (Haridwar)ElectronicsNorthern India( 50% of total output)Source: Industry reports, Analysis by Tata StrategicKnowledge &Strategy Partner10A report onPlastics Industry
The consumption in Northern India is low in comparison to Western India (Refer Figure6) primarily because of lack of availability of raw material. Reliance the largestpetrochemical player in India had all its cracking units in West and this facilitated thegrowth of downstream plastic processing industry in Western region. However withIOCL Panipat cracker and HMEL Bhatinda PP plant the availability of PE/ PP is notexpected to be a constraint and hence facilitate downstream plastic processing units.The upcoming petrochemical complex at Barmer can also spurt the sector in theregion.2) Capacity overviewIndia has significant production capacity of Plastics. Polyethylene (PE) continues to bethe largest commodity with LLDPE experiencing the fastest growth in this category.Current polymer capacities are mostly under-utilized with an operating efficiencyvarying from 66%-86%, expect for PVC, where production matches with capacity (ReferFigure 7).Figure 7: Production Capacity and Operating efficiency of plastics, 0%PEPPCapacityPVCPSOperating EfficiencySource : Industry reports, Analysis by Tata StrategicIndia has a 2.9 MnTPA of PE production capacity out of which 1.6 MnTPA is HDPEcapacity, 1 MnTPA is LLDPE and rest is LDPE capacity. PP and PVC also have the largeproduction capacities, i.e., 3.7 MnTPA and 1.3 MnTPA respectively. PVC is one of themajor products where capacity growth in past had been significantly lagging demandgrowth.India has a 400,000 TPA production capacity of PS and EPS. However, all thesefacilities are based on imported styrene since there is no local production of Styrene. Incase of Engineering Plastics, there is a significant opportunity in India. Currently forKnowledge &Strategy PartnerA report onPlastics Industry11
ABS India has a 100,000 TPA production capacity, while PC base resins are all imported.Polyamides have a limited production capacity, while other major engineering plasticsare being mostly imported to cater the domestic demand.Reliance Industries Ltd. (RIL) is the largest producer of commodity plastics in India. Ithas 1.16 Mn Tonnes per annum (TPA) capacity of PE, 2.7 MnTPA capacity of PP and650,000 TPA capacity of PVC (Refer Table 2). RIL's production facilities are located inGujarat and Maharashtra. RIL is the only producer of LDPE in India.Haldia Petrochemicals Ltd. (HPL) is another key player with PE capacity of 710,000 TPAand PP capacity of 390,000 TPA. HPL's Plants are located in eastern region of India.Other major players are Indian Oil (IOCL) & Gas Authority of India (GAIL) with theirplants located at Panipat and Auraiya respectively. These plants mainly cater to thenorthern regional demand of plastics. IOCL have 650,000 TPA production capacities ofPE and 600,000 TPA of PP, while GAIL has 505,000 TPA capacity of PE.India has significant production capacity of Plastics. Polyethylene (PE) continues to bethe largest commodity with LLDPE experiencing the fastest growth in this category.Current polymer capacities are mostly under-utilized with an operating efficiencyvarying from 66%-86%, expect for PVC, where production matches with capacity (ReferFigure 7).Table 2: Production Capacity of plastics by major players, 0,000--Chemplast Sanmar--250,000-Finolex--270,000-Supreme--Ineos ABS--Source: Plastindia, Analysis by Tata StrategicKnowledge &Strategy Partner12A report onPlastics Industry272,000-60,000
In downstream plastic processing, India has over 23,000 processing units. TotalMachines installed for plastic processing were 98,000 in FY13. The total processingcapacity has increased to 30 .0 MnTPA in 2013 from 11.7 MnTPA in 2006.2.1 Scenario in Northern IndiaIn Northern India, IOCL and GAIL are the two plastic producers with plastic productioncapacity of 1.25 MnTPA and 0.5MnTPA. Indian Oil Corporation Limited (IOCL) is thelargest oil company in India in terms of revenues. It is promoted by the Government ofIndia with Government holding 79% shares. IOCL commissioned its Panipat cracker inFebruary 2011. The Group owns and operates 10 of India's 20 refineries with a combinedrefining capacity of 65.7 MnTPA.Govt. of India has 57% stake in GAIL. It is a dominant player in natural gas tradingbusiness and uses natural gas as the feedstock for production of ethylene and in turnproduces Polyethylene. GAIL has plans to double its plastic production capacity by2014. HMEL's Bhatinda Polypropylene plant (0.44MnTPA) was commissioned in 2012.All put together the plastic production capacity is expected to go up to 2.5MnTPA by2014-15. The figure below maps the plastic production facilities along with theircapacities.Availability of 2.5 MnTPA of plastics in Northern region may result in spur ofinvestments in downstream plastic processing. Moreover since the north region doesnot have access to ports, hence the import/ export potential is restricted because ofadditional cost of transportation. This could result in ensuring a self-sufficient demandsupply scenario for the north as the optimal solution.Figure 8: Plastic production capacities in Northern IndiaKnowledge &Strategy PartnerA report onPlastics Industry13
3)Import-export scenarioIndia is overall deficit in plastics and a lot of these materials are imported to cater theunmet domestic demand. The major import source countries are Saudi Arabia, Qatar,UAE, Korea, USA, Singapore, Thailand, Germany, Spain and Malaysia. As reflected inFigure 9, India is deficit in PE, PVC and engineering plastics. In FY13, 2.3 Mn TPA of PEwas produced while domestics consumption was 3.4 Mn TPA. In case of PVC, the FY13domestic demand stood at 2.1 Mn TPA and the domestic production was 1.2 Mn TPA.Polyamides consumption was 54,000 TPA, while domestic production was 13,000 TPA.Other major engineering plastics were imported.Few Plastics materials are produced in surplus and these materials are exported tointernational markets. Major export destinations are China, Egypt, UAE, Turkey,Vietnam, and Indonesia. In FY 13, Indian production of PP stood at 2.5 Mn TPA whiledemand was 2.1 Mn TPA only. Similarly domestic demand for PS/EPS was 340,000 TPA,while production was 400,000 TPA.Figure 9: Demand-supply scenario of plastics, Fy13-SLIDE nsumptionPVCPS EPSProductionSource: Govt. of India Statistics, Analysis by Tata StrategicIndia is deficit in PE is dependent on imports for fulfilling demand. In FY13, 1.2 MnT of PEwas imported. PP production exceeds the domestic consumption and hence caters tointernational markets as well. India exported 800,000 tonnes and imported 450,000tonnes of PP in FY13 (Refer Figure 10).Knowledge &Strategy Partner14A report onPlastics Industry
Domestic production of PVC is not enough to cater the demand and hence 30% ofdemand is met through imports. 1000,000 tonnes of PVC was imported in FY13. India isa net exporter of PS, while most of the engineering plastics are being imported.Figure 10: Import-export scenario of plastics (in KT), Fy13SLIDE .0PEPPPVC PS EPS OthersImportExportSource: Intracen, Secondary researchExports of plastic finished goods have more than doubled in the last 5 years from 1.2Bn in 2007 to 2.7 Bn in 2012. But fierce competition from countries such as China,Indonesia, Taiwan and other South Asian countries are restricting growth. The exportsof these value added plastic products could be a huge growth opportunity if Indianmanufacturers can increase/ maintain their manufacturing competitiveness whileensuring high quality. (Ref: Fig 11 & Fig 12)Figure 11: Exports of value added plastic products (Bn 2Source: Planning Commission ReportKnowledge &Strategy PartnerA report onPlastics Industry15
Figure 12: Product wise breakup of plastic product exports in 2012-13Others, 17%Film, sheets &plates, 29%Pipes, tubes andfittings, 4%Housewares,6%Writinginstruments,6%Other moulded& extrudeditems, 12%Opticalitems, 8%Wovensacks, 8%Packagingitems, 10%Source: Plastindia, Analysis by Tata StrategicKnowledge &Strategy Partner16A report onPlastics Industry
4Plastics applicationsin Agriculture1970s witnessed the first Green Revolution in India. With the adoption of high yielding variety of seeds along with better farming techniques like better use offertilizers, insecticides and pesticides, made it possible for India to turn to a selfreliant agricultural nation. India currently supports nearly 16% of worlds' populationwith 2.4% land resources and 4% water resources. Nearly 65% of population directly orindirectly depends on agriculture and it provides employment to 58.2% of population.Also, it contributes nearly 17% of India's GDP consuming 80% of available waterresources1)Plasticulture ApplicationsPlasticulture refers to use of plastics in agriculture and horticulture. Plasticultureprovides variety of applications in modern agriculture and promise to transform Indianagriculture and bring in the "Second Green Revolution". Both the quality and thequantity of the crops and other farm products can be optimized using varioustechniques. Some of the major applications of Plasticulture are:Table 3: Major Plasticulture ApplicationsApplicationCommentsDrip IrrigationSystemlPreciseSprinkle IrrigationSystemlApplicationPonds and ReservoirLiningslPlasticsapplication of irrigation water and plant nutrients at low pressure andfrequent intervals through drippers/emitters directly into the root zone of plantlWaterof water under high pressure with the help of a pump.is released through a small diameter nozzle placed in the pipesfilm lining to prevent against seepage in canals, ponds and reservoirsdepletion of stored water used for drinking & irrigation purposelAlso avoidslMulchingPlastic MulchingGreenhousePlastic Tunnelis covering the soil around the plant with plastics film, straw, grass,hay, dry leaves, stones etc.lPrevents loss of moisture and acts as a barrier between the soil and atmospherelGreenhouselActs asis a framed structure covered with glass or plastics filmselective radiation filter, in which plants are grown under the controlled environmentlPlasticstunnel facilitates the entrapment of carbon dioxide, thereby enhancing thephotosynthetic activities of the plant that help to increase yieldKnowledge &Strategy PartnerA report o
As per industry estimates, 35-40% of the food products produced in India are wasted due to deficient infrastructure and lack of food processing capabilities. Plastics find applications in packaging which protects the longevity and quality of food. This sector in India also offers