Transcription
AS Level Physics AH156/02 Depth in physicsSample Question PaperDate – Morning/AfternoonVersion 2.0Time allowed: 1 hour 30 minutesYou may use: a scientific or graphical calculatorENYou must have: the Data, Formulae and Relationships BookletFirst nameLast UCTIONS Use black ink. You may use an HB pencil for graphs and diagrams. Complete the boxes above with your name, centre number and candidate number. Answer all the questions. Where appropriate, your answers should be supported with working. Marks maybe given for a correct method even if the answer is incorrect. Write your answer to each question in the space provided. Additional paper may be used if required but you must clearly show your candidatenumber, centre number and question number(s). Do not write in the bar codes.INFORMATION The total mark for this paper is 70. The marks for each question are shown in brackets [ ]. Quality of extended responses will be assessed in questions marked with an asterisk (*). This document consists of 20 page OCR 2016[601/4742/8] DC ( )H156/02Turn over
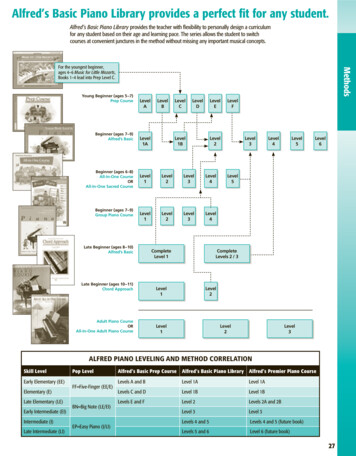
2Answer all the questions.IMENFig. 1.1 shows a sign hanging from a rod fixed to a vertical wall. A metal wire attachedbetween the rod and the wall holds the rod horizontal.1Fig.1.1The weight W of the sign and rod act through the centre point of the rod. The value W is120 N. The angle between wire and rod is 30o.Explain why the vertical force exerted on the rod by the wire is 60 N.EC(a).SP.(b)Calculate the tension T in the wire.T N OCR 2016[2]H156/02[2]
3(c)(i)Draw an arrow on Fig. 1.1 to show the direction of the force exerted on the rodby the wall.[1](ii)State how you chose this direction.[1]SPECIMENQuestion 2 begins on page 4 OCR 2016H156/02Turn over
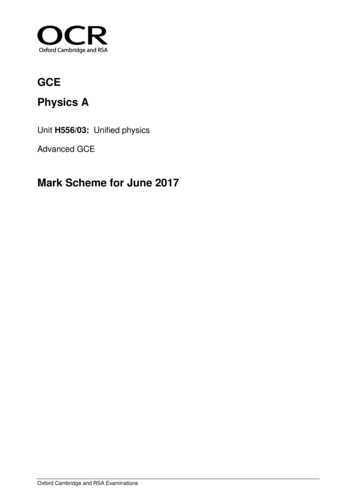
4Fig. 2.1 shows the path of a golf ball which is struck at point F on the fairway landingat point G on the green. The effect of air resistance is negligible.2Fig. 2.1The ball leaves the club at 17 m s 1 at an angle of 60o to the horizontal at time t 0.Show that the speed of the ball at the highest point H of the trajectory is between 8 and9 m s 1.IMEN(a)speed . . m s 1[2]the maximum height h of the ballSP(i)ECAt t 1.5 s the ball reaches point H. Calculate(b)(ii) OCR 2016h . m[3]distance FG . m[2]the distance between the points F and G.H156/02
5(c)Suppose the same golfer standing at F had hit the ball with the same speed but at anangle of 30o to the horizontal. See Fig. 2.2.Fig. 2.2[3]Compare the magnitude and direction of the two velocities as the ball lands at G andusing this information suggest, with a reason, which trajectory you would choose totravel a longer distance after hitting the green at G.EC(d)IMENShow that the ball would still land at G.SP. OCR 2016H156/02[2]Turn over
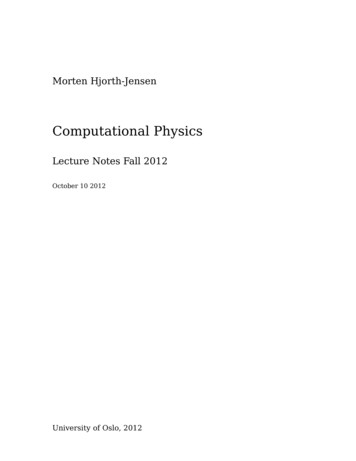
6A sports manufacturer is testing the quality of one of their footballs.(a)Fig. 3.1 shows how the force F applied to a football varies with time t whilst it isbeing kicked horizontally. The ball is initially at rest.IMEN3Fig. 3.1(i)Use the graph to find:EC1 the maximum force applied to the ball . .N2 the time the boot is in contact with the ball s.The mean force multiplied by the time of contact is called the impulse deliveredto the ball. The impulse delivered to the ball is about 6.5 N s.SP(ii)[1]Explain how you would use the graph to show that the impulse has this value. OCR 2016H156/02[2]
7(b)The mass of the ball is 0.60 kg. Use your answers in (a) to calculate(i)the maximum acceleration of the ballacceleration . m s 2the final speed of the ball.IMEN(ii)[2]ECspeed . m s 1(c)[2]The ball hits a wall with a speed of 11 m s 1. It rebounds from the wall along itsinitial path with a speed of 6.0 m s–1. The impact lasts for 0.18 s.SPCalculate the mean force exerted by the ball on the wall.mean force N OCR 2016H156/02[3]Turn over
84(a)Name the charge carriers responsible for electric currentin a metal .and in an electrolyte [1]A copper rod of cross-sectional area 3.0 x 10⁻⁴ m2 is used to transmit large currents.A charge of 650 C passes along the rod every 5.0 s. Calculate(i)the current I in the rodIMEN(b)I . Athe total number of electrons passing any point in the rod per secondEC(ii)[1][1]SPnumber per second .(iii) the mean drift velocity of the electrons in the rod given that the number density offree electrons is 1.0 x 1029 m–3.mean drift velocity m s–1 OCR 2016H156/02[2]
9(c)The copper rod in (b) labelled X in Fig. 4.1 is connected to a longer thinner copperrod Y.Fig. 4.1State (i)why t State why the current in Y must also be I.Rod Y has half the cross-sectional area of rod X. Calculate the mean drift velocityof electrons in Y.IMEN(ii)[1][1]SPECmean drift velocity m s–1 OCR 2016H156/02Turn over
105(a) The circuit in Fig. 5.1 consists of a d.c. supply of e.m.f. 45 V and negligible internalresistance and three resistors.Fig. 5.1IMENTwo of the resistors have resistances 1000 Ω and 750 Ω as shown.SPECThe current drawn from the supply is 0.030 A. Calculate the resistance of R.resistance . Ω [4] OCR 2016H156/02
11(b)* Students are given a light dependent resistor (LDR) and asked to design a circuit for alight meter to monitor changes in light intensity. The meter reading must rise when thelight intensity increases.The incident light may cause the resistance of the LDR to vary between 1500 Ω and250 Ω.The students are asked to use the d.c. supply and one of the resistors from (a) aboveand either a voltmeter or ammeter.Draw a suitable circuit.[6]ECIMENExplain why the reading on the meter increases with increasing light intensity andwhich of the three fixed resistors gives the largest scale change on the meter for thechange in light intensity.SP. OCR 2016H156/02Turn over
12Additional answer space if required.IMEN.SPEC. OCR 2016H156/02
13SPECIMENBLANK PAGE OCR 2016H156/02Turn over
14In an investigation of standing waves, sound waves are sent down a long pipe, with itslower end immersed in water. The waves are reflected by the water surface. The pipe islowered until a standing wave is set up in the air in the pipe. A loud note is then heard.See Fig. 6.1.6IMENLength l1 is measured. The pipe is then lowered further until a loud sound is againobtained from the air in the pipe. Length l2 is measured.Fig 6.1(a)A student obtained the following results in the experiment.l1 /m0.506l2 /m0.170ECfrequency of sound/Hz500SPUse data from the table to calculate the speed of sound in the pipe.speed . m s–1 OCR 2016H156/02[4]
15(b)The student repeats the experiment, but sets the frequency of the sound from thespeaker at 5000 Hz.Suggest and explain whether these results are likely to give a more or less accuratevalue for the speed of sound than those obtained in the first experiment.IMEN.[2]SPEC. OCR 2016H156/02Turn over
16(c)The pipe is removed from the water and laid horizontally on a bench as in Fig. 6.2.The frequency of the sound waves sent down the pipe is adjusted until a standingwave is set up in it. Point P is a distance of λ/4 from point Q at the far end.Fig. 6.2Explain how and under what conditions a stationary sound wave is formed in the pipe.Describe and compare the motion of the air molecules at points P and Q.IMEN.EC.SP. OCR 2016H156/02[6]
177(a)* The Planck constant h can be measured in an experiment using light-emitting diodes(LEDs).Each LED used in the experiment emits monochromatic light. The wavelength λ of theemitted photons is determined during the manufacturing process and is provided by themanufacturer.When the p.d. across the LED reaches a specific minimum value Vmin the LEDsuddenly switches on emitting photons of light of wavelength λ.IMENVmin and λ are related by the energy equation eVmin hc/λ.Fig. 7.1λ/nm627590546468411ECLED1 red2 yellow3 green4 blue5 violetVmin/V1.982.102.272.663.02SPDiscuss how you could use the circuit of Fig. 7.1 to determine accurate values forVmin and how data from the table can be used graphically to determine a value forthe Planck constant.[6]. OCR 2016H156/02Turn over
18.Additional answer space if required.IMEN.EC.SP. OCR 2016H156/02
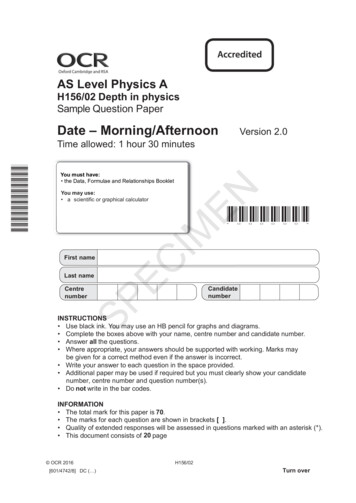
19A beam of ultraviolet light is incident on a clean metal surface. The graph of Fig. 7.2shows how the maximum kinetic energy KEmax of the electrons ejected from thesurface varies with the frequency f of the incident light.IMEN(b)Fig.7.2Explain how the graph shown in Fig 7.2 cannot be explained in terms of thewave-model for electromagnetic waves.EC(i)SP(ii)[2]Use data from Fig.7.2 to find a value of1. the Planck constantPlanck constant J s[2]2. the threshold frequency of the metalthreshold frequency Hz OCR 2016H156/02[1]Turn over
203. the work function of the metal.work function J[2]SPECIMENEND OF QUESTION PAPERCopyright Information:OCR is committed to seeking permission to reproduce all third-party content that it uses in the assessment materials. OCR has attempted toidentify and contact all copyright holders whose work is used in this paper. To avoid the issue of disclosure of answer-related information tocandidates, all copyright acknowledgements are reproduced in the OCR Copyright Acknowledgements booklet. This is produced for each seriesof examinations and is freely available to download from our public website (www.ocr.org.uk) after the live examination series.If OCR has unwittingly failed to correctly acknowledge or clear any third-party content in this assessment material, OCR will be happy to correct itsmistake at the earliest possible opportunity.For queries or further information please contact the Copyright Team, First Floor, 9 Hills Road, Cambridge CB2 1GE.OCR is part of the Cambridge Assessment Group; Cambridge Assessment is the brand name of University of Cambridge Local ExaminationsSyndicate (UCLES), which is itself a department of the University of Cambridge. OCR 2016H156/02
day June 20XX–Morning/AfternoonENAS Level Physics AH156/02 Depth in physics70SPEMAXIMUM MARKCIMSAMPLE MARK SCHEMEThis document consists of 16 pagesDuration: 1 hour 30 minutes
H156/02Mark SchemeJune 20XXMARKING INSTRUCTIONSPREPARATION FOR MARKINGSCORISMake sure that you have accessed and completed the relevant training packages for on-screen marking: scoris assessor Online Training;OCR Essential Guide to Marking.2.Make sure that you have read and understood the mark scheme and the question paper for this unit. These are posted on the RM CambridgeAssessment Support Portal http://www.rm.com/support/ca3.Log-in to scoris and mark the required number of practice responses (“scripts”) and the required number of standardisation responses.CIMEN1.MARKINGSPEYOU MUST MARK 10 PRACTICE AND 10 STANDARDISATION RESPONSES BEFORE YOU CAN BE APPROVED TO MARK LIVESCRIPTS.1.Mark strictly to the mark scheme.2.Marks awarded must relate directly to the marking criteria.3.The schedule of dates is very important. It is essential that you meet the scoris 50% and 100% (traditional 50% Batch 1 and 100% Batch 2)deadlines. If you experience problems, you must contact your Team Leader (Supervisor) without delay.4.If you are in any doubt about applying the mark scheme, consult your Team Leader by telephone, email or via the scoris messaging system.2
H156/02June 20XXWork crossed out:a.where a candidate crosses out an answer and provides an alternative response, the crossed out response is not marked and gains nomarksb.if a candidate crosses out an answer to a whole question and makes no second attempt, and if the inclusion of the answer does notcause a rubric infringement, the assessor should attempt to mark the crossed out answer and award marks appropriately.EN5.Mark SchemeAlways check the pages (and additional objects if present) at the end of the response in case any answers have been continued there. If thecandidate has continued an answer there then add a tick to confirm that the work has been seen.7.There is a NR (No Response) option. Award NR (No Response)CIM6.if there is nothing written at all in the answer space-OR if there is a comment which does not in any way relate to the question (e.g. ‘can’t do’, ‘don’t know’)-OR if there is a mark (e.g. a dash, a question mark) which isn’t an attempt at the question.SPE-Note: Award 0 marks – for an attempt that earns no credit (including copying out the question).8.The scoris comments box is used by your Team Leader to explain the marking of the practice responses. Please refer to these commentswhen checking your practice responses. Do not use the comments box for any other reason.If you have any questions or comments for your Team Leader, use the phone, the scoris messaging system, or e-mail.9.Assistant Examiners will send a brief report on the performance of candidates to their Team Leader (Supervisor) via email by the end of themarking period. The report should contain notes on particular strengths displayed as well as common errors or weaknesses. Constructivecriticism of the question paper/mark scheme is also appreciated.3
H156/0210.Mark SchemeJune 20XXFor answers marked by levels of response:-Read through the whole answer from start to finish.-Decide the level that best fits the answer – match the quality of the answer to the closest level descriptor.-To select a mark within the level, consider the following:ENHigher mark: A good match to main point, including communication statement (in italics), award the higher mark in the levelLower mark: Some aspects of level matches but key omissions in main point or communication statement (in italics), award lower markin the level.AnnotationsAnnotationDO NOT ALLOWIGNOREALLOW()MeaningAnswers which are not worthy of creditSPE11.CIMLevel of response questions on this paper are 5(b) and 7(a).Statements which are irrelevantAnswers that can be acceptedWords which are not essential to gain creditUnderlined words must be present in answer to score a markECFError carried forwardAWAlternative wordingORAOr reverse argument4
H156/0212.Mark SchemeJune 20XXSubject-specific Marking InstructionsINTRODUCTION the specification, especially the assessment objectives the question paper the mark scheme.ENYour first task as an Examiner is to become thoroughly familiar with the material on which the examination depends. This material includes:CIMYou should ensure that you have copies of these materials.You should ensure also that you are familiar with the administrative procedures related to the marking process. These are set out in the OCRbooklet Instructions for Examiners. If you are examining for the first time, please read carefully Appendix 5 Introduction to Script Marking:Notes for New Examiners.SPEPlease ask for help or guidance whenever you need it. Your first point of contact is your Team Leader.5
H156/02Mark SchemeJune 20XXCATEGORISATION OF MARKSThe marking schemes categorise marks on the MACB scheme.B marks: These are awarded as independent marks, which do not depend on other marks. For a B-mark to be scored, the point to which it refersmust be seen specifically in the candidate’s answers.ENM marks: These are method marks upon which A-marks (accuracy marks) later depend. For an M-mark to be scored, the point to which it refersmust be seen in the candidate’s answers. If a candidate fails to score a particular M-mark, then none of the dependent A-marks can be scored.A marks:CIMC marks: These are compensatory method marks which can be scored even if the points to which they refer are not written down by thecandidate, providing subsequent working gives evidence that they must have known it. For example, if an equation carries a C-mark and thecandidate does not write down the actual equation but does correct working which shows the candidate knew the equation, then the C-mark isgiven.These are accuracy or answer marks, which either depend on an M-mark, or allow a C-mark to be scored.Note about significant figures:SPEIf the data given in a question is to 2 sf, then allow to 2 or more significant figures.If an answer is given to fewer than 2 sf, then penalise once only in the entire paper.Any exception to this rule will be mentioned in the Additional Guidance.6
H156/02Mark Scheme(b)MarksB1W x l/2 F x l or the vertical force is at a distance twice that for theweight.B1T 60/sin 30 or 60/cos 60C1T 120 (N)A1arrow from rod wall junction through point where T and line of Wcross.B1(ii)require triangle of forces for equilibrium or the forces must passthrough a point for equilibrium.B1CIM(i)TotalSPE(c)AnswerTake moments about contact point of rod and wall (because thisremoves the unknown forces in the calculation).ENQuestion1 (a)June 20XX76Guidance
H156/02Mark Scheme(b)(i)(ii)Answerhorizontal component 17 sin 30 or 17 cos 60 8.5(m s–1)B1u 17 cos 30 14.7 (m s–1)C1h ut - ½gt2; 14.7 x 1.5 - ½ x 9.81 x 1.52C1or use v2 u2 – 2gs or s (u v)t/2h 11 (m)A1note: if g 10 is used, then maximum score is 2/3C1ecf 2aA1allow 25.5 ms 2 x 8.5 x 1.5s 14.7 x 1.73 25.4 (m)CIM0 17 sin 30 t - ½ x 9.81 x t2so t 0 or 17/9.81 1.73C1C1A1the ball has the same speed (of 17 m s–1) but is at different (eitherat 60o or 30o ) angle to the horizontal.B1larger horizontal velocity (second trajectory) so travels furtheror higher bounce (first trajectory) so less drag from grass so travelsfurther.B1Total12SPE(d)Guidanceat highest point vertical component of velocity is zero.s 26 (m)(c)MarksB1ENQuestion2 (a)June 20XX8allow s 15 x 1.7 25.5 (accept 25 or 26 to 2 sf)accept any sensible a
2 yellow 590 2.10 3 green 546 2.27 4 blue 468 2.66 5 violet 411 3.02 Discuss how you could use the circuit of Fig. 7.1 to determine accurate values for Vmin and how data from the table can be used graphically to determine a value for the Planck constant. [6]