Transcription
Chapter 5Using Qualitative Analysis SoftwareTo Facilitate Qualitative Data AnalysisDownloaded by Vicente Talanquer on August 1, 2014 http://pubs.acs.orgPublication Date (Web): July 31, 2014 doi: 10.1021/bk-2014-1166.ch005Vicente Talanquer*Department of Chemistry and Biochemistry, University of Arizona,Tucson, Arizona 85721, United States*E-mail: vicente@u.arizona.eduTechnological advances in the last twenty years have led to thedevelopment of powerful software for qualitative data analysis.Computer assisted qualitative data analysis (CAQDAS)packages facilitate managing multiple tasks in qualitativeresearch, from organizing data sources based on relevantcharacteristics, segmenting and categorizing data according tothemes, searching for and retrieving information, to buildingvisual representations that more easily elicit significant patternsin the data. This chapter presents an introduction to the use ofCAQDAS packages as tools that can greatly support qualitativeresearch activities in chemistry education.IntroductionThe answers to many relevant research questions in chemistry education,such as how students approach the drawing of Lewis structures (1) or howthe nature of laboratory activities influence students’ conversations (2), can beobtained through investigations that generate in-depth information about theknowledge, beliefs, reasoning, attitudes, or behaviors of study participants (3, 4).This information may be gathered using different qualitative research techniquessuch as classroom observations, field notes, individual interviews, focus groups, 2014 American Chemical SocietyIn Tools of Chemistry Education Research; Bunce, D., et al.;ACS Symposium Series; American Chemical Society: Washington, DC, 2014.
Downloaded by Vicente Talanquer on August 1, 2014 http://pubs.acs.orgPublication Date (Web): July 31, 2014 doi: 10.1021/bk-2014-1166.ch005open response questionnaires, written reports, and journals; some of these andother qualitative research strategies are discussed in depth in the chapters byCole, Becker, and Stanford (5), Yezierski (6), and Herrington and Daubenmire(7) in this volume. The data collected using these strategies, such as text, images,and diagrams, is not numerical in nature (qualitative data) and tends to be verylengthy, requiring intensive and repeated examination in the search for answersto research questions (8, 9). This analysis can be done manually or with the helpof computer software commonly known as computer assisted qualitative dataanalysis (CAQDAS) packages that simplify the tasks of organizing, exploring,integrating, and reflecting on the information (10–12). The central goal of thischapter is to provide an overview of useful strategies to take advantage of thesetypes of technological resources to support and facilitate qualitative research inchemistry education. The chapter is directed to researchers who have not yet usedqualitative data analysis software to support their work.CAQDASAdvances in analytical software in the last twenty years have led to thedevelopment of powerful tools for qualitative data management. These types ofresources facilitate the implementation of core tasks in most common qualitativeresearch designs, from case studies to discourse analysis to grounded theory(3–9). Commercially available CAQDAS packages such as ATLAS.ti (13),Dedoose (14), MAXQDA (15), and NVivo (16) allow users to import differenttypes of data (e.g., text, images, audio, and video) and categorize them accordingto user-defined attributes or descriptors (e.g., gender, educational level, or coursegrade of study participants). These data can then be segmented and organized intocategories using codes created by the user either before or during the analysis.Most CAQDAS packages also include tools for selective retrieval of text orcoded data, powerful systems for writing and reviewing comments and memoslinked to documents, audio or video files, text segments, or specific codes, aswell as diverse avenues for data representation that facilitate the identification ofconceptual themes or patterns (10, 11).The use of qualitative software for data analysis has several advantages.First, it frees researchers from tedious managing tasks, allowing them to focus onthe data and their reactions to it. It provides dynamic and simultaneous access todifferent components of the data analysis, from excerpts to codes to annotationsto demographic data. Additionally, it more quickly directs researchers’ attentionto themes and relationships emerging from the analysis. In many ways, thesoftware allows users to get closer to the data and further explore its intricacies.Nevertheless, CAQDAS packages do not carry out core qualitative analysistasks for the researcher. Common qualitative software does not, for example,transcribe audio or video files, define relevant attributes for data sources, identifymeaningful segments in a text, or build and apply codes in an independent andautomatic fashion. Nor do these types of resources independently detect patternsin the data or identify overarching themes. Researchers have full control, andresponsibility, over the analytical and interpretative processes. Thus, the quality84In Tools of Chemistry Education Research; Bunce, D., et al.;ACS Symposium Series; American Chemical Society: Washington, DC, 2014.
Downloaded by Vicente Talanquer on August 1, 2014 http://pubs.acs.orgPublication Date (Web): July 31, 2014 doi: 10.1021/bk-2014-1166.ch005of the results generated by using qualitative software is only as good as that ofthe research design and methods of data analysis. As is the case with packagesfor quantitative analysis (e.g., SPSS), the quality of the output strongly dependson the choices made by the researcher about what data to collect, how to collectthe data, and what strategies to apply to analyze the data.Differences among common CAQDAS packages are subtle and likely tobecome less explicit as the underlying technology advances in upcoming years.Commercially available products tend to offer the same core tools and functions,and decisions about what package to use may thus be difficult, particularly fornovice users. Researchers should look for the resource that best fits their researchgoals and methodological approaches. Detailed comparative analysis involvingthe most widely used CAQDAS packages can be found in the literature (10, 11).In this chapter, I will illustrate the application of core strategies in computerassisted qualitative analysis using the on-line software Dedoose when presentingspecific examples. This choice is somewhat arbitrary and does not imply apersonal endorsement or recommendation of any particular type of software.Dedoose is a web-based application that is easily accessible via the Internet andincludes the major analytical tools present in modern CAQDAS packages. Ithas a simple user interface and has been designed to facilitate collaboration bygeographically dispersed researchers who may work with Mac or PC systems(14). Comparisons between common CAQDAS packages (ATLAS.ti, Dedoose,MAXQDA, NVivo) will be presented in those areas in which differences arejudged to be more substantive.Analyzing Qualitative DataThe analysis of qualitative data involves a variety of tasks: copying,transcribing, and organizing data; segmenting and coding transcripts, images,audio, and video; stepping back from the data, seeking to identify overarchingthemes and patterns; building and applying coding schemes at different levels (e.g.,descriptive, interpretative); identifying quantitative patterns in coded segmentsacross different participants (3–6). CAQDAS packages allow researchers toperform most of these tasks in more systematic and efficient manners. Thefollowing sections summarize fundamental strategies in the analysis of qualitativedata using these types of computer applications.Handling and Organizing DataQualitative research studies generate vast amounts of textual and non-textualdata of different types, from background information about the study participantsto primary data collected in the field to supporting or secondary data that maybe relevant for the analysis. CAQDAS packages allow researchers to import allof these different resources, integrate them into a single project, and build linksor cross-references between them. Common applications will directly importdocuments in plain text (.txt), rich text format (.rtf), and Microsoft Word (.doc or.docx) formats, and include tools to edit such texts within the software. In most85In Tools of Chemistry Education Research; Bunce, D., et al.;ACS Symposium Series; American Chemical Society: Washington, DC, 2014.
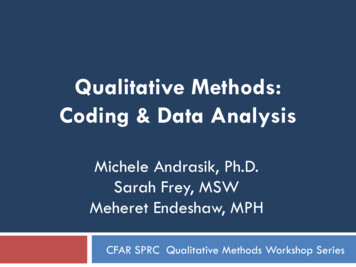
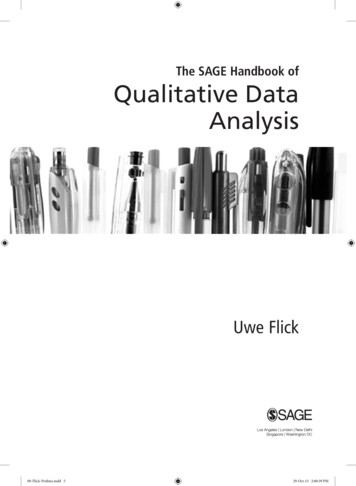
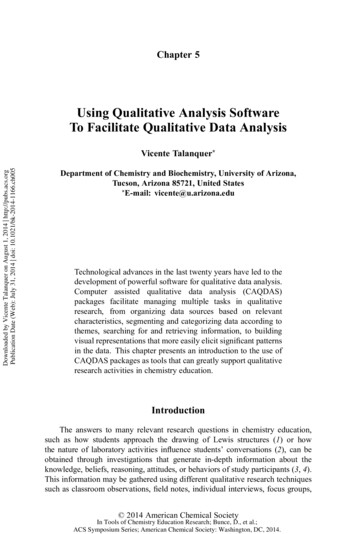
Downloaded by Vicente Talanquer on August 1, 2014 http://pubs.acs.orgPublication Date (Web): July 31, 2014 doi: 10.1021/bk-2014-1166.ch005cases, such documents may contain tables, embedded images, and rich objects,but format specifications may vary among different CAQDAS packages (10,11). Most of these applications also allow audio and video files to be directlyincorporated into the software project. However, existing software packages donot have the capability to transcribe these files into written documents.One of the key elements of CAQDAS packages is that data sources can beorganized according to known characteristics. This enables researchers to easilysearch for, identify, and narrow their focus on subsets of data, which facilitatescomparisons. More importantly, this organization lays the foundation on whichthe dataset can be analyzed in search of themes, patterns, and relationships acrossdata sources. Existing CAQDAS packages organize known data characteristicsdifferently, and use various terms to refer to them, such as families (ATLAS.ti),attributes (MAXQDA, NVivo), or descriptors (Dedoose). All of these applicationsallow researchers to assign these characteristics within the software or uploadspreadsheets that contain such information. A critical step in the data analysisprocess is to carefully reflect on the attributes or descriptors that are relevant in astudy. These decisions should be based on the questions researchers want to ask,the ideas they want to test, and the parts of the data set that they want to isolate forcomparative purposes. These ideas will be illustrated with a concrete example.Recently, we completed a study focused on the characterization of theideas (assumptions) and reasoning strategies (heuristics) used by college generalchemistry students when asked to judge the relative thermodynamic likelihoodof different chemical processes (17). This research project was based on datacollected using individual interviews in which participants were asked to thinkout loud when solving five different problems. Verbatim transcripts of therecorded interviews were our primary data and, for purposes of analysis, wedecided to build different text files containing the answer of a single studentto a single question. This decision stemmed from our interest in eventuallycomparing not only the assumptions and heuristics used by different students,but also the assumptions and heuristics applied across different questions. Asshown in Figure 1, when the different text files were uploaded into the DedooseCAQDAS package, each of the files was assigned a descriptor that indicated thestudent to which the file belonged (e.g., S1, S2, ) and the question to which itcorresponded (e.g., Q1, Q2, ). Additionally, we built descriptors to indicatethe gender of each participant and their final grade in the general chemistry classin which they were enrolled at the time of the interview. These descriptors wereintroduced because we were also interested in exploring the association betweenthe types of assumptions and heuristics that students applied and these individualattributes.In most software applications, attributes can be applied to individualdocuments or to sets of documents. Although it is easier and more efficientto organize data sources using attributes or descriptors early in the analyticalprocess, CAQDAS packages allow researchers to assign known characteristicsat any stage during the analysis.86In Tools of Chemistry Education Research; Bunce, D., et al.;ACS Symposium Series; American Chemical Society: Washington, DC, 2014.
Downloaded by Vicente Talanquer on August 1, 2014 http://pubs.acs.orgPublication Date (Web): July 31, 2014 doi: 10.1021/bk-2014-1166.ch005Figure 1. Dedoose screen capture showing the set of descriptors (student,question, gender, final grade) linked to different data sources (media) inour research project about students’ assumptions and heuristics. Copyright2013 Dedoose Version 4.5, web application for managing, analyzing, andpresenting qualitative and mixed method research data (2013). Los Angeles, CA:SocioCultural Research Consultants, LLC (www.dedoose.com).Coding of DataSeveral qualitative research approaches or designs rely on coding toconceptually organize data (3–9). During this process, relevant segments of theavailable data are identified and classified as instances or exemplars of majorideas or themes. Codes define conceptual categories that are expected to runboth within and across different data sources, and may help provide meaningfulresponses to research questions. These codes could be predefined, arising fromthe theoretical framework or research questions, or they can emerge from the dataduring the analysis. Most coding involves the combination of these deductiveand inductive approaches. In general, coding is an iterative process in which theresearcher moves back and forth between careful reading of the data and criticalreflection of its meaning. As a researcher dives in and steps back from the data,codes can be generated at different levels. Initially, codes may be very specific,describing significant ideas, events, or actions detected in the data. As the analysisprogresses, descriptive codes may be organized or collapsed into higher ordercategories that are more interpretative in nature (8, 9).CAQDAS packages facilitate the coding process at many levels. Theseapplications allow the researcher to easily build a coding system either from theoutset or in an ongoing manner during data analysis. Labels and descriptionsof individual codes can be modified, and codes can be expanded, deleted, orrearranged when needed. Segments of text, audio, or video in any given file canbe identified and highlighted to create excerpts, or audio and video fragments,that can be linked to one or multiple codes by simple dragging and dropping87In Tools of Chemistry Education Research; Bunce, D., et al.;ACS Symposium Series; American Chemical Society: Washington, DC, 2014.
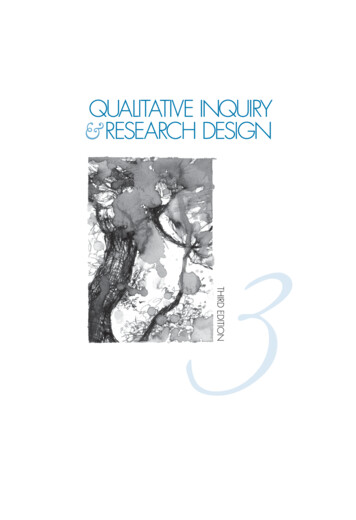
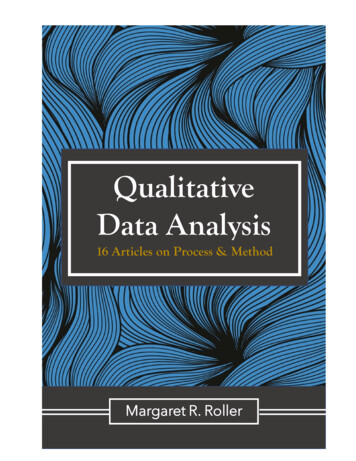
Downloaded by Vicente Talanquer on August 1, 2014 http://pubs.acs.orgPublication Date (Web): July 31, 2014 doi: 10.1021/bk-2014-1166.ch005movements. Consider the example presented in Figure 2, where a segment(called an excerpt within the Dedoose software) in an interview transcript inour Assumptions and Heuristics project has been highlighted, and linked totwo relevant codes in our study (labeled “One-Reason Decision Making” and“Easiness”). This figure also shows the hierarchy of codes built and appliedto categorize different assumptions and heuristics that emerged from our dataanalysis.Chemistry educators engaged in qualitative research often use CAQDASpackages to facilitate the coding of interview transcripts or written responses toopen questions. The use of this type of software can help chemistry educationresearchers more easily identify trends in students’ alternative conceptions (18),explore teachers’ instructional goals and strategies (19, 20), collect exploratorydata to guide the development of quantitative research instruments (21), identifyeducational approaches that support learning (22), or elicit students’ beliefs andperspective about diverse educational issues (23).Figure 2. Dedoose screen capture showing a highlighted excerpt in an interviewtranscript and the two codes associated to this excerpt. The overall codingscheme used in this analysis is shown in the lower right panel. Copyright2013 Dedoose Version 4.5, web application for managing, analyzing, andpresenting qualitative and mixed method research data (2013). Los Angeles, CA:SocioCultural Research Consultants, LLC (www.dedoose.com).The default structure of the coding scheme in common CAQDAS packagestends to be hierarchical (except in ATLAS.ti). This facilitates the creation ofembedded sets of subcodes that can be used to categorize segments or excerptsat different levels. For example, in the case illustrated in Figure 2, the majorcode “Assumptions” was subdivided into the subcodes “Intuitive” and Spurious,”which in turn included various subcategories. These software programs providethe user with the freedom to use as much or as little hierarchy as needed in theorganization of the coding scheme. Some software packages, such as MAXQDA88In Tools of Chemistry Education Research; Bunce, D., et al.;ACS Symposium Series; American Chemical Society: Washington, DC, 2014.
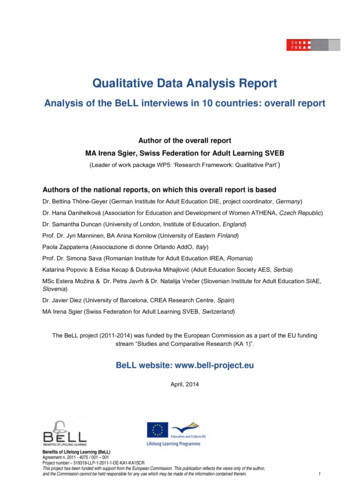
Downloaded by Vicente Talanquer on August 1, 2014 http://pubs.acs.orgPublication Date (Web): July 31, 2014 doi: 10.1021/bk-2014-1166.ch005and Dedoose, use different colors to more clearly indicate the status of a codewithin a hierarchy. Most applications allow the easy reshuffling of codes in andout of different categories. Codes can be easily renamed, grouped, merged, orreallocated within different classes. The fluid and flexible manipulation of thecoding scheme within these CAQDAS packages greatly facilitates qualitativedata analysis since any change automatically propagates throughout all codedsegments in every document within the software project. In general, changes thatinvolve code reorganization, merging, and streamlining are easier to implementthan changes that require separating data originally linked to a single code intotwo or more new categories. This task demands recoding of excerpts by theresearcher who needs to make decisions about how the data should be reassigned.Retrieval of Coded DataWhen performing qualitative data analysis, it is important to step back,review the progress made, reflect on results, group similar data, identify gapsor inconsistencies, and re-strategize if needed. The ability to easily search forand retrieve coded data is thus critical and constitutes another great advantage ofusing CAQDAS packages. In general, these applications facilitate the completionof the following tasks: View all codes linked to different segments in a given document;Retrieve all coded data associated with an individual code or a set of codes(see Figure 3);Recode retrieved segments;Dynamically view different code frequencies as the analysis proceeds;Export and retrieve information in the form of reports that can be printedor saved in common formats (e.g., MS Excel or Word).Although commercially available software packages offer these differentfunctionalities, they differ greatly in the steps that users must follow to implementthem. Some packages, such as ATLAS.ti and MAXQDA, include interactivemargin views that visually display all codes linked to different segments in asingle text. In other cases, such as Dedoose, these codes are displayed in aseparate panel when selecting a segment (see Figure 3). In most cases, accessto all coded segments linked to a given code across data sources is providedthrough a code index or a code panel. Different strategies may need to be appliedto filter data in order to view all segments that are simultaneously linked to twoor more codes. Despite these differences, common CAQDAS packages allowresearchers to analyze their data in multiple manners and generate diverse reportsthat more easily uncover meaningful trends. For example, the analysis of excerptslinked to both the code “Easiness” and the code “One-Reason Decision Making”in our Assumptions and Heuristics project (Figure 3) revealed the existenceof a potential relationship between these two types of reasoning. Reports mayalso serve to identify potential problems in the analysis. Reviewing all of thesegments coded under a certain category can help researchers decide whether acode actually captures a targeted theme or whether all segments belong to the89In Tools of Chemistry Education Research; Bunce, D., et al.;ACS Symposium Series; American Chemical Society: Washington, DC, 2014.
Downloaded by Vicente Talanquer on August 1, 2014 http://pubs.acs.orgPublication Date (Web): July 31, 2014 doi: 10.1021/bk-2014-1166.ch005same group. The software will not automatically resolve any potential issues, butwill allow researchers to systematically create opportunities to pause, reflect, andmake decisions to improve data analysis.Figure 3. Screen capture of the code window in Dedoose. Selection of a code,such as “Easiness,” shows all excerpts coded in that category. By making theseset active, subsets of excerpts linked to a second code, such as “One-ReasonDecision Making,” can be identified. Copyright 2013 Dedoose Version 4.5,web application for managing, analyzing, and presenting qualitative andmixed method research data (2013). Los Angeles, CA: SocioCultural ResearchConsultants, LLC (www.dedoose.com).Annotating DataQualitative data analysis demands researchers to constantly discuss theirideas and reflect on their actions and interpretations. Researchers must ensurethat they record their thoughts, insights, questions, and concerns as they delveinto the data. When done manually, this writing process may become messyand inconsistent as researchers deal with different data sources and analyticalcomponents, and use a variety of annotating strategies and procedures. CAQDASpackages facilitate these tasks by providing tools that researchers can use to buildnotes, comments, memos, or entire research journals that can be linked to one ormore pieces of the software project, from single documents, to segments within adocument, to individual codes in the coding scheme. These writing elements canbe built purposely as research journals or spontaneously as researchers interact90In Tools of Chemistry Education Research; Bunce, D., et al.;ACS Symposium Series; American Chemical Society: Washington, DC, 2014.
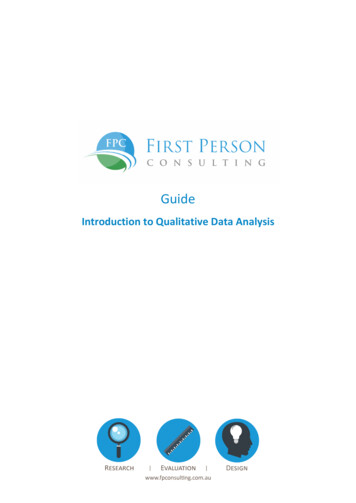
Downloaded by Vicente Talanquer on August 1, 2014 http://pubs.acs.orgPublication Date (Web): July 31, 2014 doi: 10.1021/bk-2014-1166.ch005with the data; they can be managed in systematic ways, searched and retrievedwhen needed, and exported to be printed or saved as external documents.Using a laptop or tablet computer, qualitative software can be used to directlywrite observational logs or field notes to be integrated as data sources into theresearch project. CAQDAS packages can also be useful in keeping research diariesor journals that record day-to-day project activities. Commercially availableapplications have been designed to facilitate the spontaneous construction ofanalytic memos to aid during the coding and interpretative processes. Thesememos can be used for multiple purposes, such as making comments on specificaspects of the data, posing questions for further reflection, recording tentativeinterpretations, or sharing thoughts with other researchers who may have accessto the data. The ability to link these memos to other objects (documents,data segments, codes) allows researchers to integrate their thoughts with othercomponents of the project.Visualizing DataCAQDAS packages can also be used to create visual representations suchas maps, diagrams, and graphs that aid analysis by more readily revealing trendsand relationships, and helping researchers in the development of interpretations.These visual representations are usually linked to the underlying data used in theirconstruction, allowing researchers to easily move back and forth between the dataand the graphic model.Software applications such as ATLAS.ti, MAXQDA, and NVivo includea variety of mapping tools to build networks (ATLAS.ti), maps (MAXQDA),or models (NVivo). These tools include: icons to represent codes, memos,documents, or theoretical concepts; connectors to link these objects; and linkinglabels to define the nature of the connections. These resources can be used tobuild visual constructs that resemble interactive concept maps that elicit relevantthemes and relationships emerging from the data analysis. A good exampleof the use of these visual and conceptual aids in chemistry education researchcan be found in the study by Del Carlo and Bodner on students’ perceptions ofacademic dishonesty (24). As shown in this work, these types of representationsare very useful in creating visual structures of complex systems and phenomena.Nevertheless, it is important to keep in mind that these maps are built with inputfrom the researcher and should thus be interpreted with caution.The on-line software Dedoose does not include mapping functionalitiesbut is designed to support the graphic visualization of data. For example, theapplication can be used to visualize code frequencies as a function of selecteddescriptors, or the degree of co-occurrence of two or more codes in definedsets of data (other CAQDAS packages also include this latter functionality).The resulting graphs are interactive and the associated qualitative data can beexplored by clicking on different portions of a graph. All these results can beexported to external documents or printed if needed. Figure 4 illustrates some ofthe graphical representations that provided insights into trends and relationshipsin our Assumptions and Heuristics project. These graphs revealed, for example,the overreliance of our study participants on the assumption of “Easiness” in91In Tools of Chemistry Education Research; Bunce, D., et al.;ACS Symposium Series; American Chemical Society: Washington, DC, 2014.
Downloaded by Vicente Talanquer on August 1, 2014 http://pubs.acs.orgPublication Date (Web): July 31, 2014 doi: 10.1021/bk-2014-1166.ch005making predictions about the thermodynamic likelihood of chemical reactions(17). Similarly, they helped us identify the correlation between the application ofthis assumption and the use of a “One-Reason Decision Making” heuristic. Thesoftware also allowed us to explore how these patterns of reasoning were affectedby the nature of the question posed, the gender of the participants, and their finalgrade in the general chemistry course.Figure 4. Examples of the types of graphic representations generated by Dedoosebased on code frequencies. The pie chart on the left shows the relative frequencyof all codes; the graph to the right displays the degree of co-occurrence ofdifferent codes. Copyright 2013 Dedoose Version 4.5, web application formanaging, analyzing, and presenting qualitative and mixed method researchdata (2013). Los Angeles, CA: SocioCultural Research Consultants, LLC(www.dedoose.com).Other FunctionalitiesCommon CAQDAS packages include other tools and functionalities notdescribed in previous sections that can greatly facilitate data management andanalysis. For example, these applications have basic editing tools that allowresearchers to color, underline, embolden, or italicize words or phrases to makethem more salient. Most of these computer programs also incorporate searchengines that can be used to track specific words or run word frequency checks.Additionally, many systems allow the creation of hyperlinks between differentpoints in the dataset, which can be used to link specific parts of different documentsto track a line of reasoning, compare and contrast approaches to solve a givenproblem, or associate consistent ideas. All of these tools are particularly usefulwhen performing text or discourse analysis (8, 9). Nevertheless, researchersshould be cautious when using search tools to avoid building coding systems thatare based on the mere frequency of specific words.92In Tools of Chemistry Education Research; Bunce, D., et al.;ACS Symposium Series; American Chemical Society: Washington, DC, 2014.
Downloaded by Vicente Talanquer on August 1, 2014 http://pubs.acs.orgPublication Date (Web): July 31, 2014 doi: 10.1021/bk-2014-1166.ch005More recent innovations in CAQDAS packages include tools to capture datafrom web pages, social media, and tweets that can be directly incorporated intothe software projects. The number of different text, audio, and video formats thatcan be directly imported into the applications is steadily increasing. Systems likeDedoose, which is an on-line application, allow multiple researchers in differentlocations to simultaneously work and collaborate on the same project. Traditionalstand-alone software packages, such as NVivo, are quickly incorporating similarcapabilities, allowing multiple users to access the same files when working withthe same computer or with a set of interlinked devices. Access to the samedata pool by several researchers facilitates the comparison of coding done bymultiple users, and the calculation of inter-rater reliability coefficients (25) withinthe CAQDAS package. For example, ATLAS.ti includes functionalities forcalculating Cohen’s kappa and Krippendorff’s alpha, while Dedoose facilitatesthe calculation of percentage of agreement between multiple researchers. Easyaccess to a software project by multiple people creates unique opportunities tonot only carry out collaborative research, but to interactively train researchers inthe use of qualitative methods of data analysis.Final ConsiderationsThe use of software to support qualitative data analysis is often associatedwith certain “myths” that it is important to dispel (26). On the one hand, somepeople envision CAQDAS packages as all-powerful tools capable of completingdata analysis without much input from the researcher. On the other hand, othersjudge that the use of these applications will constrain researchers’ ability to controlthe direction and approach to the analysis of the data. As shown in this chapter,none of t
The analysis of qualitative data involves a variety of tasks: copying, transcribing, and organizing data; segmenting and coding transcripts, images, audio,andv