Transcription
Blake et al. International Journal of Behavioral Nutrition and Physical Activity(2021) EARCHOpen AccessThe ‘Eat Well @ IGA’ healthy supermarketrandomised controlled trial: processevaluationMiranda R. Blake1* , Gary Sacks1, Christina Zorbas1, Josephine Marshall1, Liliana Orellana2, Amy K. Brown3,Marj Moodie1,4, Cliona Ni Mhurchu5, Jaithri Ananthapavan1,4, Fabrice Etilé6 and Adrian J. Cameron1AbstractBackground: Successful implementation and long-term maintenance of healthy supermarkets initiatives are crucialto achieving potential population health benefits. Understanding barriers and enablers of implementation of realworld trials will enhance wide-scale implementation. This process evaluation of a healthy supermarket interventionsought to describe (i) customer, retailer and stakeholder perspectives on the intervention; (ii) interventionimplementation; and (iii) implementation barriers and enablers.Methods: Eat Well @ IGA was a 12-month randomised controlled trial conducted in 11 Independent Grocers ofAustralia (IGA) chain supermarkets in regional Victoria, Australia (5 intervention and 6 wait-listed control stores).Intervention components included trolley and basket signage, local area and in-store promotion, and shelf tagshighlighting the healthiest packaged foods. A sequential mixed-methods process evaluation was undertaken.Customer exit surveys investigated demographics, and intervention recall and perceptions. Logistic mixed-modelsestimated associations between customer responses and demographics, with store as random effect. Supermarketstaff surveys investigated staff demographics, interactions with customers, and intervention component feedback.Semi-structured stakeholder interviews with local government, retail and academic partners explored interventionperceptions, and factors which enabled or inhibited implementation, maintenance and scalability. Interviews wereinductively coded to identify key themes.Results: Of 500 customers surveyed, 33%[95%CI:23,44] recalled the Eat Well @ IGA brand and 97%[95%CI:93,99]agreed that IGA should continue its efforts to encourage healthy eating. The 82 staff surveyed demonstrated veryfavourable intervention perceptions. Themes from 19 interviews included that business models favour sales ofunhealthy foods, and that stakeholder collaboration was crucial to intervention design and implementation. Staffsurveys and interviews highlighted the need to minimise staff time for project maintenance and to regularly refreshintervention materials to increase and maintain salience among customers.(Continued on next page)* Correspondence: miranda.blake@deakin.edu.au1Deakin University, Geelong, Global Obesity Centre, Institute for HealthTransformation, Locked Bag 20000, Victoria 3220 Geelong, AustraliaFull list of author information is available at the end of the article The Author(s). 2021 Open Access This article is licensed under a Creative Commons Attribution 4.0 International License,which permits use, sharing, adaptation, distribution and reproduction in any medium or format, as long as you giveappropriate credit to the original author(s) and the source, provide a link to the Creative Commons licence, and indicate ifchanges were made. The images or other third party material in this article are included in the article's Creative Commonslicence, unless indicated otherwise in a credit line to the material. If material is not included in the article's Creative Commonslicence and your intended use is not permitted by statutory regulation or exceeds the permitted use, you will need to obtainpermission directly from the copyright holder. To view a copy of this licence, visit http://creativecommons.org/licenses/by/4.0/.The Creative Commons Public Domain Dedication waiver ) applies to thedata made available in this article, unless otherwise stated in a credit line to the data.
Blake et al. International Journal of Behavioral Nutrition and Physical Activity(2021) 18:36Page 2 of 13(Continued from previous page)Conclusions: This process evaluation found that interventions to promote healthy diets in supermarkets can beperceived as beneficial by retailers, customers, and government partners provided that barriers including staff timeand intervention salience are addressed. Collaborative partnerships in intervention design and implementation,including retailers, governments, and academics, show potential for encouraging long-term sustainability ofinterventions.Trial registration: ISRCTN, ISRCTN37395231 Registered 4 May 2017.Keywords: Supermarket, Intervention, Shelf tag, Signage, Process evaluation, Perceptions, Consumer, AustraliaBackgroundSupermarkets are the leading source of food and beverage purchases globally [1] and are therefore a major influence on population diet and health [2]. The smallnumber of in-store supermarket interventions designedto promote healthier diets (‘healthy supermarket initiatives’) conducted to date have demonstrated short-termpotential to improve the healthiness of consumer purchases by changing aspects of the ‘4Ps’ of marketing:Product, Promotion, Place [3] and/or Price [4, 5] tofavour healthier foods and beverages. Population healthbenefits require such changes to be maintained in thelong-term. Understanding the barriers and enablers ofsuccessful implementation and maintenance can provideuseful information for wide-scale implementation ofhealthy supermarket initiatives and therefore should be aresearch priority [6].The sustainability of healthy supermarket interventions refers to both the maintenance of the interventionand capacity to sustain intervention effects into the future [7]. This may depend on a number of interrelatedfactors associated with the interventions themselves andthe context within which they are implemented. Processevaluations of previous supermarket and grocery storeinterventions [8–11] have identified barriers to implementation and sustainability that include excessive retailer staff time and resource requirements [9], whereasenablers included perceived high customer satisfaction[8, 9] and improved retail brand image [9].We are not aware of any mixed-methods process evaluations of supermarket initiatives that have consideredthe perspectives of customers, staff and other key stakeholders together. Critically, previous supermarket interventions and related process evaluations have generallybeen conducted 3 to 6 months into a project [8, 9, 11].Process evaluations of supermarket interventions overthe longer-term are essential to determine the potentialfor real-world sustainability and scalability, which relieson changes being maintained and adapted at scale overmany months or years.Here, we conduct an evaluation during and following a12-month supermarket healthy eating intervention, ‘EatWell @ IGA’ which aimed to improve the healthiness ofcustomer purchases and increase sales of healthier packaged products and fresh produce. The process evaluationsought to investigate the experiences of customers, staffand stakeholders involved in Eat Well @ IGA development and implementation. The objectives were to (i) describe customer, retailer and stakeholder perspectives ofthe Eat Well @ IGA intervention; (ii) describe intervention implementation and any variation across intervention sites; and (iii) explore barriers and enablers ofimplementation.MethodsOverviewAn overview of the development, timelines, and methodsused in the Eat Well @ IGA project [12] has been previously published [13]. The timeline specific to the processevaluation is shown in Fig. 1.Briefly, the Eat Well @ IGA project began in 2015 as aseries of three short-term retailer-conceived healthysupermarket trials, implemented and evaluated in collaboration with local government and academic partners.The Eat Well @ IGA Randomised Controlled Trial(RCT) was a 12-month, multi-component interventionconducted between May 2017 and May 2018 in 11 Independent Grocers of Australia (IGA) supermarket storesin regional Victoria, Australia (5 intervention and 6wait-listed control stores). Stores were recruited for RCTparticipation via the supermarket advertising collectiveof seven store owners (total 11 stores), which includedthe supermarkets that participated in the initial shortterm trials. All stores agreed to participate in the intervention and evaluation.The intervention included three components: (i) signage (trolley and basket signs, floor signs, aisle fins,healthy food posters, and shelf signs (“wobblers”)); (ii)local area and in-store promotion (flyers (mailers andin-store), social media, and launch event and relatedmedia); and (iii) shelf tags highlighting (healthiest) packaged foods store-wide (defined as all products with 4.5or 5 stars according to the voluntary governmentendorsed Australian and New Zealand front-of-packHealth Star Rating (HSR) system [14]). The processevaluation of the multi-component intervention is the
Blake et al. International Journal of Behavioral Nutrition and Physical Activity(2021) 18:36Page 3 of 13Fig. 1 Timeline of Eat Well @ IGA randomised controlled trial and process evaluationfocus of the current paper. A summary of the results ofthe Eat Well @ IGA RCT on supermarket sales has beenpublished separately [13]. Briefly, preliminary resultsbased on multi-level modelling show that the Eat Well@ IGA intervention was associated with slight significantincreases in the sales of products with a Health Star Rating of 4.5 or higher, and in sales of fruits and vegetables,but had no significant effect on overall sales of healthy‘core’ food according to the Australian Dietary Guidelines [15]. Retailers reported that there was no overall effect of the intervention on profit.In addition, researchers collected intervention monitoring data to establish the fidelity of implementation(findings to be published in a separate paper alongsidechanges in supermarket sales). In summary, initial doseof intervention components varied across stores, mainlydue to variation in store size. HSR shelf tags and trolleyand basket signs were maintained at close to 100% fidelity throughout the intervention period. Display of posters, aisle fins and shelf wobblers initially increased asstore staff gradually implemented all the signage, andthen decreased from October 2017 to the end of the official intervention period in May 2018.A sequential mixed-methods process evaluation wasundertaken that included customer surveys (October2017), staff surveys (August 2018) and qualitative stakeholder interviews (August to October 2018) (Fig. 1).Customer surveys were conducted in the five intervention stores during the trial period, and staff surveys andstakeholder interviews were conducted in both the fiveintervention stores and the six wait-listed control storesafter completion of the trial (May 2018) when bothintervention and wait-listed control stores were self-maintaining the intervention. We used findings fromcustomer surveys to develop methods for subsequentstaff surveys, and then used customer and staff surveyfindings to develop interviews (explained in detailbelow).Constructs for investigation and selection of measurement tools were informed by: established process evaluation frameworks including RE-AIM [16]; the Diffusionof Innovations theory [17] which describes how an ideaor innovation is spread and adopted within a social system and characteristics of interventions likely to spread;Baranowski and Stables’ methodological guide [6] to assessment of key process evaluation constructs; as well asthe intervention’s program logic model [13].Customer surveysOverviewCustomer exit surveys were conducted at all five intervention stores approximately 6 months into the intervention (October 2017) to collect self-reported data on (i)intervention reach including customer demographics; (ii)recall of the intervention; (iii) perceptions of overallintervention, specific intervention components, and potential alternate or additional interventions (measuredon seven-point Likert scales; 1 ‘strongly dislike’, 7 ‘strongly like’); and (iv) perceptions of overall intervention and individual component effectiveness in promoting healthier choices. Survey questions were developedbased on constructs relevant to the specific interventioncomponents, informed by previous retail customer surveys [18], and adapted from questions successfullypiloted in the three previous Eat Well @ IGA short-termtrials. See Additional file 1 for full customer survey.
Blake et al. International Journal of Behavioral Nutrition and Physical ActivitySampling and recruitmentExiting customers at the five stores who were aged 18years or older and the main grocery buyer in theirhousehold were invited to self-complete the approximately 10-min, anonymous, paper-based survey. Samplesize was decided based on pragmatic considerations andconsidering the primary purpose of the survey that wasto provide feedback to the retailers on customer satisfaction and intervention component recall. A sample of 100customers per intervention store was considered largeenough to estimate the prevalence of binary outcomeswith 95% confidence intervals which in the worst case(50% prevalence) would have a 20% total width.(2021) 18:36Page 4 of 13text questions on personal demographics, interactionswith customers, and attitudes towards the overall intervention and its specific components. Questions from thefull questionnaire are mapped to these concepts and toBaranowski and Stable’s process evaluation framework[6] in Additional file 2.Sampling and recruitmentAll staff within all 11 stores (including the 5 interventionand 6 wait-listed control stores) were eligible to participate. After receiving consent from store managers, flyerswere displayed in staff rooms and/or notice boards inviting staff to complete the paper-based survey.AnalysisAnalysisCustomer perceptions of intervention components andsuggestions for additional healthy food initiatives at thesurvey store were dichotomised for analysis due to extreme skewness of the distribution of the responses tomany questions (1 to 4 unfavourable or neutral impression/ unsupportive or neutral support; 5 to 7 favourable impression/ supportive). Customer demographics were also dichotomised: age (18 to 54 years; 55years and older), gender (male; female), area-based socioeconomic status according to postcode (Socio-Economic Indexes for Areas (SEIFA) Index of RelativeSocio-Economic Disadvantage (IRSD)) [19] (lower halfof SEIFA percentiles; upper half of SEIFA percentiles),educational attainment (less than university degree; university degree or higher), and frequency of customervisits (never, rarely or sometimes shop at survey store;always or usually shop at store). Heterogeneity of customer demographics across stores was assessed usingthe Chi-squared test. Overall proportion of customers ineach demographic group (and 95% CI), and associationsbetween customers’ perceptions and customer demographic variables were estimated using mixed-effects logistic models with the demographic variable as a fixedeffect and store as random effect to account for the clustering induced by store. The intracluster correlation coefficient (ICC) is reported as a measure of variability ofcustomer recall across stores.Results at p 0.05 were considered statistically significant. Stata version 15 was used for all analyses.Descriptive statistics were used to summarise findingsand inform development of stakeholder interviewquestions.Staff surveyOverviewAnonymous staff surveys were self-completed in August2018, 3 months after the end of the RCT interventionperiod during the retailer-led maintenance period to (i)investigate staff involvement with and attitudes towardsthe intervention, and (ii) assess perceptions of customerresponse to the intervention. Surveys took approximately10 min to complete and included closed-ended and free-Stakeholder interviewsOverviewThe first author (MRB) conducted semi-structured interviews with stakeholders from intervention and selectedwait-listed control stores at 15–17 months following thestart of the RCT (August to October 2018, during theretailer-led maintenance period in intervention andwait-listed control stores). Stakeholders were defined asthose involved in co-designing and managing the intervention, and those responsible for intervention implementation. Interviews aimed to explore (i) stakeholderperceptions of the Eat Well @ IGA intervention; (ii) factors which enabled or inhibited intervention implementation and may affect maintenance and scalability; and(iii) explanations for customer and staff survey findings.Interview questionsThe 30–60-min interviews focused on interview participant roles, intervention advantages, disadvantages, unication, and potential improvements for the EatWell @ IGA intervention. Interview questions were developed by the research team to address key concepts ofthe Diffusion of Innovations theory [17] and RE-AIMframework [16]. Questions are mapped to these conceptsin the full discussion guide (see Additional file 3). Questions were tailored to stakeholder roles.Sampling and recruitmentInterviewees were purposively selected given their likelydepth of knowledge regarding different components ofthe intervention, lines of communication and relationships between intervention partners (academic, retail,and government bodies) (see Additional file 4 for linesof communication) and selected to explore predicted
(2021) 18:36Blake et al. International Journal of Behavioral Nutrition and Physical Activitycauses of heterogeneity in implementation betweenstores (e.g., customer demographic composition). It wasestimated that interviewing 15 to 20 key stakeholderswould cover the breadth and depth of perceptions relating to the intervention. The interviewees comprised thelocal government officer responsible for research-retailerliaison, one supermarket group marketing manager, themain store group chief executive officer, all RCT intervention store managers (five), two store managers fromhighest and lowest SEIFA control stores, four groceryand fresh produce department managers from intervention stores with the lowest and highest SEIFA, three researchers (research lead; the data manager; and aresearch assistant), and two store owners.AnalysisInterviews were audio recorded and transcribed verbatim. Interview transcripts were sent to participants forverification; participants did not express any concernsand no changes were made. Inductive coding and ablock and segment analysis approach were used to identify key interview themes and sub-themes using NVivoqualitative data management software [20]. Coding wasinitially completed by an experienced qualitative researcher (MRB). A subset of 11 interviews was independently cross-coded by a second experiencedqualitative researcher (CZ), and both coders discussedfindings to decide on final themes.ResultsCustomer surveysFive hundred customers completed surveys at the fiveintervention stores (range: 97–104 per store) in October2017 (Table 1). Respondents were more likely to be female (72%), 55 years or older (65%), have a higher areabased socioeconomic status (SEIFA) (61%), and speakPage 5 of 13English at home (100%) compared to the Victorianpopulation. Sixty-four percent of respondents always orusually did their main planned (e.g. weekly/fortnightly)shop at the survey store. There was heterogeneity acrossstores by whether customers conducted their regularweekly shop always or usually at the survey supermarket,educational attainment, and area-based socioeconomicgroupings (SEIFA), reflecting the location of participating stores (all p 0.01).Thirty-three percent [95%CI:23,44] of respondentsrecalled the Eat Well @ IGA project brand overall whenprompted (see Table 2). Generally, half or fewer respondents recalled each intervention component. The highestrecall was for the healthy food posters (49%[95%CI:37,61]), and the lowest for social media (12%[95%CI:7,18]).Some customers reported that Health Star Rating (HSR)shelf tags (49%[43,56]), posters (49%[95%CI:37,61]), shelfsigns (29%[95%CI:30,43]), and trolley and/or basket signs(18%[95%CI:14,23]), influenced their food choices. Ofthose who said that trolley and/or basket signs had influenced their purchases, 69%[95%CI:49,84] reported thatsigns increased purchases of foods which correspondedto the core food groups from The Australian DietaryGuidelines (grains; vegetables and legumes/ beans; fruit;lean meats and alternatives; and dairy and alternatives)[15]. ICC estimates for intervention component recallranged from 0.009 (letterbox flyers) to 0.113 (staff tshirts), suggesting variation across stores for some components (Additional file 5, Table S1).Customer perceptions were generally skewed towardsmore favourable ratings, with all intervention components receiving median ratings of 5 or 6 out of 7 (Additional file 5, Table S2).Respondents overwhelmingly agreed that IGA shouldcontinue its efforts to encourage healthy eating(97%[95%CI:93,99]) (Table S3). Three percent [95%CI:1,Table 1 Demographic characteristics of customer survey participants (n 500)CharacteristicOverallnStore 1(n 104)Store2 (n 97)Estimatedpercentage[95%CI] aStore 3(n 101)Store 4(n 100)Store 5(n 98)Heterogeneityacross stores(p-value) bState ofVictoria(%)Proportion (%)Female355 72 [68,76]67757075740.65051.9 cAged 55 years322 65 [61, 70]63686572600.44533.0 cHigh SEIFAd284 61 [16, 93]792931089 0.001 50University degree or higher165 34 [26,42]2432342752 0.00124.3 cRegular weekly shop alwaysor usually at this store234 64 [56,72]67716073490.010N/AShop regularly at competitor 463 93 [90, 95]supermarket92929093960.621N/An 500 customer surveys at the 5 intervention stores, range of 97 to 104 surveys per store. N/A data not availableaEstimated using univariate logistic models with store as random effect to account for the clustering induced by store. b Chi-squared test of differences inproportions across stores; c Persons 15 years and older; d SEIFA, Index of Relative Socio-Economic Disadvantage- Socio-Economic Indexes for Areas [19]. ‘High’SEIFA reflects top half of Victorian SEIFA groupings
33 [23, 44]44 [33,56]48 [40,57]49 [37,61]37 [30,43]14 [10,17]24 [15,37]12 [7,18]Eat Well @ IGA overallTrolley and/or basket signsHSR shelf tagPostersShelf signsLetterbox flyersStaff t-shirtsSocial media50 [37,63]13 [7,21]26 [15,41]13 [9,20]45 [37,54]64 [51,76]56 [45,66]11 [7,18]24 [14,37]13 [10,18]33 [27,40]42 [30,55]45 [36,54]42 [31,54]31 [22, 41]10 [6,19]23 [13,38]12 [8,20]30 [22,39]41 [28,56]43 [32,54]41 [28,55]25 [16,37]Male(n 137)37 [26, 49]Gender18-54y(n 172)55y and older(n 324)AgeCustomer demographic subgroups b13 [8,19]25 [15,38]14 [10,19]40 [33,47]52 [39,65]50 [41,59]46 [35,58]36 [26,48]Female(n 357)14 [9,24]23 [13,39]12 [7,20]35 [27,45]50 [35,65]44 [32,57]38 [24,54]35 [24,48]Low(n 213)SEIFA10 [6,16]25 [14,39]14 [10,21]37 [30,45]52 [35,62]51 [40,62]49 [34,64]31 [21,43]High(n 285)12 [8,19]25 [15,39]14 [10,18]36 [29,43]47 [35,59]47 [39,56]42 [32,54]32 [22,42]High school orlower (n 327)10 [6,18]23 [13,37]13 [8,19]39 [31,48]55 [41,68]50 [40,61]48 [36,61]37 [26,49]University orhigher (n 165)Educational attainment13 [9,18]28 [18,40]16 [9,26]41 [32,50]56 [43,69]52 [40,63]49 [34,64]35 [24,49]12 [8,19]25 [15,38]6 [2,13]30 [21,40]45 [32,60]43 [31,56]36 [23,53]25 [15,39]Infrequent(n 235)Store shopping frequencyRegular(n 136)All questions scored as Yes/No recall of components. Bolding indicates significant difference (p 0.05) between subgroups. HSR Health Star Rating; IGA Independent Grocers of Australia; SEIFA Index of Relative SocioEconomic Disadvantage- Socio-Economic Indexes for Areas. a Estimated using logistic mixed-effects models with store as random effect to account for the clustering induced by store. b Estimated using logistic mixedeffects logistic models with the demographic variable as a fixed effect and store as random effect.Overall a(n 500)Project componentrecall (estimatedpercentage [95%CI])Table 2 Customer recall of Eat Well @ IGA project components (n 500), October 2017Blake et al. International Journal of Behavioral Nutrition and Physical Activity(2021) 18:36Page 6 of 13
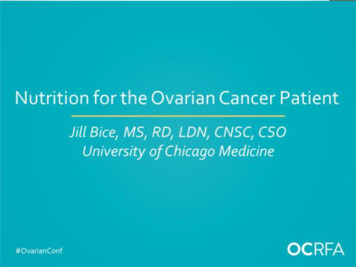
Blake et al. International Journal of Behavioral Nutrition and Physical Activity6] of respondents reported they were new customers tothe store because of the intervention and 7%[95%CI:5,9]reported they had increased their shopping frequency atthe store as a direct result of the intervention (only onecustomer reported they were shopping less frequently).Customer subgroup analyses resultsCustomer subgroup analyses are reported in Table 2 andAdditional file 5 (Tables S2 and S3). Respondents 55years and older were less likely to recall Health Star Rating (HSR) shelf tags (p 0.03), posters (p 0.01), andshelf signs (p 0.01). Compared to infrequent shoppers,regular shoppers were up to twice as likely to recall theproject overall (p 0.05), trolley and basket signs (p 0.03), shelf signs (p 0.05) and letter box flyers (p 0.01). There was no difference in project or componentrecall between gender, educational attainment or Socioeconomic Index for Areas (SEIFA) levels (all p 0.05).Respondents 55 years and older generally rated theirperceptions of study components more highly thanyounger respondents (18 to 54 years) (Table S2). Femalerespondents gave higher ratings to the intervention overall as well as most components than male respondents,as did shoppers with higher compared to lower socioeconomic position (all p 0.05) (Table S2). Regular survey store shoppers rated all components more highlythan infrequent shoppers (all p 0.03), except floor signs(p 0.09) and social media (Table S2). There was no difference in perceptions of project components by educational status. All subgroups had a mean of at least 94%support for IGA continuing its efforts to encouragehealthy eating (Table S3). All subgroups had a mean ofat least 75% support for new interventions of healthierproducts at the end of aisles and availability of healthyrecipes in-store (Table S3).Staff surveysA total of 82 staff from 11 stores completed surveys inAugust to September 2018 (see Additional file 6, TableS4 for respondent demographics). No differences werefound in staff characteristics between intervention andwait-listed control store surveys, hence we present overall results. The most frequent respondent role was department manager (29%). Eighty percent of staff hadbeen employed in their particular store for 2 years ormore, meaning that they had been employed prior to theimplementation of Eat Well @ IGA. Most respondents(84%) reported that they had not been directly involvedwith installation or maintenance of Eat Well @ IGA.Staff had very favourable perceptions of Eat Well @IGA overall (median 6 [5, 7] on 7-point Likert scale) andspecific intervention components (see Additional file 6,Table S5). The most frequently cited components that“worked well” were trolley/ basket signs (27%(2021) 18:36Page 7 of 13respondents), followed by HSR shelf tags (11%) and floorsign (11%), which staff reported to be the most noticeable by customers (Additional file 6, Table S6). Themost frequently cited components that “did not workwell” were the HSR shelf tags (17% respondents),followed by shelf signs (10%). The tags were noted to falloff easily. The shelf signs were noted to both fall off easily and get in the way of other products and signage(Additional file 6, Table S7). Most staff (78%) had rarelyor never received feedback from customers relating toEat Well @ IGA or its components (Additional file 6,Table S8). The majority of feedback received, however,was very or slightly positive (e.g. “sending a positivemessage to customers”), or otherwise neutral (e.g. “[customer surprised] at the low star rating of products”).Only one respondent reported receiving “slightly negative” customer feedback, and none reported “very negative” feedback.The majority of staff (93%) thought Eat Well @ IGAwould be maintained at their store in the future. Reasonsfor thinking the intervention would not be maintainedvaried but comments included “It’s not maintained noweither”, and that profit would be the main driver ofsupermarket strategies (e.g. “[price] specials sell first”).Respondents were asked to rank seven additional healthyeating strategies from least to most effective in terms ofwhether they would help customers make healthychoices (Additional file 6, Table S9). The highest medianranked option was “Price discounts on healthy foods anddrinks” (2 [1, 3] out of 7). The lowest ranked was “Onecheckout that doesn’t display unhealthy food” (7 [6, 7]).Stakeholder interviewsNineteen stakeholders participated in interviews betweenAugust and October 2018 (95% response rate). Seventynine percent of interviewees were male, and all had beenin their current role for at least 6 months. Below, keythemes are discussed (theme and sub-theme names initalics). The themes encompass stakeholder perceptionsof the intervention including factors which enabled orinhibited intervention implementation and may affectmaintenance and scalability, as well as the perceivedintervention outcomes. The interrelationship betweenthese themes are shown in Fig. 2, with stakeholder collaboration and co-participation in planning, implementation and evaluation of the intervention (the “Co-design”approach) central to the project. A full table of themesand sub-themes is found in Additional file 7.Theme 1: Consider the influence of industry and publichealth context on interventionInterviewees described multiple contextual factors thatinfluenced the implementation of Eat Well @ IGA –namely, the broader supermarket industry context
Blake et al. International Journal of Behavioral Nutrition and Physical Activity
media); and (iii) shelf tags highlighting (healthiest) pack-aged foods store-wide (defined as all products with 4.5 or 5 stars according to the voluntary government-endorsed Australian and New Zealand front-of-pack Health Star Rating (HSR) system [14]). The process evaluation of the multi-component intervention is the