Transcription
PAT and UPLC Round TableIntroducing PATROL SystemsDavid LascouxJean-Michel PlankeeleBiopharma LC MeetingEschborn, October 17th 2012 Waters Corporation1
What Is PAT?What Are the PATROL Systems For? PAT, PATROL: Process Analytical Technology– ICH Guideline Q8(R2) and ICH Q9 & Q10 :oA system for designing, analyzing, and controllingmanufacturing through timely measurements (i.e., duringprocessing) of critical quality and performance attributes of rawand in-process materials and processes with the goal of ensuringfinal product quality All tools (techniques) for measuring/controlling the quality ofany (chemical/production) process What is the Purpose of PAT?– Improve knowledge (about a process) & reduce variability– Improve the process– Implementation of a QbD approach with real time data 2012 Waters Corporation2
Sensor Technology Utilized forPAT Applications Today Probes (Temp, pH)Dissolved Gas (02, CO2)Total Organic Carbon (TOC)Near-Infrared (NIR)Infrared (IR)RamanUV-visibleFourier Transform Infrared (FTIR)X-Ray Powder Diffraction (XRPD) Real time, simple, non destructive, fast response But not quantitative, not specific, lack of resolution 2012 Waters Corporation3
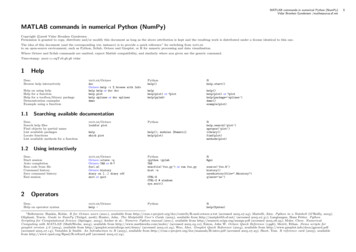
Liquid ChromatographyLab Analysis Reference Standard HPLC is a major analytical technique in every QC lab– Too slow to get a “real-time” answer– But it is not a major tool for Online/At-line analysis UPLC overcomes limitations of HPLC– Performance improvements– Richer information– Increased speed times of 10x or fasterEnd ofProcessUPLCHPLC0 2012 Waters Corporation3691215 182124 27Minutes30 3336394
Waters’ answer and solutionsPATROL System UPLC power– « UPLC Inside » systems– Speed, resolution, sensitive Specially designed autosampler : PSM– At-line and On-line sampling– Automated dilutions Rugged configurations for unattended use Three configurations meeting lab/pilot and production scales– Patrol UPLC Laboratory Analyzer– Patrol UPLC Pilot system– Patrol UPLC Process Analyzer (in the manufacturing area) Connections with lab/plant environment– Fluidics (eg sterile sampling)– Informatics : DCS and Data management 2012 Waters Corporation5
PATROL UPLC Process AnalyzerThree ConfigurationsLaboratory/Pilot SystemProcess SystemEmpowerPATmanagerPDA / TUVUPLC CMUPLC ProcessSample ManagerUPLC BSM PATROL Flex cart ELSD or SQD or TQD PATROL Lab PC 2012 Waters Corporation Stainless steel cabinet Solvent & containers Corporate network6
Biopharmaceutical ProcessLC Dependant Large Molecule ApplicationsUPSTREAM 2012 Waters CorporationDOWNSTREAM7
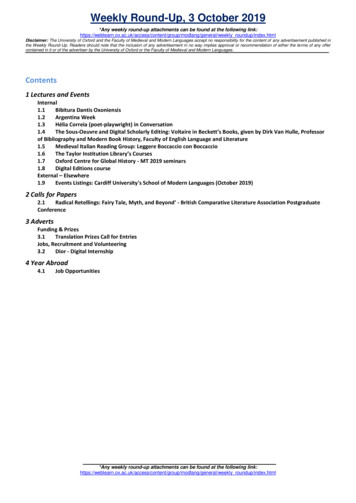
Starting MaterialOn-Line Reaction MonitoringAU1.40 As the reaction progresses youmap the formation of the API andthe consumption of the startingmaterialInjection #10.00AUProcess Impurity 21.400.700.00Process Impurity 3Starting MaterialAPIAPI0.70Injection #14Injection #37Peak Area %700.250.500.751.00Process Impurity 4Process Impurity 3Starting MaterialAPIProcess Impurity 1AU0.70Process Impurity 2Injection #601.401.259080Process Impurity 40.00Process Impurity 3Starting MaterialAPIProcess Impurity 1AU0.70Process Impurity 21001.400.000.00 Additionally because of the highlinear range of the detector, youcan also monitor the formation ofany low level jection #Minutes 2012 Waters CorporationAPIStarting MaterialProcess Impurity 1Process Impurity 2Process Impurity 3Process Impurity 48
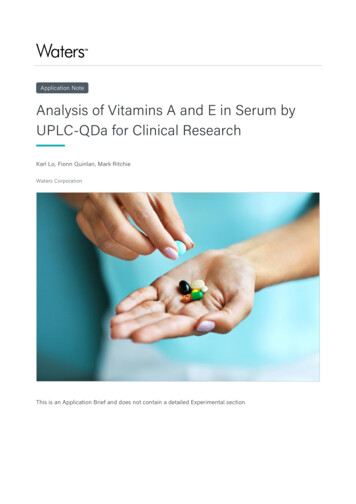
Downstream Processingoff-line, HPLC control of fractions 40 minute analysis A minimum of 160Lrequires reprocessing Initial processrecovery yield 40% Final recovery yieldafter reprocessing58%012 hoursCOLLECTREPROCESSWASTEMain Peak widths are measured in Hours 2012 Waters Corporation9
Downstream Processingon-line, UPLC control of fractions3.5 minute analysis No fractions needto be reworked Total initial processrecovery yieldof 87% (40%/58%) 6 month ROI (1 of 4steps)012 hoursCOLLECTWASTEMain Peak widths are measured in Hours 2012 Waters Corporation10
Downstream ProcessBiopharmaceutical Purity AnalysisHPLC Analysis 40 minute chromatography Initial process recovery - 40% 160L reprocessed at minimum Final recovery after reprocessing:58% 2012 Waters CorporationUPLC Analysis 3.5 minute chromatography No reprocessing requiredTotal initial process recovery:87%6 month ROI11
Biopharmaceutical ProcessLC Based Application OpportunitiesCleaning validationAdditional process stepsWasteStreamWaste water testing 2012 Waters Corporation12
Opening Questions Would direct transfer method & process be beneficial?– Improve handshake between development and production?– Minimize scale up risk?– Enable broader use of scientific information? How does “real time” monitoring & control benefit your process?– Enable improved yields & cycle times while reducing offline testing?– Create fewer operator, dilution or equipment variability errors?– What is the commercial value of this impact? Can technology effectively extend the life of your product?Time to Market (12-14 yrs)Sales/Profits (10-12 yrs)Patent Protection (20 yrs) 2012 Waters Corporation13
Technical Overview 2012 Waters Corporation14
Waters’ answer and solutions UPLC power– « UPLC Inside » systems Specially designed autosampler : PSM– Automated dilutions– At-line and On-line sampling Rugged configurations for unattended use Two configurations meeting lab/pilot and production scales– Patrol UPLC Laboratory Analyzer– Patrol UPLC Process Analyzer Connections with lab/plant environment– Fluidics (eg sterile sampling)– Informatics : DCS and Data management 2012 Waters Corporation15
Online Process Sample ManagerFluidic ComponentsProcessPumpSamplePumpSampling ValveInject ValveDiluentPumpPrimingValveCourtesyof Bob Tacconi 2012 Waters CorporationProcess Valve16
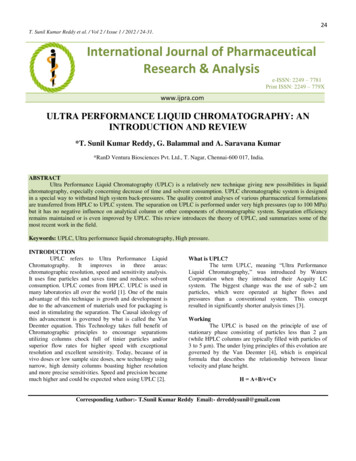
Atline Dilution CapabilitiesLinearity (n 6)Excellent linearity across the entiredilution rangeR2 0.999941/x WeightingAqueous rProtein sample dilutedwith 6M ureaUndiluted2x Dilution4x Dilution10x Dilution20x Dilution100x Dilution 2012 Waters x0.4920x0.59100x0.6617
Online InjectionsR2 0.99977 2012 Waters Corporation18
Technical Overview 2012 Waters Corporation19
Waters’ answer and solutions UPLC power– « UPLC Inside » systems Specially designed autosampler : PSM– Automated dilutions– At-line and On-line sampling Rugged configurations for unattended use Two configurations meeting lab/pilot and production scales– Patrol UPLC Laboratory Analyzer– Patrol UPLC Process Analyzer Connections with lab/plant environment– Fluidics (eg sterile sampling)– Informatics : DCS and Data management 2012 Waters Corporation20
Online Process Sample ManagerFluidic ComponentsProcessPumpSamplePumpSampling ValveInject ValveDiluentPumpPrimingValveCourtesyof Bob Tacconi 2012 Waters CorporationProcess Valve21
Sample Work Flow ComparisonACQUITY & PATROL CESSSAMPLEMANAGER 2012 Waters Corporation22
Process Sample ManagerSample/StandardInsertion Slide(open with vialpartially inserted)SampleIntroductionAccess Door(open position) 2012 Waters Corporation23
PATROL Laboratory System The Process Sample Managercan be included in UPLC (BSM)and H-Class (H-Class Bio)systems This is another samplemanager for UPLC (SM-FL, SMFTN, 2777, OSM and PSM) Empower control On-line and At-line 32 sample position Bar code reader Sample dilution 2012 Waters Corporation24
Patrol UPLC Laboratory Analyzer Designed for Lab & Pilot use Easy connection with small size reactors Flexibility of detection around PSM– TUV– PDA– FLR– DEDL 2012 Waters Corporation25
PATROL Process SystemPATROL Laboratory System UPLC based analyzer for the online /atlineanalysis of inprocess samples Online UPLC analyzes reaction progress– Measures concentration of startingmaterial, intermediate, impurities, andfinal product– Reaction stopped when residual startingmaterial target achieved or impuritiesreach a threshold value Two configurations:– Patrol Process System (explosion proofcabinet)– Patrol Laboratory System (benchtop orflex cart) Automatic or manual transfer On line dilution of samples 2012 Waters Corporation26
UPLC Module Accessand Maintenance 2012 Waters Corporation27
2012 Waters Corporation28
All tools (techniques) for measuring/controlling the quality of any (chemical/production) process What is the Purpose of PAT? -Improve knowledge (about a process) & reduce variability -Improve the process -Implementation of a QbD approach with real time data