Transcription
This is an open access article published under a Creative Commons Attribution (CC-BY)License, which permits unrestricted use, distribution and reproduction in any medium,provided the author and source are cited.Articlepubs.acs.org/acIdentification and Quantification of Microplastics in WastewaterUsing Focal Plane Array-Based Reflectance Micro-FT-IR ImagingAlexander S. Tagg,† Melanie Sapp,‡ Jesse P. Harrison,§ and Jesús J. Ojeda*,††Brunel University London, Experimental Techniques Centre, Institute of Materials and Manufacturing, Bragg Building, KingstonLane, Uxbridge, Middlesex, United Kingdom, UB8 3PH‡Fera Science Ltd., Sand Hutton, York, United Kingdom, YO41 1LZ§The University of Edinburgh, School of Physics and Astronomy, James Clerk Maxwell Building, Peter Guthrie Tait Road, Edinburgh,United Kingdom, EH9 3FDS Supporting Information*ABSTRACT: Microplastics ( 5 mm) have been documented in environmentalsamples on a global scale. While these pollutants may enter aquatic environmentsvia wastewater treatment facilities, the abundance of microplastics in thesematrices has not been investigated. Although efficient methods for the analysis ofmicroplastics in sediment samples and marine organisms have been published, nomethods have been developed for detecting these pollutants within organic-richwastewater samples. In addition, there is no standardized method for analyzingmicroplastics isolated from environmental samples. In many cases, part of theidentification protocol relies on visual selection before analysis, which is open tobias. In order to address this, a new method for the analysis of microplastics inwastewater was developed. A pretreatment step using 30% hydrogen peroxide(H2O2) was employed to remove biogenic material, and focal plane array (FPA)based reflectance micro-Fourier-transform (FT-IR) imaging was shown tosuccessfully image and identify different microplastic types (polyethylene, polypropylene, nylon-6, polyvinyl chloride,polystyrene). Microplastic-spiked wastewater samples were used to validate the methodology, resulting in a robust protocolwhich was nonselective and reproducible (the overall success identification rate was 98.33%). The use of FPA-based micro-FT-IRspectroscopy also provides a considerable reduction in analysis time compared with previous methods, since samples that couldtake several days to be mapped using a single-element detector can now be imaged in less than 9 h (circular filter with a diameterof 47 mm). This method for identifying and quantifying microplastics in wastewater is likely to provide an essential tool forfurther research into the pathways by which microplastics enter the environment.Mwith unknown consequences in the long-term.8 10 Other lessunderstood factors, such as plastic abrasion during dishwashingand the ability of plastic fragments to enter sewage systemsduring rainfall events, could also contribute to the presence ofmicroplastics in water bodies.If microplastics are entering rivers through wastewatertreatment facilities, this may give rise to environmental andhealth concerns. Since plastics have been shown to harbordistinct microbial communities, there is a risk of introducingnew and potentially pathogenic taxa from wastewater environments to freshwater (and subsequently, marine) habitats.11 13In addition, the size and nature of these particles mean thatthey can enter food webs,14 20 particularly through filterfeeders, and microplastic fragments have already been observedin the gut cavities of species such as Mytilus edulis and Nephropsnorvegicus.21 23icroplastic pollution is a topic of increasing concern tosociety.1 The term “microplastics” was introducedapproximately a decade ago to describe small synthetic plasticparticles with an upper size limit of 5 mm.2 This size categoryalso includes microscopic fragments in the micrometer sizerange.2,3 A global survey of shorelines by Browne et al.4 foundmicroplastic particles within all sampled locations. Moreover,Moore et al.5 estimated that two Californian rivers couldtransport over 2 billion small ( 5 mm) plastic particles to theocean over a 3 day period. Nowadays, industrial and domesticproducts have become two of the most rapidly growing sourcesof microplastic particles entering aquatic environments. Theyinclude polymeric fibers released by washing of syntheticclothing (Browne et al.4 found that 1900 microplastic fibersare released in a single wash of a single synthetic garment) andalso hand, body, and facial cleansers.2,6,7 For example, themajority of facial cleansers list polyethylene as an ingredient,present in forms described as ‘‘microbeads”, ‘‘microbeadformula”, or ‘‘microexfoliates”.8 This increased use of domesticproducts containing microplastic particles is particularlyconcerning as such particles will be found in the environment 2015 American Chemical SocietyReceived: February 2, 2015Accepted: May 19, 2015Published: May 19, 20156032DOI: 10.1021/acs.analchem.5b00495Anal. Chem. 2015, 87, 6032 6040
ArticleAnalytical Chemistrymicroplastics have included, for example, sequential pyrolysisgas chromatography coupled to mass spectrometry (pyrolysisGC/MS),35 Raman spectroscopy23,36,37 and, most commonly,Fourier-transform infrared (FT-IR) spectroscopy.2,38 42 Incomparison with visual sorting using a microscope, FT-IRspectroscopy has been shown to detect a significantly highernumber of microplastics within environmental samples.43FT-IR spectroscopy is a desirable technique for theidentification of microplastics for several reasons, includingefficiency of cost, reliability, and ease of use. Additionally,infrared spectroscopy is nondestructive44 47 and the functionalgroups of different plastic types have already been established.48 54 Because of these attributes, FT-IR analyses havebeen successfully used for identifying microplastics in bothsediment and water samples.2,38 40,42FT-IR microspectroscopy (micro-FT-IR) is a tool thatcombines FT-IR spectroscopy with microscopy. By usingmicro-FT-IR, infrared bands can now be identified andcompared with increasingly smaller samples due to theimprovement in spatial resolution.55 Micro-FT-IR is particularlyuseful as it requires little sample preparation and can be used toidentify microplastics directly on membrane filters.41 Micro-FTIR analyses of plastics can be performed in either transmissionor reflectance mode. Transmission mode gives high qualityspectra but requires infrared-transparent substrates.56,57 Incontrast, analyses in reflectance mode enable the rapid analysisof thick and opaque samples and are therefore highly suitablefor detecting microplastics in environmental samples.56A previous study by Harrison et al.41 eliminated the need forvisual sorting of microplastics by introducing a chemicalmapping technique using reflectance micro-FT-IR spectroscopy. In this study, the measurements were performed manuallyor by semiautomatic molecular mapping of polyethylenefragments within sediment retentates. The manually collectedspectra were obtained from randomly selected locations on thesample surface, whereas 3 3 mm molecular micrographs wereobtained at intervals of 150 μm, using an aperture size of 15 15 μm. Unfortunately, with this point by point-based mappingapproach, scanning an entire membrane filter would take animplausible amount of time and the use of smaller apertureswould further increase the scanning time.Recent advances in micro-FT-IR detectors now allow for thesimultaneous acquisition of a higher number of spatiallyresolved spectra (n n pixels) where each pixel in the detectorarray provides an independent infrared spectrum. Thistechnique utilizes focal plane array (FPA) detectors and, bysimultaneously acquiring thousands of spectra within minutes,58,59 FPA detectors could provide information about theidentification of even smaller microplastic fragments on largersurface areas, without the need for the visual preselection ofparticles for analysis, at faster times, and without compromisingspatial resolution.In this study, we present a novel method for the analysis ofmicroplastics in wastewater samples using FPA-based reflectance micro-FT-IR imaging and H2O2 pretreatment. Weevaluate the effectiveness of a 30% H2O2 preparation step toremove the organic matter from wastewater, including theefficiency of this method at aiding sample filtration, and theeffects of H2O2 on the FT-IR spectra of 5 plastic typescommonly recorded in microplastic studies.30 In addition, wepresent, to our knowledge, the first application andexperimental validation of a FPA-based reflectance micro-FTIR protocol for the identification and quantification ofIn a review of freshwater microplastic studies by EerkesMedrano et al.,24 the authors highlighted key areas that requirefurther research, including the need for improved methodologies for detecting microplastics and identifying key microplastic transport pathways (which are likely to includewastewater).25 However, despite several recent studies focusingon the presence of microplastics within freshwater environments,4,5,12,26 28 there is an absence of research into thepresence of these contaminants in both municipal andindustrial wastewater. In addition, Wagner et al.29 gaveparticular emphasis to the importance of enhancing ourknowledge of microplastic pollution within freshwaterecosystems, including the role that these environments arelikely to play in microplastic transport.Despite the potential adverse impacts of microplastics onboth marine biota and human health, the methodology forisolating, detecting, identifying, and quantifying microplastics inenvironmental samples is still lacking in precision. Moreover,no standard operating protocol currently exists for detection ofthese rapidly emerging pollutants.30One of the fundamental challenges before the identificationof microplastics is their separation from the initial matrix. In areview by Hildalgo-Ruz et al.,30 in order to isolate microplasticsfrom sand-based samples, most previously published studiesrely on density separation using sodium chloride (NaCl),sodium iodide (NaI), or sodium polytungstate (SPT) solutions.However, plastics such as polyvinyl chloride (PVC) andpolyethylene terephthalate (PET) have a density greater thansaturated NaCl solution (the densities of PVC, PET, andsaturated NaCl solution are 1.14 1.56, 1.32 1.41, and 1.2 gcm 3, respectively). Moreover, denser salt solutions (such asNaI or SPT) are frequently considered too expensive to beused for the bulk separation of large sample volumes.31Alternative techniques such as elutriation31 33 have provensuccessful for isolating microplastics from marine sediments.However, for samples with a high concentration of organicmatter, such as wastewater, the technique is far less useful, asnaturally occurring particles within these matrices will exhibitdensities similar to those of microplastics. Therefore, analternate approach is needed to prepare these samples foranalysis.Cole et al.34 have presented different ways in which organicmatter in samples could be removed by acids, alkalis, andenzymatic digestion, with enzymatic digestion constituting themost suitable method for purifying plankton-based samples. Inaddition, Nuelle et al.33 recently investigated the practicality ofusing several solvent types to remove organic matter fromsamples without damaging the polymer fragments. In thisstudy, the treatment of sandy sediment retentates with 35% ofhydrogen peroxide (H2O2) for 7 days removed the majority ofbiogenic organic matter on a membrane filter, making thesamples easier to analyze by microscopy.Following separation of microplastics (and other particulatematter) from environmental samples, the majority of previouslypublished studies have relied on a visual sorting step to selectputative plastic particles for further analysis.30 This approach isopen to bias since, even when using a microscope, visuallydifferentiating between microplastics and other extractedorganic and inorganic matter of similar size is very difficult.In addition, this approach also requires a considerable amountof researcher time and effort. Spectroscopic approaches canprovide a more reliable tool for the identification of the plasticfragments. Techniques employed for the identification of6033DOI: 10.1021/acs.analchem.5b00495Anal. Chem. 2015, 87, 6032 6040
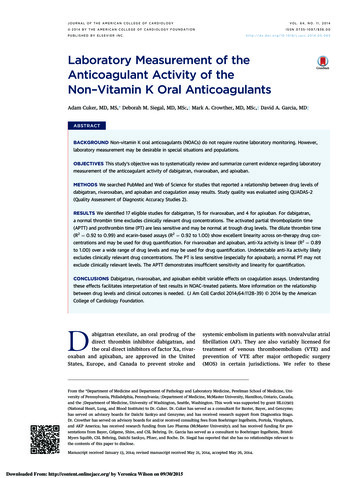
ArticleAnalytical Chemistrysimilarity matrix was constructed using normalized absorbancedata (4000 650 cm 1). A 2-way permutational multivariateanalysis of variance (PERMANOVA)61 was performed using“plastic type” and “time of exposure” (to H2O2) as the factors(Type III sums of squares, 9999 permutations of residualsunder a reduced model).Initial FPA-Based Micro-FT-IR Validation. Five differentmicroplastics (PE, PP, PVC, PS and nylon-6) were applied to asmall preselected area of microscope slide (10 fragments perplastic type). This area was then imaged using a PerkinElmerSpotlight micro-FT-IR spectroscope equipped with a mercury cadmium-telluride focal plane array (FPA) detector (consistingof 16 gold-wired infrared detector elements). An aperture sizeof 25 μm 25 μm was used, meaning that each pixel sampled a25 μm 25 μm area on the sample plane, with 2 coadded scansper pixel and a spectral resolution of 16 cm 1. No transformation or postprocessing of the spectra were carried out. Todistinguish microplastics from naturally occurring particles inthe false-color images, 3 characteristic regions of absorbancewere selected for each plastic type, with a positive identificationrequiring each of these bands to be present. A table showingthe characteristic FT-IR peaks for each plastic type is shown inTable S1 (Supporting Information).To validate the instrumental parameters established by thisinitial experiment, a second analysis was undertaken where thepositions of the microplastic particles were unknown. Falsecolor imaging was then performed using the same characteristicabsorbance ranges as previously determined.Analysis of Microplastics in Polymer-Spiked Wastewater. Ten particles of PE, PP, PS or PVC were added into a45-ml centrifuge tube (VWR, Leicestershire, England)containing wastewater from the activated biological stage oftreatment (see ‘Sampling’). The spiked wastewater sampleswere centrifuged at 2038g for 2 min and the effluent was storedfor filtration. The pellet was immersed in 15 mL of 30% H2O2for 7 days. The pellet and effluent were then filtered using aMillipore vacuum filtering assembly as described above. Thetubes used for storing the pellet and effluent were rinsed usingUHQ water to ensure no visible debris were left within thetubes. Membrane filters were fully air-dried after vacuumfiltration. Each membrane filter was visually imaged using thecamera attachment of the micro-FT-IR instrument. For reasonsof ease and speed (to avoid scanning redundant areas), eachfilter scan was split into 5 regions. Each region was imagedusing the same parameters (25-μm aperture size, resolution of16 cm 1 and 2 coadded scans). Once imaged, each region wasanalyzed for each plastic type and all regions were combined toconstruct a false-color image showing each plastic type presenton the filter surface. This entire validation study was repeated intriplicate. Negative controls were established using UHQ wateronly, and were then prepared identically to other sample types(involving storage, H2O2 treatment, filtration and micro-FT-IRanalysis). A control wastewater sample with no spikedmicroplastics was also included in this study.microplastics within complex and organic-rich wastewatersamples. EXPERIMENTAL SECTIONSampling. Wastewater was collected from the Severn TrentWater treatment facility in Derby, UK. Ten liters of samplewastewater was collected from the surface (top 5 cm) of theactivated aerobic biological stage using a telescopic samplingpole (Telescoop, Waterra Ltd., Solihull, UK). This sample wastransported back to the laboratory in a sterilized 10 L Nalgenecarboy LDPE container (Thermo Scientific, UK). In order tominimize any changes in the wastewater composition duringtransport and storage, the sample was kept aerobic bymaintaining a constant air flow. 25 mm syringe-type filterswith a 0.2 μm cellulose-acetate membrane (VWR, Leicestershire, England) were placed on the air-in and air-out lines toprevent any contamination from the air.H2O2 Pretreatment. To examine the effects of a H2O2pretreatment, 45 mL centrifuge tubes (VWR, UK) were filledwith wastewater and centrifuged at 2038g for 2 min. The pelletswere immersed in 15 mL of 30% H2O2 (Prolabo, BDH, UK),briefly shaken, and stored for 3, 5, or 7 days. Control samplesconsisting of wastewater pellets were immersed in 15 mL ofultra high quality (UHQ) water for 7 days. Each treated pelletwas vacuum-filtered using a Millipore vacuum filtering assembly(Millipore Corporation, Billerica, MA, USA), through 47 mmIsopore polycarbonate membrane filters with a pore size of 0.2μm at 40 kpa. The time required to filter each treated pelletwas recorded, the dry mass (ml 1) of the wastewater sampleswas measured before and after the treatment, and photographsof the membrane filters were obtained to assess the extent towhich H2O2 exposure removed organic matter from the samplesurfaces. These experiments were performed in triplicate.The exposure times and concentration of H2O2 employed inour study were based on previous research by Nuelle et al.33These authors demonstrated that using either 30% or 35%H2O2 successfully eliminated the majority of biogenic materialfrom membrane filter surfaces within 7 days of exposure.Effects of H2O2 on the FT-IR Spectrum of Microplastics. The plastic types employed in this study werepolyethylene (PE), polypropylene (PP), polyvinyl chloride(PVC), polystyrene (PS), nylon-6 (all Goodfellow CambridgeLtd., Huntingdon, England) and polyethylene terephthalate(PET) (Costcutter Montgomery Q4 Natural Water plasticbottle). With the exception of PET ( 1 mm), all microplasticswere 150 250 μm in size. A small amount ( 0.01 g) ofmicroplastics was applied to individual 2-ml sterile tubes(Fisher Scientific, Waltham, MA, USA) containing 1 mL of30% H2O2. These were briefly shaken and left for a period of 3,5, or 7 days, with a 7-day UHQ water control included. Theperoxide was subsequently removed using a Pasteur pipet whileretaining the microplastics. The plastics were manually rinsed in1 mL of 80% (v/v) ethanol.11 Once dry, the plastics wereanalyzed using a PerkinElmer FT-IR spectroscope equippedwith a Specac Golden Gate attenuated total reflectance (ATR)accessory, with 50 coadded scans carried out for eachexperimental replicate at a spectral resolution of 4 cm 1 anda wavenumber range of 4000 cm 1- 650 cm 1. This process wasrepeated in triplicate.In order to assess the potential for H2O2 exposure to affectthe FT-IR spectra of each plastic type, spectral data wereanalyzed using the statistical package PRIMER (v. 6.1.13) withthe PERMANOVA add-on (v. 1.0.3).60 62 A Euclidean RESULTS AND DISCUSSIONH2O2 Pretreatment. In this study, the main rationale forapplying a H2O2 pretreatment step was to facilitate filtrationand to improve the micro-FT-IR imaging of microplasticswithin wastewater samples by removing organic matter thatwould otherwise accumulate on the membrane filter surface.As mentioned by Hidalgo-Ruz et al.,30 the majority ofprevious research into the extraction of microplastics from6034DOI: 10.1021/acs.analchem.5b00495Anal. Chem. 2015, 87, 6032 6040
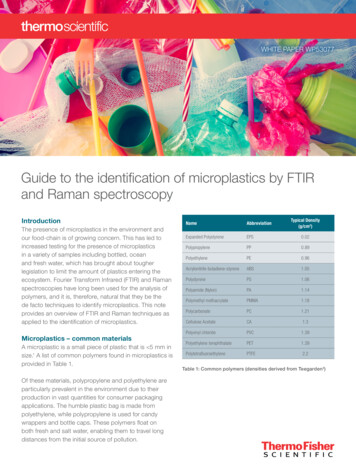
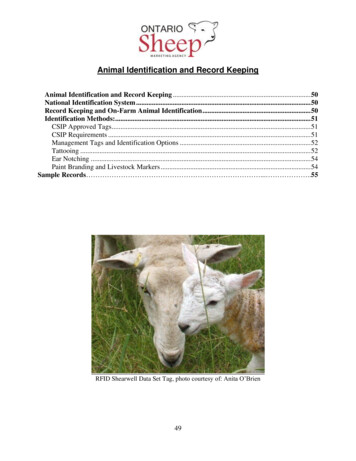
ArticleAnalytical ChemistryFigure 1. ATR-FT-IR spectra of polyethylene terephthalate (left) and polyethylene (right) subjected to H2O2 for a range of time points up to 7 days.A: 7 days; B: 5 days; C: 3 days; D: control.Figure 2. False color images of microplastics in known positions on a glass slide achieved using a PerkinElmer micro-FT-IR spectroscope with aFPA-based detector. Each map displays a particular polymer type; A: Visible image; B: PP; C: PVC; D: Nylon; E: PS; F: PE.7-day exposure assay to determine the impacts of H2O2exposure on the FT-IR spectra of 5 different plastic types.The efficiency of filtration was dramatically improved withuse of a 30% H 2 O 2 pretreatment step. Without H 2 O 2pretreatment, filtration of the centrifuged wastewater pellet(originating from a total volume of 45 mL) required a meanduration of 88.87 s (n 3) at 40 kpa. After 3, 5, and 7 days ofH2O2 pretreatment, the mean durations required for filtrationwere 28.38, 22.64, and 18.16 s, respectively (n 3). Overall, themean reductions in the time required for filtration (comparedwith control samples) were 60.49 s after 3 days, 66.23 s after 5days, and 70.71 s after 7 days of pretreatment. These reductionsin filtration time were additionally accompanied by visualevidence for a reduction in the amount of biogenic matter onenvironmental samples has been concerned with sandysediments. These types of samples propose relatively fewchallenges to the successful isolation of microplastics, sincesands have a greater density than any plastic type.30 However,Nuelle et al.33 found membrane filters to retain a considerableamount of biogenic organic matter following the elutriation andfiltration of microplastics from marine sediments, with a H2O2digestion step employed as a solution to this issue. While theauthors observed that the majority of the plastic particlesremained unchanged in size (apart from a slight change in thesize of polyethylene and polypropylene) following peroxidetreatment,33 the ability of H2O2 to affect the infrared spectra ofmicroplastics was not characterized. Therefore, our study used a6035DOI: 10.1021/acs.analchem.5b00495Anal. Chem. 2015, 87, 6032 6040
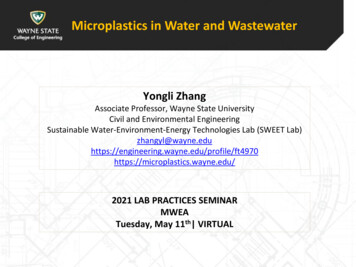
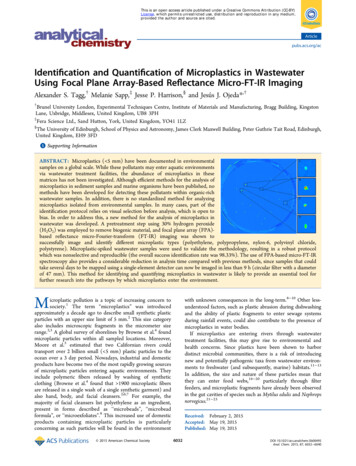
ArticleAnalytical ChemistryFigure 3. False color images of entire membrane filters achieved using micro-FT-IR imaging with a FPA-based detector. Each map displays aparticular polymer type; A: PE; B: PP; C: PS; D: PVC. Correctly identified spiked microplastics are denoted with a number 1 10 (except in PVCwhere only 1 9 could be identified). Additional microplastics present in the wastewater confirmed as the correct polymer type are denoted by “!”.the filter surface (See Figure S1 in the Supporting Information).Dry organic matter content (100 mL 1) was reduced from0.0528 g (control) to 0.0147 g after 3 days, 0.0125 g after 5days, and 0.0090 g after 7 days of exposure to H2O2 (equivalentto a 83% overall reduction in organic matter content). Takencollectively, these results demonstrate that a H2O2 pretreatmentstep of approximately 7 days is optimal for the filtration ofmicroplastics within wastewater samples. These data are ingeneral agreement with those of Nuelle et al.,33 who found thata 7 day postfiltration treatment using a 35% H2O2 solution wassuitable for preparing microplastic samples isolated fromsediments that primarily consisted of silicate. However,postfiltration treatments are inappropriate for the preparationof plastic samples originating from organic-rich wastewater, dueto the rapid buildup of biogenic matter on the membrane filtersduring filtration.In addition to the improvement in filtration time, it is alsoimportant that the FT-IR spectra of microplastics areunchanged as a consequence of the H2O2 pretreatment step.It was found that up to 7 day exposures to 30% H2O2 had nosignificant impact on the FT-IR spectra of the polymer typesemployed in our study (2-way PERMANOVA: pseudo-F6,56 0.715, P 0.658, 9935 unique permutations). This findingdemonstrates that H2O2 pretreatment can be used to purifymicroplastic samples without resulting in substantial alterationsto polymer chemistry, enabling the reliable identification (andquantification) of these contaminants within environmentalsamples. Representative spectra of two types of microplasticsover the course of 7 days of H2O2 treatment are shown inFigure 1. This supports our finding that the IR absorbancepeaks of microplastics (including key bands selected forpolymer identification; see Table S1, Supporting Information)are unchanged by up to 7 days of exposure to H2O2, with littleto no alterations in peak positions or intensities across theentire examined wavenumber range (4000 650 cm 1).Recent work has investigated the possibility of usingenzymatic digestion, and this may offer an improvement tothe use of H2O2, since Cole et al.34 found enzymatic digestionto remove 97% of organic matter in a plankton-rich sample.However, before such a digestion step could be combined withthe method presented in this study, it would be necessary totest the effects of enzymatic treatment on the IR spectra ofmicroplastics. The duration required for sample filtration couldalso be reduced by microwave digestion.63 However, carewould need to be taken to avoid melting or degrading theplastics, and any changes to spectral properties would also needto be investigated.Initial FPA-Based Micro-FT-IR Validation. Figure 2shows micro-FT-IR chemical images of the 5 microplastictypes (PVC, PA, PS, PP, and PE) in known positions. All 50microplastic particles were successfully identified, with thewavenumber regions used for identification (Table S1,Supporting Information) providing reliable results for allpolymer types. The absorbance scale on the right approximatelyindicates the abundance of molecules absorbing the infraredradiation on a specific area. In cases where microplastic particlesare discernible from the background in more than one image,the particle was identified as whichever polymer type thatexhibited a greater relative absorbance signal. For example, inFigure 2B, in a map of PP, PVC is also registering a faint signal.However, the comparable signal in Figure 2C (the PVC map) ismore intense for these same microplastics, and as such, theseparticles were identified as PVC despite their faint appearancein the PP map.6036DOI: 10.1021/acs.analchem.5b00495Anal. Chem. 2015, 87, 6032 6040
ArticleAnalytical ChemistryFigure 4. Combined and overlapped false-color images showing 4 different microplastic types. Four fragments of each polymer type have beenselected and magnified (above). FT-IR spectra of selected and magnified microplastic fragments; these spectra are typical of plastic fragmentsmapped using these parameters (below). A: PVC; B: PS; C: PP; D: PE.In order to validate the instrumental parameters establishedabove, a second analysis was undertaken in which themicroplastic particles were unknown. All 50 microplasticparticles were again successfully identified, showing that it isstill possible to map these 5 types of microplastics with 100%accuracy. The false-color image showing the same 50microplastics present in Figure 2, but in unknown locations,is presented in the Supporting Information (Figure S2).It is important to highlight that the microplastics used in thisstudy were of a roughly spherical shape. Irregularly shapedfragments observed in the false-color images could have arisendue to the amalgamation of several particles. Indeed,accounting for this possibility is important for the successfulquantification of microplastic fragments. Therefore, when ahigh degree of accuracy is required, visual (microscopic)investigation of the detected fragments may occasionally benecessary.6037DOI: 10.1021/acs.analchem.5b00495Anal. Chem. 2015, 87, 6032 6040
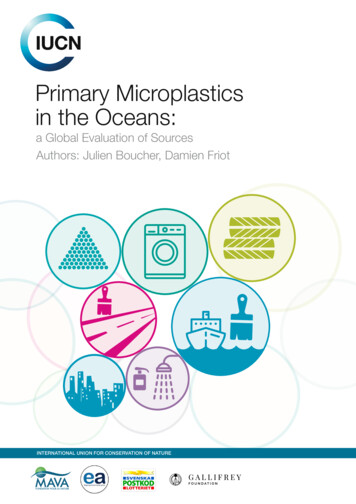
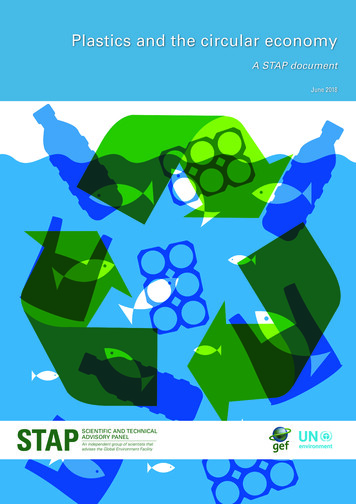
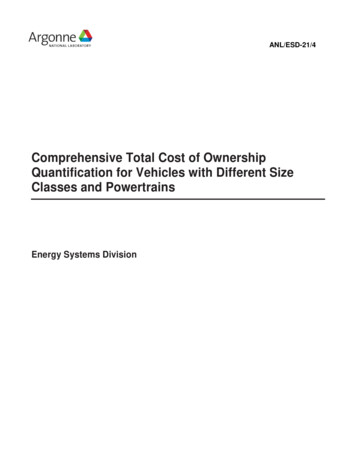
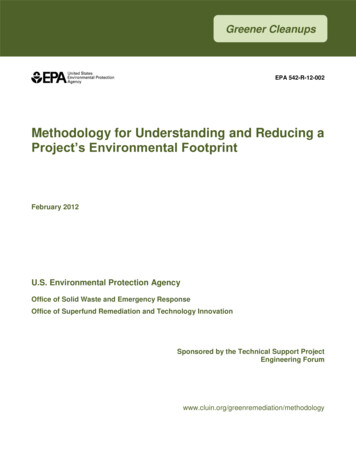
ArticleAnalytical ChemistryAnalysis of Microplastics in Polymer-Spiked Wastewater. Figure 3 shows the false color images of individualmicroplastic types on an entire 47 mm membrane filter. Scansof these filters can be completed in under 9 h with one scan perpixel and in under 16 h with 2 scans per pixel. While nylon-6was initially included in the spiked samples, recognizablespectra of this plastic type were unattainable using reflectancemicro-FT-IR spectroscopy, and identifying these particlesagainst a complex organic background was impossible (due toeither impurities on the plastic surface or because microscopicanalysis of these specific microspheres revealed a roughtopography, that could have affected the analysis by scatteringthe reflected infrared light).41 Analyses in transmission mode64or ATR spectroscopy39 could facilitate the identification ofthese types of microplastics by enabling the detection ofabsorbance bands that cannot be discerned by reflectance FTIR microspectroscopy.Figure 4 shows all of the imaged plastic types combined intoa single image, with representative FT-IR spectra collected fromindividual microplastic fragments. Taken collectively, Figures 3and 4 demonstrate that combining a H2O2 pretreatment stepwith FPA-based reflectance micro-FT-IR imaging is highlysuitable for the detection of PVC, PS, PP, and PE microplasticswithin organic-rich wastewater samples.On occasion, the mixture of biogenic matter (with a smallamount of nonorganic debris) on the polycarbonate membranefilter gave rise to background spectra that exhibited a limiteddegree of overlap with some of the IR spectral peaks used forthe identification of microplastics (Table S1, SupportingInformation). However, as the identification of each polymerrelied on the presence of three characteristic peaks, themicroplastics tested could be successfully identified. Inwastewater samples, it is expected that some compounds canbe adsorbed to or associated with the plastic particles (and/orplastic-associated biofilms), but as long as the H2O2 pretreatment is able to remove most of the biogenic matter andprovided that characteristic peaks for each polymer (as shownin Table S1, Supporting Information) are present in the spectra,the fragments should be correctly identified.Despite the ability of the present method to detectmicroplastics in wastewater, there were some unexpectedresults in the full filter scans. For example, filter scansconsistently identified more than the total of 10 PE particleswhich were added to the wastewater samples (Figure 3).Fragmentation of the spiked particles seemed unlikely becauseNuelle et al.33 did not report any fragmentation of PE particlestreated with 35% H2O2 for up to 7 days. Moreover, a singlefragment with a spectrum consistent with polyethylene wasidentified in a wastewater sample with no spiked microplastics,
organic and inorganic matter of similar size is very difficult. In addition, this approach also requires a considerable amount of researcher time and effort. Spectroscopic approaches can provide a more reliable tool for the identification of the plastic fragments. Techniques employed for the identification of