Transcription
Primary Microplasticsin the Oceans:a Global Evaluation of SourcesAuthors: Julien Boucher, Damien FriotINTERNATIONAL UNION FOR CONSERVATION OF NATURE
Primary Microplasticsin the Oceans:a Global Evaluation of SourcesAuthors: Julien Boucher, Damien Friot
The designation of geographical entities in this book, and the presentation of the material, do not implythe expression of any opinion whatsoever on the part of IUCN concerning the legal status of any country,territory, or area, or of its authorities, or concerning the delimitation of its frontiers or boundaries.The views expressed in this publication do not necessarily reflect those of IUCN.Published by:IUCN, Gland, SwitzerlandCopyright: 2017 International Union for Conservation of Nature and Natural ResourcesReproduction of this publication for educational or other non-commercial purposes isauthorised without prior written permission from the copyright holder provided thesource is fully acknowledged.Reproduction of this publication for resale or other commercial purposes is prohibitedwithout prior written permission of the copyright holder.Citation:Boucher, J. and Friot D. (2017). Primary Microplastics in the Oceans: A GlobalEvaluation of Sources. Gland, Switzerland: IUCN. IUCN.CH.2017.01.enAuthors:Julien BoucherEA – Shaping Environmental Action & University of Applied Sciences and ArtsWestern Switzerland // HES-SO, HEIG-VD, Yverdon-les-Bains, SwitzerlandDamien FriotEA – Shaping Environmental or:Carl Gustaf Lundin and João Matos de SousaExternal reviewers:Francis Vorhies (Earthmind, http://earthmind.org)François Galgani (IFREMER, Laboratoire LER/PAC)Mathieu Pernice (University of Technology, Sydney)Doug Woodring (www.oceanrecov.org)Designed by:Imre Sebestyén jr. (Unit Graphics Studio)Figures: IUCNAvailable from:www.iucn.org/resources/publications
P R I M A R Y M I C R O P L A S T I C S I N T H E O C E A N S : A G L O B A L E VA L U AT I O N O F S O U R C E STABLE OF CONTENTSForeword . . . . . . . . . . . . . . . . . . . . . . . . . . . . . . . . . . . . . . . . . . . . . . . . . . . . . . . . . . . . . . . . . . . . . . . . . . . . . . . 41. Abstract. . . . . . . . . . . . . . . . . . . . . . . . . . . . . . . . . . . . . . . . . . . . . . . . . . . . . . . . . . . . . . . . . . . . . . . . . . . . . . 52. Introduction. . . . . . . . . . . . . . . . . . . . . . . . . . . . . . . . . . . . . . . . . . . . . . . . . . . . . . . . . . . . . . . . . . . . . . . . . . 72.1 Plastics & microplastics contaminate the world ocean. . . . . . . . . . . . . . . . . . . . . . . . . . . . . . . . . . . 82.2 Knowledge gaps about microplastics releases . . . . . . . . . . . . . . . . . . . . . . . . . . . . . . . . . . . . . . . . . 82.3 Rapidly increasing use of plastics. . . . . . . . . . . . . . . . . . . . . . . . . . . . . . . . . . . . . . . . . . . . . . . . . . . . . 92.4 Objective of this report. . . . . . . . . . . . . . . . . . . . . . . . . . . . . . . . . . . . . . . . . . . . . . . . . . . . . . . . . . . . .103. Description of issues & methodology. . . . . . . . . . . . . . . . . . . . . . . . . . . . . . . . . . . . . . . . . . . . . . . . . . . 113.1 Literature review of key sources. . . . . . . . . . . . . . . . . . . . . . . . . . . . . . . . . . . . . . . . . . . . . . . . . . . . . . 123.2 A lifecycle perspective of losses. . . . . . . . . . . . . . . . . . . . . . . . . . . . . . . . . . . . . . . . . . . . . . . . . . . . . . 133.3 Description of seven key sources. . . . . . . . . . . . . . . . . . . . . . . . . . . . . . . . . . . . . . . . . . . . . . . . . . . . .143.4 Modelling activities, losses & releases. . . . . . . . . . . . . . . . . . . . . . . . . . . . . . . . . . . . . . . . . . . . . . . . . 173.5 Three scenarios for presenting the results. . . . . . . . . . . . . . . . . . . . . . . . . . . . . . . . . . . . . . . . . . . . .184. Results & Analysis. . . . . . . . . . . . . . . . . . . . . . . . . . . . . . . . . . . . . . . . . . . . . . . . . . . . . . . . . . . . . . . . . . . . .194.1 Primary microplastics are a significant source of plastic in the oceans. . . . . . . . . . . . . . . . . . . . 204.2 Two-thirds of the releases are from the erosion of synthetic textiles & tyres. . . . . . . . . . . . . . . 214.3 Household activities generate almost three quarters of the releases duringthe use phase and maintenance of plastic products . . . . . . . . . . . . . . . . . . . . . . . . . . . . . . . . . . . 234.4 Two-thirds of the losses are through road runoffs. . . . . . . . . . . . . . . . . . . . . . . . . . . . . . . . . . . . . 244.5 All regions contribute significantly to releases . . . . . . . . . . . . . . . . . . . . . . . . . . . . . . . . . . . . . . . . 254.6 Releases average one plastic bag per person per week. . . . . . . . . . . . . . . . . . . . . . . . . . . . . . . . 264.7 Key sources of releases differ among regions. . . . . . . . . . . . . . . . . . . . . . . . . . . . . . . . . . . . . . . . . 274.8 Microplastic releases are high in Europe & North America. . . . . . . . . . . . . . . . . . . . . . . . . . . . . . 284.9 Closing the plastic tap requires different sets of solutions. . . . . . . . . . . . . . . . . . . . . . . . . . . . . . 295. Conclusion. . . . . . . . . . . . . . . . . . . . . . . . . . . . . . . . . . . . . . . . . . . . . . . . . . . . . . . . . . . . . . . . . . . . . . . . . . . 305.1 Take home messages. . . . . . . . . . . . . . . . . . . . . . . . . . . . . . . . . . . . . . . . . . . . . . . . . . . . . . . . . . . . . . . . 315.2 Shaping action to close the plastic tap. . . . . . . . . . . . . . . . . . . . . . . . . . . . . . . . . . . . . . . . . . . . . . . . 315.3 Next steps. . . . . . . . . . . . . . . . . . . . . . . . . . . . . . . . . . . . . . . . . . . . . . . . . . . . . . . . . . . . . . . . . . . . . . . . 326. Appendix 1: Sources. . . . . . . . . . . . . . . . . . . . . . . . . . . . . . . . . . . . . . . . . . . . . . . . . . . . . . . . . . . . . . . . . .6.1 Synthetic textiles: abrasion during laundry. . . . . . . . . . . . . . . . . . . . . . . . . . . . . . . . . . . . . . . . . . . .6.2 Tyres: abrasion while driving. . . . . . . . . . . . . . . . . . . . . . . . . . . . . . . . . . . . . . . . . . . . . . . . . . . . . . . .6.3 City dust: spills, weathering & abrasion. . . . . . . . . . . . . . . . . . . . . . . . . . . . . . . . . . . . . . . . . . . . . . .6.4 Road markings: weathering and abrasion by vehicles. . . . . . . . . . . . . . . . . . . . . . . . . . . . . . . . . .6.5 Marine coatings: weathering, application & maintenance. . . . . . . . . . . . . . . . . . . . . . . . . . . . . . .6.6 Personal care products: loss during use. . . . . . . . . . . . . . . . . . . . . . . . . . . . . . . . . . . . . . . . . . . . . .6.7 Plastic Pellets: manufacturing, transport & recycling. . . . . . . . . . . . . . . . . . . . . . . . . . . . . . . . . . .33343435363637377. Appendix 2: Pathways. . . . . . . . . . . . . . . . . . . . . . . . . . . . . . . . . . . . . . . . . . . . . . . . . . . . . . . . . . . . . . . .7.1 Road runoff pathway . . . . . . . . . . . . . . . . . . . . . . . . . . . . . . . . . . . . . . . . . . . . . . . . . . . . . . . . . . . . . . .7.2 Wastewater Pathway. . . . . . . . . . . . . . . . . . . . . . . . . . . . . . . . . . . . . . . . . . . . . . . . . . . . . . . . . . . . . . .7.3 Wind pathway. . . . . . . . . . . . . . . . . . . . . . . . . . . . . . . . . . . . . . . . . . . . . . . . . . . . . . . . . . . . . . . . . . . . .7.4 Ocean Pathway. . . . . . . . . . . . . . . . . . . . . . . . . . . . . . . . . . . . . . . . . . . . . . . . . . . . . . . . . . . . . . . . . . .38393939398. Appendix 3: Regions. . . . . . . . . . . . . . . . . . . . . . . . . . . . . . . . . . . . . . . . . . . . . . . . . . . . . . . . . . . . . . . . . . 409. Bibliography. . . . . . . . . . . . . . . . . . . . . . . . . . . . . . . . . . . . . . . . . . . . . . . . . . . . . . . . . . . . . . . . . . . . . . . . . 423
P R I M A R Y M I C R O P L A S T I C S I N T H E O C E A N S : A G L O B A L E VA L U AT I O N O F S O U R C E SFOREWORDThe invention of plastic based on a syntheticpolymer in 1907 changed our lives forever –for better and for worse. Plastic is one of themost versatile materials ever produced and hasrevolutionised the way we package, eat, traveland dress.Although mismanaged plastic waste is still themain source of marine plastic pollution globally,this report shows for the first time that, in somecountries, more plastic may be released fromour driving and washing activities than from themismanagement of our waste.The plastic revolution has however come at acost. Plastic pollution in our marine environmentis taking place on a staggering scale with 9.5million tonnes of new plastic waste flowinginto the ocean each year. This is impacting ourplanet’s precious biodiversity and damaging thefragile ecosystems upon which we all depend.The widespread contamination of our oceans isalso fast becoming a worldwide human healthrisk as plastic enters our food and water supplies.Tackling the multitude of sources of marineplastics requires a holistic approach thataddresses the problem at its source. The findingsin this report must drive new thinking aroundthe way we design, produce, consume anddispose of plastics. Action to turn off the plastictap could come in the form of new engineeredmaterials and smart design, such as clothes thatshed fewer fibres or washing machines equippedwith filters. These efforts must be supported bylegislation and on-the-ground policies that forcereal change.Despite a growing body of work on plastic debrisand a heightened global awareness of its globalimpact, remedial efforts to combat this pollutionhave been hamstrung by a lack of research andknowledge surrounding the original sources ofthe waste matter.This report also reminds us that, as consumersof plastic, we have a responsibility to educateourselves and adapt our behaviour in order toprotect our blue planet.Primary Microplastics in the Oceans : a GlobalEvaluation of Sources helps fill this knowledgegap and provides an important reference pointfor decision makers as they design and implementthe transformative policies and productionpractices we need to transition towards a circularglobal economy.We have a major challenge ahead. But with acollaborative global effort, we can reverse thegrim forecasts for plastic pollution, and return toa world with healthy oceans.Following in the footsteps of the IUCN “Closethe plastic tap” project and the “Plastic debrisin the ocean” publication, this report provides aglobal estimate and mapping of the sources andquantities of primary microplastics – plastics thatenter the oceans in the form of small particlesreleased from household and industrial products.Inger Andersen,IUCN Director GeneralThis report owes its existence to the outstanding support from MAVA Fondation pour la Nature. TheSwedish Postcode Foundation and the Gallifrey Foundation are also acknowledged for supportingthe launch of this report.4
P R I M A R Y M I C R O P L A S T I C S I N T H E O C E A N S : A G L O B A L E VA L U AT I O N O F S O U R C E S1. AbstractPlastic has penetrated everyday life: from clothing to coatings and from transport vehicles tocleaning products. Plastic is cheap, durable, lightweight and malleable, resulting in a practicallyunlimited number of possible applications. The disadvantages of plastics however are becomingmore and more visible. Large quantities of plastics leak into rivers and oceans, with adverse effectsto marine ecosystems and related economic activities.Plastic wastes include all size residues, from large visible and easily removable items, to smallinvisible particles. This report investigates the sources of primary microplastics i.e. microplasticsthat are directly released into the environment as small plastic particles ( 5 mm size). This contrastswith secondary microplastics that originate mostly from the degradation of large plastic waste intosmaller plastic fragments once exposed to the marine environment. Primary microplastics can bea voluntary addition to products such as scrubbing agents in personal care products (shower gels,creams, etc.). They can also originate from the abrasion of large plastic objects during manufacturinguse or maintenance such as the erosion of tyres when driving or the abrasion of synthetic textilesduring washing.This report is one of the first of its kind to quantify primary microplastics leakage and to demonstratethat these primary microplastics are globally responsible for a major source of plastics in the oceans.The model developed for this analysis enables us to conclude that between 15 and 31% of all ofthe plastic in the oceans could originate from primary sources. This is a significant but as-of-yetunrecognised proportion. In some countries benefitting from advanced waste treatment facilities,primary microplastics releases even outweigh that of secondary microplastics.The global release of primary microplastics into the ocean was estimated at 1.5 million tons per year(Mtons/year). The estimate ranges between 0.8 and 2.5 Mtons/year according to an optimistic orpessimistic scenario. The global figure corresponds to a world equivalent per capita release of 212grams or the equivalent of one empty conventional plastic grocery bag thrown into the ocean perperson/per week worldwide.The overwhelming majority of the losses of primary microplastics (98%) are generated from landbased activities. Only 2% is generated from activities at sea. The largest proportion of these particlesstem from the laundering of synthetic textiles and from the abrasion of tyres while driving. Mostof the releases to the oceans are occurring from the use of products (49%) or the maintenance ofproducts (28%). The main pathways of these plastics into the ocean are through road runoff (66%),wastewater treatment systems (25%) and wind transfer (7%).The study reviewed seven regions – Africa and Middle East, China, East Asia and Oceania, Europeand Central Asia, India and South Asia, North America, and South America. It revealed comparablereleases per region in absolute value – ranging from 134 to 281 Ktons/year. The per capita releases,however, are very different between regions – ranging from 110 to 750 grams/person/year.Further, most regions are expected to have increased releases of primary microplastics in thenext decades. This is due to improvements in per capita income without improvements in systemsto prevent the releases.5
P R I M A R Y M I C R O P L A S T I C S I N T H E O C E A N S : A G L O B A L E VA L U AT I O N O F S O U R C E SImportantly this report is based on modelling sources and leakages from economic and householdactivities, using exclusively publicly available data and not on field measurements. The model couldbe further improved by using available fee-based proprietary data on regional plastic quantities. Itcould also be further strengthened by improving underlying regional assumptions on behaviours.Furthermore, confrontation of our predictive model with empirical data from the field would bebeneficial in order to validate the model. This is however not feasible yet, given the status of literatureand lack of adequate experimental set-up to perform this comparison. Nevertheless, the range ofpessimistic/optimistic scenarios considered throughout our study allows for sufficient confidencein the orders of magnitude we put forward.This report stresses the contribution of primary microplastics to the plastic pollution of oceanson a global scale. It opens the way to a new stream of actions to tackle the issue of plastics in theocean beyond the traditional focus on waste management. Shaping these solutions will requireapproaches based on product eco-design and lifecycle thinking, as well as the involvement of keystakeholders from the private (e.g. textile and automotive industry) and public (water treatmentand urban infrastructure planning) sectors.6
P R I M A R Y M I C R O P L A S T I C S I N T H E O C E A N S : A G L O B A L E VA L U AT I O N O F S O U R C E S2.IntroductionNowadays plastics have penetrated all aspect ofeveryday life from clothing to coatings and fromtransport vehicles to cleaning products. Plasticis a cheap, durable, lightweight, malleablematerial. It has a practically unlimited numberof possible applications.entering the ocean. However behind theheadlines primary microplastics are becominganother major source of concern. Their releaseis much less visible, resulting from the voluntaryaddition of microbeads in products such ascosmetics or from the abrasion of larger plasticitems such as textiles or tyres.The disadvantages of plastics however arebecoming more and more visible. Largequantities of plastics are released into riversand oceans with various adverse effects toecosystems and related economic activities.The purpose of this report is to provide oneof the first global estimate and mapping ofsources and quantities of primary microplasticsreleased into the world ocean. It aims toprovide new information to decision-makersand stakeholders to help them shape actions toclose the plastic tap.Littering and mismanaged wastes are oftenreferred to as the main source of plastics7
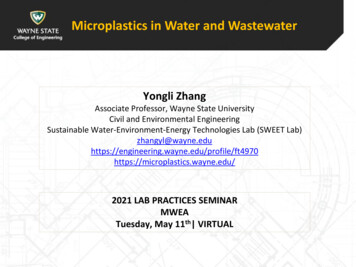
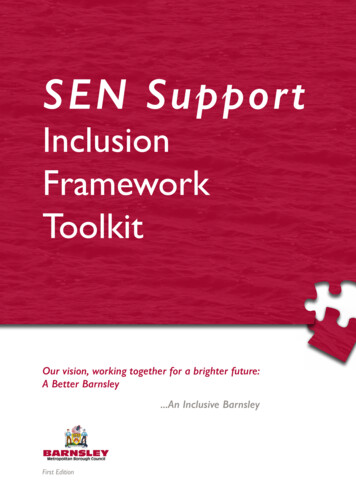
P R I M A R Y M I C R O P L A S T I C S I N T H E O C E A N S : A G L O B A L E VA L U AT I O N O F S O U R C E S2.1 Plastics & microplastics contaminate the world oceanMarine environments all over the world are contaminated with plastics (GESAMP, 2015). Plastics canbe encountered in two forms: large plastic wastes, and small plastic particulates below 5 mm in sizenamed microplastics (Thevenon et al., 2014).Recent studies place the total amount of plastic produced since its invention at 8.3 billion tons(Geyer et al., 2017). Of this, an estimated 9% has been recycled (Geyer et al., 2017). Between 4.8 to12.7 million metric tons of plastic waste are estimated to enter the ocean each year (Jambeck et al.,2015). Given these recent estimations and attempts to accurately quantify the problem, it is vital tounderstand the relationship between macro and microplastics when citing these numbers.The estimate of between 4.8 to 12.7 million MT of plastic entering the ocean each year is an estimationof macroplastics (Jambeck et al., 2015). This is based on the mass of waste generated per capitaannually, the percentage of plastic waste within that, and finally, the percentage of mismanagedplastic waste that has the potential to enter the ocean as plastic pollution. Therefore, the figuresdiscussed in this report about primary microplastics are in addition to the estimations made in theJambeck report, putting the overall quantity of both micro and macroplastics in the ocean at higherthan the average and commonly-quoted value of 8 million metric tons.Large plastic waste is readily visible. Studies have demonstrated negative social, economic andecological impacts. These range from the ingestion, injury, entanglement or suffocation of wildlifeto economic drawbacks for tourist areas and maritime industries (GESAMP, 2015; Raynaud, 2014).For a review of the many potential negative impacts of plastics on ecosystems, see Thevenon et al.(2014).Microplastics are not easily visible to the human eye. While potential negative impacts are lessobvious, their release into the oceans may also have far reaching consequences. Human healthconcerns are suspected through the accumulation of microplastics in the food chain and/or sorptionof toxicants to plastic while traveling through the environment (Eriksen et al., 2014).Two types of microplastics are contaminating the world ocean: primary and secondary microplastics.Different definitions have been used in the literature (Lassen et al., 2015) and we adopted thefollowing as proposed by a Norwegian study (Sundt et al., 2014): Primary microplastics are plastics directly released into the environment in the form of smallparticulates. They can be a voluntary addition to products such as scrubbing agents in toiletriesand cosmetics (e.g. shower gels). They can also originate from the abrasion of large plasticobjects during manufacturing, use or maintenance such as the erosion of tyres when driving orof the abrasion of synthetic textiles during washing. Secondary microplastics are microplastics originating from the degradation of larger plasticitems into smaller plastic fragments once exposed to marine environment. This happensthrough photodegradation and other weathering processes of mismanaged waste such asdiscarded plastic bags or from unintentional losses such as fishing nets. Given that the origins ofsecondary microplastics are difficult to trace given their degradation, it is difficult to meaningfullyassess how much of the figures of macroplastics have now converted to microplastics. It is forthis reason that the report seeks to focus on quantification of primary microplastics, as it isachievable within current data sets.Once in the oceans, microplastics can either float or sink. Microplastics lighter than seawater suchas polypropylene will float and disperse widely across the oceans. They eventually accumulate ingyres resulting from oceanic currents. Eriksen et al. (2014) and Sebille et al. (2015) estimate that 93to 268 ktons of these microplastics are currently floating in the oceans. Other microplastics such asacrylic are denser than seawater and most probably accumulate on the ocean floor, which meansthat a significant amount of microplastics may eventually accumulate in the deep sea (Woodall etal., 2014) and ultimately in food chains (Seltenrich, 2015).8
P R I M A R Y M I C R O P L A S T I C S I N T H E O C E A N S : A G L O B A L E VA L U AT I O N O F S O U R C E SThis ubiquitous contamination of oceans by microplastics is becoming a major concern. Given themagnitude and uniqueness of this global ocean contamination, some refer to the current period asthe plasticene (Reed, 2016) and describe the world’s ocean as a plastic OBAL RELEASES OF PRIMARYMICROPLASTICS TO THE WORLD OCEANSBY SOURCE (IN %).1.5MT/yr7%3.7%2%0.3%24%35%28%2.2 Knowledge gaps about microplastics releasesThere is a common belief that most of the plastics contaminating the world’s ocean originate frommismanaged plastic wastes. Most recent reports on microplastics focus almost exclusively on thequantification of these secondary sources and on waste reduction and management (EUNOMIA,2016a; Jambeck et al., 2015; McKinsey & Company and Ocean Conservancy, 2015; World EconomicForum et al., 2016). Jambeck (2015) reported that between 4.8 and 12.7 Mtons of plastic are releasedglobally into the oceans every year because of mismanaged waste.Knowledge about the global releases of primary microplastics into the world ocean is howevergenerally lacking. While many sources of primary microplastics have been identified in theliterature, the global quantities released yearly have not yet been assessed. Consequently, therelative importance of primary versus secondary sources of microplastics is still unknown, and theplastic debate generally does not look outside of the waste management arena.1See: http://www.plasticsoupfoundation.org9
P R I M A R Y M I C R O P L A S T I C S I N T H E O C E A N S : A G L O B A L E VA L U AT I O N O F S O U R C E SThe discovery of high levels of microplastic in the lakes and rivers in Europe, North-America and Asia(Eerkes-Medrano et al., 2015) might indicate that primary sources represent a significant release ofmicroplastics into the oceans. One study showed that plastic abundance in the Austrian Danubewas even higher than that of drifting larval fish, mostly in the form of industrial raw materials sucha pellets and flakes (Lechner et al., 2014). Two other studies found that much of the plastic found insurface water originates from cosmetic products such as facial cleaners or from textiles (Browne etal., 2011; Driedger et al., 2015). In the recent assessments performed at country scale in Europe, Esselet al. (2015), Lassen et al. (2015), Magnuson et al. (2016), RIVM (2014), Sundt et al. (2014) identifiedand quantified around fifteen sources of primary microplastics. Tyres are often cited as the maincontributor to the releases.2.3 Rapidly increasing use of plasticsToday plastic is a common material that can be found in almost all parts of everyday life. Thisincludes packaging, buildings and construction, vehicles, electrical and electronic equipment,agriculture production, clothes and footwear, householder and personal cleaning products. Apractically unlimited number of applications are possible thanks to its unrivalled properties ofdurability, malleability, lightweight and low cost.Plastic use has increased exponentially since synthetic organic polymers were developed in themid-20th century. Over 300 million tons of plastic are currently produced yearly to manufactureobjects in plastic. This quantity contrasts with only 1.5 million tons produced in 1950. The long-termaverage annual growth rate has been roughly 4% (PlasticsEurope, 2015). We can then add theplastics for other uses that are not accounted in these statistics2 such as synthetic fibres for textiles(37.2 million tons) or synthetic rubber for tyres (6.4 million tons) 3. Also, according to PlasticsEurope(2015), plastic production requires around 4% of the world’s annual petroleum production while asimilar amount of petroleum is used to provide the energy for plastic manufacturing.Plastic use varies widely across regions. In North America and Western Europe, for example, theaverage plastic consumption per capita for plastics objects reached approximately 100 kg peryear in 2005 and was expected to increase to 140 kg by 2015. In Asian countries, the individualconsumption for plastics objects is much lower. It was about 20 kg per year per person in 2005with an estimated increase to 36 kg by 2015. It is even lower in Africa with an estimation of 16 kilosper capita by 2015 (PlasticsEurope, 2009).Due to the excellent functional properties of this material, it seems clear that plastic use willincrease in the future, particularly in lower income regions as their economies grow. Solutions arethus required to close the plastic tap and to reduce the detrimental effects of plastic use on theworld environment and potentially human health.2.4 Objective of this reportThe objective of this report is to provide one of the first global quantitative assessments of thedirect releases of primary microplastics of petrochemical origin into the world’s ocean. This reportseeks to contribute to a better identification and prioritisation of the sources and pathways ofmicroplastic pollution. With this information, decision-makers and key stakeholders can makeinformed decisions and undertake targeted actions to address the problem.2Other uses than plastic products are not accounted by plastic branch associations (personal communication from Plastics Europe).3References are provided in the methodological appendix.10
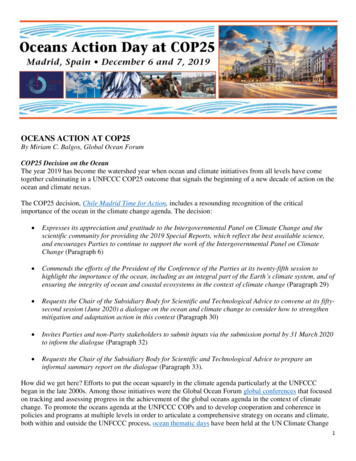
P R I M A R Y M I C R O P L A S T I C S I N T H E O C E A N S : A G L O B A L E VA L U AT I O N O F S O U R C E S3.Description of issues & methodologySeven major sources of primary microplasticsare identified and evaluated in this report:Tyres, Synthetic Textiles, Marine Coatings,Road Markings, Personal Care Products, PlasticPellets and City Dust. Losses in the environmentand releases to the world ocean are quanitifedand presented in the following three scenarios:optimistic, central and pessimistic, and for 7geographic regions.11
P R I M A R Y M I C R O P L A S T I C S I N T H E O C E A N S : A G L O B A L E VA L U AT I O N O F S O U R C E S3.1 Literature review of key sourcesPlastics are used in many activities performed by businesses and by households on land or at sea.The main known primary microplastic sources are reported and classified in Table 1, based on datarecently published from Denmark (Lassen et al., 2015), Sweden (Magnuson et al., 2016), Norway(Sundt et al., 2014), and Germany (Essel et al., 2015).In our study losses and releases of primary microplastics are quantified at global scale for the sevensources identified as dominant in preceding studies. These are as RKINGSPERSONALCAREPRODUCTSPLASTICPELLETSCITY DUSTThese different sources stem from different household or commercial activities both on land andat sea, as presented in Table 1.Table 1MAIN SOURCES OF PRIMARY MICROPLASTICSIDENTIFIED IN THE OLDACTIVITIESACTIVITYON LANDACTIVITYAT SEA12COMMERCIALACTIVITIES
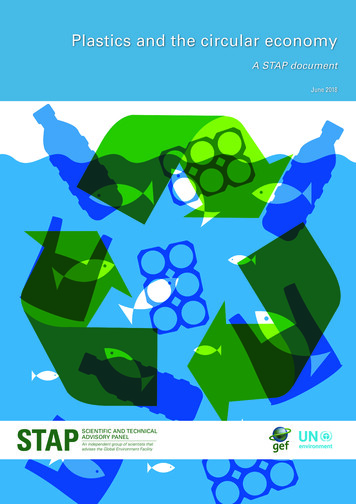
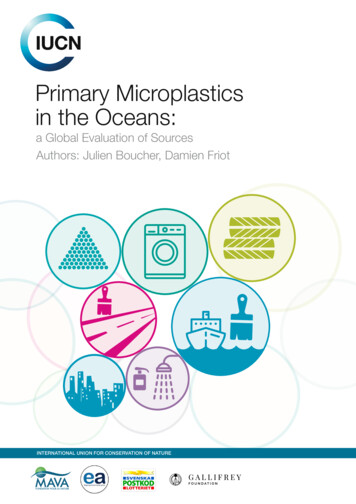
P R I M A R Y M I C R O P L A S T I C S I N T H E O C E A N S : A G L O B A L E VA L U AT I O N O F S O U R C E S3.2 A lifecycle perspective of lossesLosses of primary microplastics occur at various stages of the lifecycle of plastic and plasticproducts (Figure 1). Plastic pellets are the only losses occurring during the production, transport orrecycling stages of plastics. Most losses mainly occur during the use phase of products containingplastic such as driving a car or during their maintenance such as washing clothes. This contrastswith secondary microplastics that mostly originate from mismanaged waste during the disposal ofproducts containing plastics.Figure 1LIFECYCLE OF PLASTIC ANDPLASTIC PRODUCTSPLASTIC LIFE CYCLEPRODUCT LIFE CYCLEWITH INFORMATION ON SOURCES OF LOSSESOF PRIMARY MICROPLASTICSPRIMARY MICROPLASTICSSECONDARY MICROPLASTICSSPILLSPLASTICPRODUCTION PRODUCTMAINTENANCEWASTEWATERTREATEDOR NOT13
P R I M A R Y M I C R O P L A S T I C S I N T H E O C E A N S : A G L O B A L E VA L U AT I O N O F S O U R C E S3.3 Description of se
The global release of primary microplastics into the ocean was estimated at 1 5 million tons per year (Mtons/year) The estimate ranges between 0 8 and 2 5 Mtons/year according to an optimistic or