Transcription
Kim et al. BMC Cancer(2021) SEARCH ARTICLEOpen AccessPreoperative nutritional risk index andpostoperative one-year skeletal muscle losscan predict the prognosis of patients withgastric adenocarcinoma: a registry-basedstudyKyung Won Kim1,2†, Koeun Lee1,3†, Jung-Bok Lee4, Taeyong Park5, Seungwoo Khang5, Heeryeol Jeong5,Chang-Seok Ko1, Jeong-Hwan Yook1, Byung-Sik Kim1 and In-Seob Lee1*AbstractBackground: Patients with gastric cancer have an increased nutritional risk and experience a significant skeletalmuscle loss after surgery. We aimed to determine whether muscle loss during the first postoperative year andpreoperative nutritional status are indicators for predicting prognosis.Methods: From a gastric cancer registry, a total of 958 patients who received curative gastrectomy followed bychemotherapy for stage 2 and 3 gastric cancer and survived longer than 1 year were investigated. Clinical andlaboratory data were collected. Skeletal muscle index (SMI) was assessed based on the muscle area at the L3 levelon abdominal computed tomography.(Continued on next page)* Correspondence: inseoblee77@amc.seoul.kr†Kyung Won Kim and Koeun Lee equally contributed to this work as co-firstauthors.1Department of Surgery, Gastric Cancer Center, Asan Medical Center,University of Ulsan College of Medicine, 88, Olympic-ro 43-gil, Songpa-gu,Seoul 05505, South KoreaFull list of author information is available at the end of the article The Author(s). 2021 Open Access This article is licensed under a Creative Commons Attribution 4.0 International License,which permits use, sharing, adaptation, distribution and reproduction in any medium or format, as long as you giveappropriate credit to the original author(s) and the source, provide a link to the Creative Commons licence, and indicate ifchanges were made. The images or other third party material in this article are included in the article's Creative Commonslicence, unless indicated otherwise in a credit line to the material. If material is not included in the article's Creative Commonslicence and your intended use is not permitted by statutory regulation or exceeds the permitted use, you will need to obtainpermission directly from the copyright holder. To view a copy of this licence, visit http://creativecommons.org/licenses/by/4.0/.The Creative Commons Public Domain Dedication waiver ) applies to thedata made available in this article, unless otherwise stated in a credit line to the data.
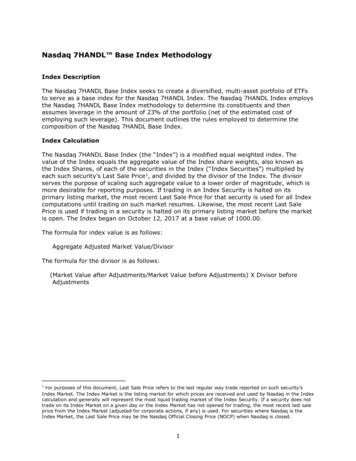
Kim et al. BMC Cancer(2021) 21:157Page 2 of 11(Continued from previous page)Results: Preoperative nutritional risk index (NRI) and postoperative decrement of SMI (dSMI) were significantlyassociated with overall survival (hazards ratio: 0.976 [95% CI: 0.962–0.991] and 1.060 [95% CI: 1.035–1.085],respectively) in a multivariate Cox regression analysis. Recurrence, tumor stage, comorbidity index were alsosignificant prognostic indicators. Kaplan-Meier analyses exhibited that patients with higher NRI had a significantlylonger survival than those with lower NRI (5-year overall survival: 75.8% vs. 63.0%, P 0.001). In addition, asignificantly better prognosis was observed in a patient group with less decrease of SMI (5-year overall survival:75.7% vs. 66.2%, P 0.009). A logistic regression analysis demonstrated that the performance of preoperative NRIand dSMI in mortality prediction was quite significant (AUC: 0.63, P 0.001) and the combination of clinical factorsenhanced the predictive accuracy to the AUC of 0.90 (P 0.001). This prognostic relevance of NRI and dSMI wasmaintained in patients experiencing tumor recurrence and highlighted in those with stage 3 gastricadenocarcinoma.Conclusions: Preoperative NRI is a predictor of overall survival in stage 2 or 3 gastric cancer patients and skeletalmuscle loss during the first postoperative year was significantly associated with the prognosis regardless of relapsein stage 3 tumors. These factors could be valuable adjuncts for accurate prediction of prognosis in gastric cancerpatients.Keywords: Gastric cancer, Surgery, Muscle loss, Nutrition, Prognosis, Survival, SarcopeniaBackgroundSurgery is the mainstay of curative treatment for gastriccancer. Gastrectomy induces physiologic derangementsincluding worsened nutritional status, significant weightloss, and decreased muscle and fat volume. The loss ofstomach reservoir function, rapid intestinal transit time,and foods bypassing the proximal small intestine are responsible for these postoperative changes [1–3].In the first year after gastrectomy, most patients experience dramatic physiologic changes, like cascade ofsarcopenia and malnutrition. Indeed, our prior studydemonstrated that skeletal muscle mass and nutritionalparameters decrease sharply for the first 3 months andslowly decrease for the remaining 9 months, eventuallyleading to a loss of 8 15% of the initial body weightand 3 5% of the muscle area [3]. In addition, adjuvantchemotherapy, which is the standard treatment in stage2 and 3 gastric cancer, exacerbates skeletal muscle lossand nutritional status of patients [4].Several tumor factors including the TNM staging system are powerful predictors of survival in gastric cancerpatients treated with surgery; however, it is insufficientin reflecting the heterogeneity of the clinical course. Anumber of patient variables such as age, performancestatus, and neutrophil/lymphocyte ratio have been identified as prognostic factors for overall survival in the lastdecade [5–7]. Recently, the prognostic value of preoperative sarcopenia and nutritional status have beengaining emphasis [8, 9]. However, we have beenimpressed that progressive skeletal muscle loss after gastrectomy might also be a powerful prognostic indicatorbased on thousands of cases of practice in our dedicatedgastric cancer center. Especially, it seems that the muscleloss at 1 year after surgery, when adjuvant chemotherapyis completed, might be particularly important to indicateoverall health state and prognosis of patients.Thus, we hypothesized that the progressive muscleloss during the first postoperative year is a significantpredictor of overall survival along with preoperative nutritional status in patients with stage 2 or 3 gastric cancer who survived longer than 1 year. To evaluate ourhypothesis, we performed this large-scale study with theaid of artificial intelligence techniques to measure bodycomposition.MethodsThe protocol for this retrospective and registry-basedcohort study was approved by the institutional reviewboard of Asan Medical Center, Seoul, Korea (IRB No.2017–0216). This study was reported according to theTransparent Reporting of a multivariable predictionmodel for Individual Prognosis or Diagnosis (TRIPOD)guidelines [10].Patient selectionThe current study was conducted on the basis of a comprehensive and prospectively built gastric cancer surgeryregistry containing the demographic characteristics ofpatients, preoperative evaluation results, surgery-relatedand postoperative outcomes, pathologic information,and follow-up data. From the registry, the data of 9940patients who received surgery for biopsy-proven primarygastric adenocarcinoma from 2007 to 2012 at AsanMedical Center, Seoul, Korea were initially extracted.Subsequently, we included patients based on specific inclusion and exclusion criteria.The inclusion criteria were as follows: (a) patients whowere treated with curative gastrectomy followed by
Kim et al. BMC Cancer(2021) 21:157adjuvant chemotherapy using S-1 or capecitabine plusoxaliplatin (XELOX) for pathologic stage 2 and 3 gastriccancer based on the American Joint Committee on Cancer 7th edition [11], (b) patients aged between 18 and85 years, (c) patients who abide by a regular follow-upprotocol with available data on demographic measures,laboratory findings, and abdominopelvic computed tomography (CT) images. Patients (a) who died within 1 yearafter surgery, (b) who received neoadjuvant treatment,(c) with a history of previous partial gastrectomy, (d)with any synchronous malignancy in another organ, and(e) with inappropriate clinical or radiologic data were excluded. The patient selection process is illustrated inFig. 1.Medical data collection and follow-upThe preoperative clinicopathologic characteristics of thepatients, including age, sex, body weight, height, bodymass index (BMI), and history of any synchronous malignancy or comorbidity, were evaluated. Comorbiditywas assessed by Charlson Comorbidity Index [12]. Information about the type of operation (open vs. laparoscopic approach), type of gastrectomy (distal vs. totalgastrectomy), extent of lymph node dissection (D1 vs.D1 vs. D2), and pathologic data including Lauren’sclassification [13] and pathologic tumor stage were collected from the registry.Laboratory parameters such as serum protein and albumin at preoperative and postoperative periods wereextracted from the registry. The nutritional risk index(NRI) was calculated based on the formula (1.519 serum albumin g/L) 0.417 (present weight / usualFig. 1 Flow chart of the patient selectionPage 3 of 11weight) 100 [14]. The difference in NRI (dNRI) between before and 1 year after surgery was assessed. Bodyweight and BMI were measured at all visits. Recurrencewas evaluated by serum tumor marker measurement, endoscopy, and abdominopelvic CT following the guidelines for gastric cancer treatment [15].Assessment of body compositionCT scans obtained before and 1 year after surgery wereselected for body morphometric analysis. PreoperativeCT was checked within 1 month before surgery on average. Body composition was assessed with abdominopelvic CT using an automated artificial intelligencesoftware (AID-U , iAID Inc., Seoul, Korea), which wasdeveloped using a fully convolutional network (FCN)segmentation technique [16]. A specialized abdominalradiologist (K.W.K), who was blinded to the clinical information, selected the axial CT slice at the L3 vertebralinferior endplate level in a semi-automatic manner withthe aid of coronal reconstructed images. Then, thechosen images were automatically segmented to generate the boundary of total abdominal muscles. The skeletal muscle area (SMA) including all muscles on theselected axial images, i.e., psoas, paraspinal, transversusabdominis, rectus abdominis, quadratus lumborum, andinternal and external obliques, were demarcated usingpredetermined thresholds ( 29 to 150 Hounsfieldunits). The visceral fat area (VFA) and subcutaneous fatarea (SFA) were also demarcated using fat tissue thresholds ( 190 to 30 Hounsfield units) (SupplementaryFigure S1). The SMA was adjusted for the square of theheight (SMA/height2), which is referred to as the skeletal
Kim et al. BMC Cancer(2021) 21:157muscle index (SMI) [17]. The differences in SMA andSMI between before and 1 year after surgery were calculated to yield dSMA and dSMI, respectively.Statistical analysisContinuous data were reported as means with standarddeviations, and categorical data were presented as proportions. Normality was assessed using frequency histograms and the Kolmogorov-Smirnov test. A paired t-testwas used to compare preoperative with postoperativebody composition and nutritional parameters. Overallsurvival was defined as the time interval between thedate of surgery and the date of patient’s death from anycause. Patients were censored at 5 years for overall survival if they were alive at 5 years after surgery. Follow-uploss and recurrence were also regarded as censoring.The primary endpoint of this study was to determineprognostic factors to predict overall survival in patientswho lived longer than 1 year after gastrectomy. A Coxproportional hazards model was used for univariate andmultivariate analyses, and outcomes were reported ashazards ratios and 95% confidence intervals. The covariates that were significant in univariate Cox analysis wereincluded in multivariate one. In multivariate analysis, thebackward elimination method was used to fit the modeland to determine the final significant predictors afterconfirming that there was no significant multicollinearitybetween variables by examining the correlation matrices.The secondary endpoint was to evaluate predictiveperformance of the progressive muscle loss (dSMI) andpreoperative nutritional status (NRI) to predicting mortality. Patients were dichotomized (high-risk vs. low-riskgroup) according to the median value of dSMI and preoperative NRI. Survival curves were estimated for eachgroup using the Kaplan-Meier method and comparedstatistically using the log rank test. Logistic regressionanalysis with Enter model was carried out to assess theperformance dSMI and NRI for prediction of patientmortality during the follow-up period, and the performance was evaluated with receiver operating characteristic(ROC) curves and area under the curves (AUCs).As a subgroup analysis, all these statistical analyseswere performed in a recurrence group and additionalanalyses were also undertaken according to tumor stage.P-value of 0.05 was used as the level of significance forthe study. Statistical analyses were performed using SASsoftware version 9.4 (SAS Institute Inc., Cary, NC, USA)and IBM SPSS version 26 (IBM, Armonk, NY, USA).ResultsBaseline characteristicsFigure 1 illustrates the patient selection process. Amongthe initial 9940 patients who were registered in the gastric cancer surgery registry, there were 1750 patientsPage 4 of 11with stage 2 or 3 gastric adenocarcinoma who weretreated with gastrectomy followed by adjuvant chemotherapy. During the process, we excluded 538 patientsnot receiving adjuvant treatment including cases withtumor stage of pT1N or pT3N0 (n 455) which arenot indicated to adjuvant treatment according to Koreanand Japanese gastric cancer treatment guidelines, andthose with poor general condition, severe comorbidity,and postoperative complication (n 83).After excluding those who had insufficient image quality for body morphometry analysis or incomplete followup data (n 719) and who died within 1 year after surgery (n 73), a total of 958 patients were included in thestudy. As seen in Table 1, we divided patients into a recurrence group (n 293) and a non-recurrence group(n 665), because the treatment and prognosis of twopopulation differ significantly. In a recurrence group, 26patients experienced tumor relapse within 6 monthsafter surgery. Type of gastrectomy and distribution oftumor stage were different between two groups; totalgastrectomy and tumors with an advanced stage weremore frequently observed in patients experiencing relapse. The other variables did not differ significantly between the two groups.Among patients, 42.4% had at least one comorbidityand 89.4% received open surgery. Distal gastrectomy wasmore frequently performed than total gastrectomy(57.2% versus 42.8%) (Table 1).Changes in body composition and nutritional parametersBody weight diminished during the first postoperativeyear (mean loss of 5.9 kg). All parameters related to bodycomposition (SMA, SMI, SFA, VFA) and NRI measuredat 1 year after surgery showed a significant decrementcompared with preoperative values as well (Supplementary Table S1). These changes were consistently observed in both the recurrence group and the nonrecurrence group. The representative cases were presented in Supplementary Figure S2.Prognostic relevance of skeletal muscle loss and NRIUnivariate and multivariate cox-hazard regression analysis results were presented in Table 2. In univariate analysis, the recurrence was the strongest prognosticindicator (HR 13.992). Among the clinicopathologic variables, old age, male sex, higher comorbidity index, advanced tumor stage, open surgery, total gastrectomy,and larger tumor size were associated with a shorter survival period in patients with stage 2 and 3 gastric cancer.Among preoperative body composition and nutrition related parameters, SFA and NRI affected prognosis.Among the parameters for body composition and nutrition change between before and 1 year after surgery,dSMI was predictive of overall survival.
Kim et al. BMC Cancer(2021) 21:157Page 5 of 11Table 1 Clinicopathologic characteristics of patients with stage 2 and 3 gastric cancerVariablesWhole patients (N 958)Recurrence group (N 293)Non-recurrence group (N 665)Mean age at operation, years ( SD)57.0 ( 12.3)57.7 ( 12.6)56.7 ( 12.2)Male624 (65.1%)196 (66.9%)428 (64.4%)Female334 (34.9%)97 (33.1%)237 s138 (14.4%)44 (15.0%)94 (14.1%)Hypertension271 (28.3%)86 (29.4%)185 (27.8%)Lung disease38 (4.0%)14 (4.8%)24 (3.6%)Cerebrovascular accident64 (6.7%)20 (6.8%)44 (6.6%)Heart disease25 (2.6%)8 (2.7%)17 (2.6%)Liver cirrhosis9 (0.9%)4 (1.4%)5 (0.7%)Renal disease15 (1.6%)4 (1.4%)11 (1.7%)Charlson Comorbidity Index0.0650243 (24.4%)62 (21.1%)181 (27.2%)1–2465 (48.5%)147 (50.2%)318 (47.8%)3–6250 (26.1%)84 (28.7%)166 (25.0%)Type of operation0.063Laparoscopy102 (10.6%)23 (7.8%)79 (11.9%)Open856 (89.4%)270 (92.2%)586 (88.1%)Distal gastrectomy549 (57.2%)149 (50.9%)400 (60.2%)Total gastrectomy409 (42.8%)144 (49.1%)265 (39.8%)D120 (2.0%)6 (2.0%)14 (2.1%)D1 plus241 (25.2%)77 (26.3%)164 (24.7%)D2697 (72.8%)210 (71.7%)487 (73.2%)2A199 (20.8%)26 (8.9%)173 (26.0%)2B237 (24.7%)61 (20.8%)176 (26.5%)3A194 (20.3%)47 (16.0%)147 (22.1%)3B194 (20.3%)80 (27.3%)114 (17.1%)3C134 (14.0%)79 (27.0%)55 (8.3%)Type of gastrectomy0.007Extent of lymphadenectomy0.934TNM stagea 0.001aTNM stage was based on the American Joint Committee on Cancer 7th editionWhen these significant variables were included in themultivariate analysis as covariates, the recurrence wasalso the strongest predictor of overall survival (HR16.838), and comorbidity index, TNM stage, preoperative NRI, and dSMI remained as significant prognosticfactors. These results support our hypothesis that progressive muscle loss during the first year after gastrectomy is an independent predictor of worse prognosis(dSMI; HR 1.060) along with protective effect of preoperative nutritional status (NRI; HR 0.976).As tumor recurrence was a dominant factor, we separately investigated the prognostic relevance of muscle lossin the recurrence group. In univariate analysis, in additionto tumor stage, Lauren’s classification, and preoperativeNRI, dSMI, and dSFA were related with survival. Notably,in multivariate analysis, the dSMI (HR 1.045) and NRI(HR 0.966) maintained their significances as independentprognostic indicators of overall survival along with pathologic tumor stage and dSFA. These analyses enabled us toascertain that dSMI and NRI were consistently associatedwith the prognosis irrespective of tumor recurrence. Clinicopathologic characteristics based on these two indicatorswere compared in Supplementary Table S2.Prognostic impact of NRI and skeletal muscle loss onstage 3 gastric adenocarcinomaNext, as the tumor stage was an independent prognosticfactor, we further undertook a subgroup analysis bytumor stage (Table 3). A multivariate analysis exhibitedthat NRI was a consistent prognostic indicator for
Kim et al. BMC Cancer(2021) 21:157Page 6 of 11Table 2 Cox proportional hazards regression analyses of overall survival according to tumor recurrenceVariablesWhole group (N 958)Univariate analysisRecurrence group (N 293)Multivariate analysisUnivariate analysisHR95% CIP-valueAge (continuous)1.0191.011–1.028 0.0011.002 0.992–1.0120.701Sex (male)1.2421.007–1.5310.0431.009 0.785–1.2970.943BMI (continuous)0.9680.935–1.0010.0610.999 0.960–1.0390.955CCI (continuous)1.2231.138–1.314 0.0011.1731.082–1.272 0.001 1.068 0.977–1.1690.150TNM stage (stage 3)1.9271.573–2.362 0.0011.3241.054–1.6630.016 1.528 1.175–1.9870.002Operation type (open)1.4581.027–2.0720.0351.308 0.845–2.0240.229Gastrectomy type (total)1.2401.020–1.5060.0301.109 0.875–1.4050.393Tumor size (continuous)1.0791.052–1.108 0.0011.022 0.990–1.0550.173Tumor location (upper vs.others)1.0580.949–1.1810.3101.033 0.921–1.1590.575Lauren’s classification (othertypes vs. intestinal)0.9290.814–1.0600.2721.245 1.073–1.445Recurrence13.992 11.197–17.486HR95% CIP-valueHR95% CI P-valueMultivariate analysisHR95% CI P-valueClinicopathologic 0.001 16.838 13.089–21.662 0.001 NANA1.312 0.998–1.7240.0510.0041.157 0.989–1.3540.069NANANANAPreop. Body/Nutrition (as a continuous �0.999 73 0.0010.9761.0600.9981.001 0.995–1.0071.0010.075 0.999 0.997–1.0010.4970.999 0.997–1.0010.4470.962–0.9910.002 0.981 0.966–0.9960.0141.035–1.085 0.001 1.045 1.019–1.0710.996–1.0000.966 0.950–0.983 0.001 0.001 1.045 1.019–1.073 0.0010.002Body/Nutrition change (as a continuous variable)dSMI1.0431.019–1.066 0.001dSFA1.0000.998–1.0030.8161.004 1.002–1.0070.002dVFA1.0000.998–1.0020.8811.001 0.998–1.0030.660dNRI1.0000.993–1.0060.9171.004 0.995–1.0020.4061.005 1.002–1.008Abbreviations: HR Hazards ratio, CI Confidence interval, CCI Charlson comorbidity index, Preop Preoperative, SMA Skeletal muscle area, SMI Skeletal muscle index,SFA subcutaneous fat area, VFA Visceral fat area, NRI Nutritional risk index, dSMA Difference in SMA between before and one year after surgery, dSMI Difference inSMI between before and one year after surgery, dNRI Difference in NRI between before and one year after surgeryoverall survival regardless of tumor stage. Also, in patients with stage 3 gastric cancer, dSMI was significantlyassociated with the prognosis along with tumor recurrence, comorbidity index, and NRI in multivariate analysis. However, the statistical significance of muscle losswas not observed in stage 2 tumors.Performance of skeletal muscle loss and NRI asprognostic stratifiersThe 5-year overall survival rate of patients included inthis study were 69.4%. To evaluate the role as a prognostic stratifier, patients were dichotomized (high-risk vs.low-risk group) according to the median value of
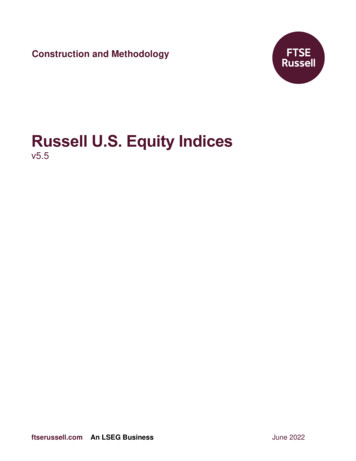
Kim et al. BMC Cancer(2021) 21:157Page 7 of 11Table 3 Cox proportional hazards regression analyses of overall survival according to tumor stageVariablesStage 2 (N 436)Univariate analysisHR95% CI P-valueAge (continuous)1.0281.013–1.044Sex (male)1.232BMI (continuous)Stage 3 (N 522)Multivariate analysisUnivariate analysisHR95% CI P-value 35–1.0160.220CCI (continuous)1.3861.227–1.566 0.0010.028 1.1611.063–1.268 0.001Operation type 23Gastrectomy 490.290Tumor ��1.096 0.001Tumor location (uppervs. 293Lauren’s classification(other types 1.0730.275Recurrence14.203 10.027– 0.001 12.748 8.946–18.167 0.001 12.486 9.275–20.11816.808HR95% CIP-valueMultivariate analysisHR95% CIP-valueClinicopathologic1.154 1.016–1.3101.3351.132–1.573 0.001 0.001 17.841 12.542–25.378 0.001Preop. Body/Nutrition (as a continuous –0.978 0.0010.997 0.994–0.9990.971 0.948–0.9951.0000.995–1.0070.7460.044 9 0.9680.953–0.983 2Body/Nutrition change (as a continuous .0190.103Abbreviations: HR Hazards ratio, CI Confidence interval, CCI Charlson comorbidity index; Preop., preoperative, SMA Skeletal muscle area, SMI Skeletal muscle index,SFA subcutaneous fat area, VFA Visceral fat area, NRI Nutritional risk index, dSMA Difference in SMA between before and one year after surgery, dSMI Difference inSMI between before and one year after surgery, dNRI Difference in NRI between before and one year after surgerypreoperative NRI (100.941) and dSMI ( 2.059). KaplanMeier curves showed that patients with a better nutritional status (higher NRI) had a significantly better prognosis (5-year overall survival rate: 75.8% vs. 63.0%,P 0.001) (Fig. 2a). In addition, patients with less decrease of skeletal muscle (smaller dSMI) also demonstrated longer survival period (5-year overall survivalrate: 75.7% vs. 66.2%, P 0.009) (Fig. 2b). In a subgroupanalysis with the relapse group, a significant survival difference was observed between high-risk group and lowrisk group for both NRI (5-year overall survival rate:27.9% vs. 13.7%, P 0.003) and dSMI (26.2% vs. 16.4%,P 0.006) (Fig. 2c and d). Then, we conducted survivalanalyses based on tumor stage and it demonstrated that
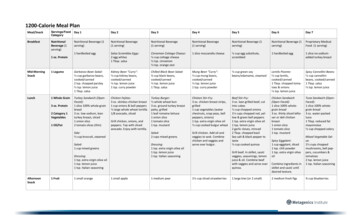
Kim et al. BMC Cancer(2021) 21:157Page 8 of 11Fig. 2 Kaplan-Meier curves showing the survival differences between two risk groups defined by NRI and skeletal muscle loss. In the wholepatient group, patients were dichotomized by the median value of NRI (a) and dSMI (b). A subgroup analysis was undertaken in the recurrencegroup and patients were divided according to NRI (c) and dSMI (d). By pathologic tumor stage, analyses were performed by two variables instage 2 (e and f) and stage 3 (g and h) gastric cancer patientsNRI stratified the prognosis in stage 2 group (85.0% vs.77.8%, P 0.001) (Fig. 2e) but dSMI was not associatedwith the survival difference (Fig. 2f). However, we againascertained that both factors significantly divided thesurvival curves of patients with stage 3 gastric cancer inline with Cox regression analysis (Fig. 2g and h).Next, we evaluated two variables’ performance in mortality prediction with a logistic regression model. For allpatients with stage 2 and 3 gastric cancer, the accuracyto predict mortality resulted in the AUC of 0.61 (95%CI: 0.58–0.64, P 0.001) and 0.54 (95% CI: 0.51–0.57,P 0.015) in NRI and dSMI, respectively. Then, weassessed a combined prediction model consisting of twofactors and it exhibited the AUC of 0.63 (P 0.001),which was higher than an individual variable. Subsequently, clinical factors including tumor recurrence,stage, and comorbidity index which were significant inmultivariate analysis were combined to the predictionmodel, and the AUC was increased to 0.90 (95% CI:0.88–0.92, sensitivity 79.6%, specificity 91.9%, P 0.001)(Fig. 3a). In the recurrence group, although the individual performance of NRI and dSMI was not significant, aFig. 3 Receiver operating characteristic (ROC) curves demonstrating the performance of preoperative NRI and dSMI in predicting mortality andthe enhanced performance of prediction was seen when combined with clinical factors in the whole group (a), the recurrence group (b), andstage 3 gastric cancer patient group (c)
Kim et al. BMC Cancer(2021) 21:157combined model with staging and Lauren’s classificationexhibited the AUC of 0.75 and it was statistically significant (95% CI: 0.69–0.80, sensitivity 76.3%, specificity70.6%, P 0.005) (Fig. 3b). Finally, we evaluated the performance of two variables in stage 3 tumors and yieldedthe AUC of 0.61 but, when combined with recurrenceand comorbidity index, the performance was improvedto the AUC of 0.91 (95% CI: 0.88–0.94, sensitivity 82.8%,specificity 93.5%, P 0.001) (Fig. 3c).DiscussionIn this study, the multivariate Cox-hazard regression results supported our hypothesis that the one-year loss ofskeletal muscle after gastrectomy (dSMI) is a significantpredictor of overall survival along with preoperative nutritional status (NRI) in gastric cancer patients who survived longer than 1 year. Although several powerfulprognostic factors for overall survival including recurrence, TNM stage, and comorbidity (HRs, 16.838, 1.324,and 1.173, respectively) were included in the multivariateanalysis, the dSMI (HR 1.060) and preoperative NRI (HR0.976) eventually remained as independent predictors.Kaplan-Meier curves also showed that less degree ofpostoperative muscle loss (small dSMI) and a better nutritional status before surgery (NRI) had a protective effect on the survival. These prognostic values of twovariables were maintained even in patients with relapsedtumor and underscored in stage 3 gastricadenocarcinoma.Nowadays, progressive loss of skeletal muscle mass hasbeen highlighted as a prognostic factor in cancer patients, which is associated with cancer cachexia. Indeed,cachexia significantly contributes to mortality in patientswith malignancy, accounting for more than 20% of cancer deaths [18]. Especially, in patients with gastric cancer, sarcopenia is known to be highly prevalent [19, 20],and a marked reduction in the initial body weight andmuscle mass during the first postoperative year closelymimics the malnutrition and cancer cachexia cascade.Although several studies have reported preoperative sarcopenia as an indicator of poor prognosis, it could notreflect the prognostic uniqueness of the steep deterioration of muscle amount after gastrectomy [17, 21]. Theincreased mortality related to muscle loss in this studymight be explained by that a higher degree of cachexiaaggravates systemic inflammation and metabolic alterations leading to the poor prognosis in combination witha decrease in body protein stores. In addition, loss ofmuscle mass might also influence the tolerability ofchemotherapy in those patients.Our study, as a large-scale research, demonstrated thatprogressive muscle loss during the first year after gastrectomy is also a significant indicator of worse prognosis. Indeed, in a recent study based on a randomizedPage 9 of 11multicenter trial, a marked loss in muscle or subcutaneous/visceral fat at 6 months after surgery could predictpoor prognosis in patients with stage 2/3 gastric cancer[22]. However, some limitations such as relatively smallnumber of cases, inclusion of a sig
loss, and decreased muscle and fat volume. The loss of stomach reservoir function, rapid intestinal transit time, and foods bypassing the proximal small intestine are re-sponsible for these postoperative changes [1-3]. In the first year after gastrectomy, most patients ex-perience dramatic physiologic changes, like cascade of