Transcription
2019 Taulbee SurveyTotal Undergrad CS Enrollment Rises Again,but with Fewer New Majors; Doctoral DegreeProduction Recovers From Last Year’s DipBy Stuart Zweben and Betsy BizotThis article and the accompanying figures and tables present the results from the 49th annual CRA Taulbee Survey.1 Thesurvey, conducted annually by the Computing Research Association, documents trends in student enrollment, degreeproduction, employment of graduates, and faculty salaries in academic units in the United States and Canada thatgrant the Ph.D. in computer science (CS), computer engineering (CE), or information (I).2 Most of these academic unitsare departments, but some are colleges or schools of information or computing. In this report, we will use the term“department” to refer to the unit offering the program.CRA gathers survey data during the fall. Responses received byFebruary 7, 2020 are included in the analysis. The period coveredby the data varies from table to table. Degree production andenrollment (Ph.D., Master’s, and Bachelor’s) refer to the previousacademic year (2018-19). Data for new students in all categoriesrefer to the current academic year (2019-20). Projected studentproduction and information on faculty salaries are also for thecurrent academic year; salaries are those effective January 1, 2020.We surveyed a total of 278 Ph.D.-granting departments andreceived responses from 181, for an overall response rate of 65percent. Last year we had the same number of respondents,but included more departments in our survey and had a 61percent response rate. The response rates from CE and Canadiandepartments in particular continue to be low. The U.S. CS responserate of 77 percent is, as usual, the highest of all of the categories,and is higher than last year’s 73 percent and equal to the U.S. CSresponse rate of two years ago. Figure 1 shows the history ofthe survey’s response rates. Response rates are inexact becausesome departments provide only partial data, and some institutionsprovide a single joint response for multiple departments. Thus, insome tables the number of departments shown as reporting willnot equal the overall total number of respondents shown in Figure1 for that category of department.3To account for the changes in response rate, we will commentnot only on aggregate totals but also on averages per departmentreporting or data from those departments that responded to both2018 and 2019 surveys. This is a more meaningful indication of theone-year changes affecting the data.Degree, enrollment, and faculty salary data for the U.S CSdepartments are stratified according to: a) whether the institutionis public or private; and b) the tenure-track faculty size of thereporting department. The faculty size strata deliberately overlap,so that data from most departments affect multiple strata. Thismay be especially useful to departments near the boundaryof one stratum. Salary data is also stratified according to thepopulation of the locale in which the institution is located.3These stratifications allow our readers to see multiple views ofimportant data, and hopefully gain new insights from them. Inaddition to tabular presentations of data, we will use “box andwhisker” diagrams to show medians, quartiles, and the rangebetween the 10th and 90th percentile data points.We thank all of the respondents to this year’s questionnaire. Theparticipating departments are listed at the end of this article.CRA member respondents will again be given the opportunity toobtain certain survey information for a self-selected peer group.Instructions for doing this will be emailed to all such departments.cra.org/crnMay 2020
2019 Taulbee Survey (continued)Figure 1. Number of Respondents to the Taulbee SurveyYearUS CS Depts.US CE Depts.1995110/133 (83%)9/13 (69%)11/16 (69%)130/162 (80%)199698/131 (75%)8/13 (62%)9/16 (56%)115/160 (72%)1997111/133 (83%)6/13 (46%)13/17 (76%)130/163 (80%)1998122/145 (84%)7/19 (37%)12/18 (67%)141/182 (77%)1999132/156 (85%)5/24 (21%)19/23 (83%)156/203 (77%)US InformationTotal2000148/163 (91%)6/28 (21%)19/23 (83%)173/214 (81%)2001142/164 (87%)8/28 (29%)23/23 (100%)173/215 (80%)2002150/170 (88%)10/28 (36%)22/27 (82%)182/225 (80%)2003148/170 (87%)6/28 (21%)19/27 (70%)173/225 (77%)2004158/172 (92%)10/30 (33%)21/27 (78%)189/229 (83%)2005156/174 (90%)10/31 (32%)22/27 (81%)188/232 (81%)2006156/175 (89%)12/33 (36%)20/28 (71%)188/235 (80%)2007155/176 (88%)10/30 (33%)21/28 (75%)2008151/181 (83%)12/32 (38%)20/30 (67%)9/19 (47%)192/264 (73%)2009147/184(80%)13/31 (42%)16/30 (53.3%)12/20 (60%)188/265 (71%)186/234 (79%)2010150/184 (82%)12/30 (40%)18/29 (62%)15/22 (68%)195/265 (74%)2011142/185 (77%)13/31 (42%)13/30 (43%)16/21 (76%)184/267 (69%)2012152/189 (80%)11/32 (34%)14/30 (47%)16/26 (62%)193/277 (70%)2013144/188 (77%)10/30 (33%)14/26 (54%)11/22 (50%)179/266 (67%)2014143/188 (76%)13/31 (42%)12/26 (46%)13/19 (68%)181/268 (68%)2015146/190(77%)8/32 (25%)12/26 (46%)12/18 (67%)178/266 (67%)2016150/188 (80%)8/33 (24%)11/26 (42%)14/21 (67%)183/268 (68%)2017148/192 (77%)8/35 (23%)11/30 (37%)14/24 (58%)181/281 (64%)2018143/195 (73%)5/34 (15%)12/30 (40%)14/24 (58%)174/283 (61%)2019148/192 (77%)7/35 (20%)11/29 (38%)15/22 (68%)181/278 (65%)Doctoral Degree Production,Enrollment, and Employment(Tables 1, D1-D10; Figures D1-D6)Degree ProductionDoctoral degree production increased in 2018-19, recovering tolevels more comparable to those of two years ago. This year’srespondents produced 13.2 degrees per U.S. CS department, and12.2 degrees per department overall. This compares with 12.6 and12.1, respectively, reported last year, and 13.1 and 12.4, respectively,reported two years ago. More departments (160) reported theirPh.D. production this year than did so last year (156). Total Ph.D.production in 2018-19 was 1,860 compared with 1,787 degreesproduced in 2017-18 and 1,834 in 2016-17 (Table D1).4CanadianAmong all departments reporting both this year and last year, thenumber of total doctoral degrees rose by 2.7 percent. However,among U.S. CS departments reporting both years, the increase was6.9 percent (Table 1).In 2018-19, women received 20.3 percent of CS doctoral degreesand 20.8 percent of all doctoral computing degrees (Table D2). Lastyear, the respective percentages were 19.3 and 21.3. Non-residentAliens comprised a smaller percentage of 2018-19 Ph.D. recipientsin all three areas (CS, CE and I) compared with 2017-18 recipients.This is the reverse of what was experienced last year. In contrast,resident Asians comprised a larger percentage compared with lastyear among recipients in all three areas(Table D3). The combined percentage of CS doctoral graduates whowere American Indian or Alaska Native, Black or African American,cra.org/crnMay 2020
2019 Taulbee Survey (continued)Native Hawaiian/Pacific Islander, Hispanic, or Multiracial NonHispanic was only 3.1 percent; it was 3.8 percent in 2017-18.Unlike in previous years, Non-resident Aliens comprised asomewhat smaller percentage of the CS female doctoral graduatesthan they did CS male graduates, and Whites comprised an equalpercentage of the female and male graduates. In past years,Non-resident Aliens had a higher percentage of female than maleCS graduates, while Whites had a higher percentage of male thanfemale CS graduates (Table D9).Doctoral Program EnrollmentTotal doctoral enrollment increased by 1.4 percent, and increased8.6 percent among programs that reported both years. If only U.S.computer science departments are considered, the respectiveincreases were 4.2 and 8.5 percent (Table 1). For the fourth straightyear, total doctoral enrollment by gender is more diverse. Acrossthe three areas of CS, CE and I combined, the fraction of 201819 doctoral students who were women is 24.5 percent, versus23.4 percent in 2017-18. In CS, women comprised 23.2 percent ofthe 2018-19 students currently enrolled, versus 22.3 percent theprevious year (Table D7).By contrast, doctoral enrollment by ethnicity was less diverse in2018-19. The overall fraction of doctoral students who were neitherNon-resident Aliens, Asian, nor White declined from 6.9 percent to4.9 percent. In CS programs, the fraction declined from 7.0 to 4.5percent (Table D8).As has been true in previous years, Non-resident Aliens comprisea higher percentage of the enrolled CS women than they do theenrolled CS men, while a lower percentage of enrolled CS womenthan enrolled CS men are White. The same relationships hold forCE. In I, the same pattern holds for White students (they comprisea lower percentage of women than of men), but Non-residentAliens also comprise a smaller percentage of enrolled women thanof enrolled men (Table D10).At U.S. CS departments, the average number of students perdepartment who passed qualifier exams in 2018-19 was 17.0,similar to the 17.2 reported the previous year. Both public andprivate institutions reported slight declines this year, followingtwo consecutive years of increases. The average number per U.S.CS department who passed thesis candidacy exams in 2018-19(most, but not all, departments have such exams) also declinedfrom 2017-18 at both public and private institutions (Table D1).Table 1. Degree Production and Enrollment Change From Previous YearTotalUS CS OnlyPhDsPhD Awarded2019All DepartmentsUS CS Only% chg20182019% 1211296.6%1481533.4%107107PhD ,145#Units PhD Enr139138-0.7%169164-3.0%127127New PhD 340.8%162161-0.6%117117#Units PhD Awd#Units New PhDAll Departments% chg20182019% 3,5741451458.5%6.7%8.6%7.6%Bachelor’s20182019% chg20182019% chg20182019% chg20182019% chgBS 9139BS 863130,942142,667158,879#Units BS Enr1311353.1%1561602.6%118118140140New BS 3833,05230,839#Units New %1,0501,0772.6%1,0331109.71019.11134.9#Units BS AwdBS Enroll/Dept52018Only Departments Responding Both Yearscra.org/crn7.5%-8.8%7.5%11.4%-6.7%11.4%May 2020
2019 Taulbee Survey (continued)The number of new Ph.D. students per department reportingincreased again this year compared with last year’s reportingdepartments for both U.S. I and Canadian departments(Tables 1 and D5). There was a decline again for CE departments,and a slight decline among U.S. CS departments. Amongdepartments that reported both years, the number of new Ph.D.students increased 7.6 percent overall and 6.7 percent among U.S.CS departments.The proportion of new doctoral students from outside NorthAmerica rose this year to 61.2% from 59.3% last year. There wereincreases at U.S. CS and U.S. CE departments, while there weredecreases in U.S. I departments. Canadian department proportionswere similar to those of last year (Table D5a).Figure D5 shows a graphical view of the Ph.D. pipeline for U.S.computer science and Canadian departments, the main producersof CS doctoral degrees. The data in this graph are normalizedTable D1. PhD Production and Pipeline by Department TypeDepartmentTypePhDs Awarded# DeptsPhDs Next YearPassed Qualifier#Avg/ Dept#Avg/ Dept#Passed Thesis (if dept has)Avg/ Dept## DeptAvg/ DeptUS CS Public1001,22212.91,43014.31,58717.311687615.4US CS Private3447914.160317.757616.52462410.3US CS Total1341,70113.22,03315.22,16317.01,41410014.1US CE5234.6489.6144.71234.0US 13.4Grand TotalTable D2. PhDs Awarded by GenderCSMale1,31379.7%33420.3%FemaleTotal Known 38720.8%1,647118921,85720131,649118931,860Gender UnknownGrand TotalCETable D3. PhDs Awarded by EthnicityCSNonresident k or .6%40.2%36524.9%1314.6%4047.6%41825.5%Multiracial, not Hispanic90.6%33.4%00.0%120.7%Hispanic, any race211.4%11.1%11.2%231.4%Amer Indian or Alaska NativeNative Hawaiian/Pac IslanderWhiteTotal Residency & Ethnicity Known1,46889841,641Resident, ethnicity unknown524460Residency unknown1292551591,649118931,860Grand Total6CEcra.org/crnMay 2020
2019 Taulbee Survey (continued)High-Performance ComputingHuman-Computer InteractionInformatics: Biomedical / Other ScienceInformation ScienceInformation SystemsNetworksOperating SystemsProgramming Languages / CompilersRobotics / VisionScientific / Numerical ComputingSecurity / Information AssuranceSocial Computing / Social InformaticsSoftware EngineeringTheory and mputing EducationUnknownHardware / Architecture25Databases / Information RetrievalTenure-trackArtificial Intelligence / Machine LearningGraphics / VisualizationTable D4. Employment of New PhD Recipients By SpecialtyNorth American PhD Granting Depts.PostdocTeaching FacultyNorth American, Other AcademicOther CS/CE/I Dept.044210410012031004302322.3%Non-CS/CE/I 658440165238465977657.0%North American, 31 69786494 1,26092.5%Total Inside North AmericaOutside North AmericaTen-Track in PhD404201023221000601302332.4%Researcher in PhD00000000000000100000010.1%Postdoc in PhD301000000100210101411161.2%Teaching in PhD100000220020010100201120.9%Other 000010130.2%Total Outside NA1916302253456231121415171027.5%Total with Employment Data, Inside North America plus Outside North 1 1,362211315151322044939181421 28374 53 36 69 64 3819Employment Type & Location Unknown38Grand Total731201419 99cra.org/crn79 56 32 10318 98 3349881 107 86 384 1,860May 2020
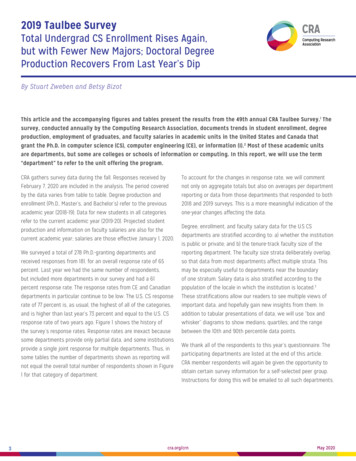
2019 Taulbee Survey (continued)by the number of reporting departments. The graph offsets thequalifier data by two years from the data for new students, andoffsets the graduation data by five years from the data for newstudents. These data have been useful in estimating the timingof changes in production rates. The graph predicts larger growthbeginning next year, and departments are indeed forecasting adouble-digit percent increase in production during 2019-20(Table D1). Last year’s departmental forecast double-digitpercentage increase in production did not materialize; much moremodest growth was obtained.Computing EducationDatabases / Information RetrievalGraphics / VisualizationHardware / ArchitectureHigh Performance ComputingHuman-Computer InteractionInformatics: Biomedical / Other ScienceInformation ScienceInformation SystemsNetworksOperating SystemsProgramming Languages / CompilersRobotics / VisionScientific /N umerical ComputingSecurity / Information AssuranceSocial Computing / Social InformaticsSoftware EngineeringTheory and 01533111141624331.3%TotalUnknownArtificial Intelligence / Machine LearningTable D4a. Detail of Industry EmploymentInside North 584401652384659776Type Not SpecifiedTotal Inside NAOutside North 000000000000010013.3%Type Not Specified00000000000100000010026.7%Total Outside NA101110101000401021150130Table D5. New PhD Students by Department t.NewAdmitUS CS Public2,0261782,20422.7114US CS PrivateUS CS TotalUS CEUS InformationCanadianGrand Total8CEMS toPhDITotalAvg.perDept.NewAdmit1297.686815MS 51867.22342225611.63,73223.2cra.org/crnMay 2020
2019 Taulbee Survey (continued)Table D5a. New PhD Students from Outside North AmericaDepartmentTypeCSCEITotal NewOutsideTotal New% outsideNorthAmericaUS CS Public1,41086391,5352,42763.2%US CS 70374778.7%Total US CSUS CEUS 73261.2%CanadianGrand TotalTable D6. PhD Enrollment by Department TypeDepartment Type# DeptsCSCEITotalUS CS Public10010,14966.2%74776.8%36435.0%11,26064.9%US CS Private384,26327.8%586.0%403.8%4,36125.1%Total US CS13814,41293.9%80582.7%40438.8%15,62190.0%US CE500.0%16817.3%00.0%1681.0%US 0.0%00.0%8284.8%16415,342Grand Total9731,04017,355ITotalTable D7. PhD Enrollment by 5%Female3,47723.2%22823.9%45944.2%4,16424.5%Total ,04017,355Gender UnknownGrand TotalTable D8. PhD Enrollment by EthnicityCSNonresident AlienAmer Indian or Alaska NativeAsianBlack or African-AmericanNative Hawaiian / Pac IslanderWhiteMultiracial, not HispanicHispanic, any raceTotal dent, ethnicity unknown4052358486Residency unknown101600101615,3429731,04017,355Grand Total9CE9,205cra.org/crnMay 2020
2019 Taulbee Survey (continued)Table D9. PhDs Awarded by Gender and Ethnicity, From 153 DepartmentsCSMaleNonresident AlienFemCEN/R% ofM*% ofF*MaleEthnicityTotalsIFemN/R% ofM*% ofF*MaleFemN/R% ofM*% lack or AfricanAmericanNative Hawaiian/Pac 976025251030132121190406141825.5Multiracial,not Hispanic630113004000000120.7Hispanic, any 1Resident, ethnicityunknown428240031060Not Reported 20.3%Amer Indian orAlaska NativeWhiteTotal Res &Ethnicity KnownGender Totals%83.9% 16.1%63.0% 37.0%* % of M and % of F columns are the percent of that gender who are of the specified ethnicity, of those whose ethnicity is knownTable D10. PhD Enrollment by Gender and Ethnicity, From 164 Departments Providing Breakdown DataCSCEN/R% ofM*% ofF*MaleN/R% ofM*% 78829647944816Black or AfricanAmericanNative Hawaiian/Pac 4201112046142210,5983,168Resident, ethnicityunknown292Not Reported (N/R)637Nonresident AlienAmer Indian orAlaska NativeMultiracial,not HispanicHispanic, any raceTotal Res &Ethnicity KnownEthnicityTotalsIN/R% ofM*% 183338MaleFem6,939Gender 45976.1%23.9%55.8%44.2%0.0%* % of M and % of F columns are the percent of that gender who are of the specified ethnicity, of those whose ethnicity is known10cra.org/crnMay 2020
2019 Taulbee Survey (continued)Ph.D. EmploymentFigure D6 shows the employment trend of new Ph.D.s in academiaand industry within North America, those taking employmentoutside of North America, and those going to academia inNorth America who took positions in departments other thanPh.D.-granting CS and CE departments. Table D4 shows a moredetailed breakdown of the employment data for new Ph.D.s. Thepercentage of new Ph.D.s who took positions in North Americanindustry was 57.0 percent, the same as the percentage reportedlast year. Among those doctoral graduates who went to NorthAmerican industry and for whom the type of industry position wasknown, about 63 percent took research positions (Table D4a). Thisalso is the percentage reported last year. This year, definitive datawas provided for over 90 percent of the graduates who went toNorth American industry, slightly lower than last year’s 92 percent.The percentage of Ph.D. graduates who took North Americanacademic jobs in 2018-19 (31.5) also was similar in that reported for2017-18 (31.2). Among those graduates taking academic positionsin North America, the percentage who did not go to a doctoralgranting computing department was 8.9, compared to 5.7 in 201718. This number has oscillated for the last several years, so thisrise should not be interpreted as any indication of a trend.Among those whose employment is known, 7.5 percent of Ph.D.graduates reported taking positions outside of North America,similar to the reported values in each of the past two years.Slightly higher percentages of these persons went to an industry,tenure-track academic, and academic postdoctoral positions than11did so last year. A slightly lower percentage went to academicresearcher and government positions. However, most of thedoctoral graduates who went to non-North American industrypositions took research positions. Definitive data was providedfor 93 percent of the graduates who went to non-North Americanindustry positions.When academic and industry postdocs are combined, the result isthat 15.0 percent of 2018-19 doctoral graduates whose employmentwas known took some type of postdoctoral position. Last year,the reported percentage was 14.8. Approximately eight percent ofthese were industry postdocs.Of those doctoral graduates for whom employment informationwas known, only one person was reported as unemployed.However, 26.8 percent of new Ph.D.s’ employment status wasunknown. The lack of information about the employment of morethan one in four graduates may skew the real overall percentagesfor certain employment categories.Table D4 also indicates the areas of specialty of new Ph.D.s.Artificial intelligence/machine learning continues to be by far themost popular area, comprising nearly 17 percent of all doctoraldegrees awarded. However, this year, theory/algorithms androbotics/vision were next highest, replacing software engineeringand networks. The fourth most popular specialty area bothlast year and this year is security/information assurance.Approximately one in five of the Ph.D.s are categorized into thearea “unknown.”cra.org/crnMay 2020
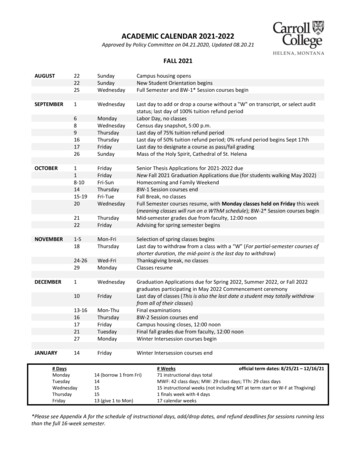
2019 Taulbee Survey (continued)Figure D1. PhD ProductionCRA Taulbee Survey 2019Figure D2. Nonresident Aliens as Fraction of PhD EnrollmentsCRA Taulbee Survey 201912cra.org/crnMay 2020
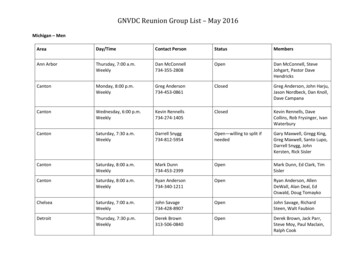
2019 Taulbee Survey (continued)Figure D3. PhD Degrees Granted by Tenure-Track SizeCRA Taulbee Survey 2019Figure D4. PhD Enrollment Normalized by Tenure-Track SizeCRA Taulbee Survey 201913cra.org/crnMay 2020
2019 Taulbee Survey (continued)Figure D5. CS Pipeline corrected for year of entryFigure D6. Employment Trends for New Ph.D.s14cra.org/crnMay 2020
2019 Taulbee Survey (continued)Master’s and Bachelor’s DegreeProduction and Enrollmentsdepartments reporting in the two respective years. No comparisonis made for the CE area due to the even smaller number ofdepartments reporting (Table M1).This section reports data about enrollment and degree productionfor master’s and bachelor’s programs in the doctoral-grantingdepartments. Although the absolute number of degrees andenrolled students reported herein only reflect departments thatoffer the doctoral degree, the trends observed in the master’s andbachelor’s data from these departments tend to strongly reflecttrends in the larger population of programs that offer such degrees.The proportion of female graduates among CS master’s degreerecipients rose from 26.5 percent to 27.2 percent. Womencomprised 24.6 percent of the CE graduates, down from 27.5percent, and the I area graduated more women than men amongthose whose gender was reported (53.9 percent, versus 48.8percent in last year’s report). Aggregating all areas, the percentageof master’s degrees to women increased from 30.6 to 31.2 percent(Table M2).Master’s(Tables M1-M8; Figures M1-M2)On a per department basis, 2018-19 CS master’s degree productionin U.S. CS departments rose by 8.1 percent compared with 201718. The production at public institutions rose 16.7 percent, whilethat at private institutions declined by 6.4 percent. Each of thesecomparisons with 2017-18 is in the reverse direction of the year-toyear comparison reported in last year’s survey.In CS, 68.8 percent of master’s degrees went to Non-residentAliens, slightly lower than the 70.0 percent in 2017-18. Thepercentage of Non-resident Aliens also dropped slightly in the Iarea, from 44.4 percent to 43.3 percent. The CE area statistics aremore volatile due to the smaller number of units reporting; thepercentage of CE degrees going to Non-resident Aliens increasedfrom 70.8 to 79,8 percent. The aggregate percentage over all threeOverall master’s degree production per department in 2018-19rose 7.1 percent aggregated over all departments, 6.1 percent atU.S. CS departments and 9.1 percent at Information departments.Canadian production per department showed a 46 percentincrease, but with only nine departments reporting versus 11 lastyear, this comparison may well be skewed by the difference inareas dipped slightly, from 65.4 to 64.7 percent. The percentageof CS master’s recipients among American Indian/Alaska Native,Black/African-American, Native Hawaiian/Pacific Islander, Hispanic,and Multiracial was approximately 4.0 percent in 2018-19 versus 3.6percent in 2017-18 (Table M3).Table M1. Master’s Degrees Awarded by Department TypeDepartmentType# DeptsCSCEITotalUS CS Public1008,62158.5%38354.3%48715.7%9,49151.2%US CS Private365,23535.5%8912.6%61519.9%5,93932.0%Total US CS13613,85694.0%47267.0%1,10235.6%15,43083.3%US CE500.0%22331.6%00.0%2231.2%US .6%101.4%00.0%8424.5%16214,735Grand Total7053,09418,534Table M2. Master’s Degrees Awarded by 24.6%Total Known 418,534Gender UnknownGrand 4868.8%5,51931.2%May 2020
2019 Taulbee Survey (continued)Table M3. Master’s Degrees Awarded by EthnicityCSNonresident .0%70.0%1,54711.8%284.5%41214.1%1,98711.9%Black or ative Hawaiian/Pac IslandMultiracial, not HispanicHispanic, any ,7357053,09418,534Resident, ethnicity unknownResidency unknownGrand TotalTotal6AsianTotal Residency & Ethnicity KnownI9,042Amer Indian or Alaska NativeWhiteCETable M4. Master’s Degrees Expected Next Year by Department TypeDepartmentType#DeptsCSCEITotalUS CS Public998,49459.5%29651.4%36711.7%9,15750.9%US CS Private345,22436.6%9616.7%52116.7%5,84132.5%Total US CS13313,71896.1%39268.1%88828.4%14,99883.4%US CE500.0%17931.1%00.0%1791.0%US .6%50.9%00.0%5222.9%15914,278Grand Total6183,12417,978Table M5. New Master’s Students by Department DeptsAvg.perDept.Outside sAvg.perDept.#Depts%US CS 6,40161.4%US CS 66.1%Total US ,21163.1%US CEUS InformationCanadianGrand 23485.419,074164116.311,66261.1%cra.org/crnMay 2020
2019 Taulbee Survey (continued)Table M6. Total Master’s Students by Department al#DeptsAvg. perDept.US CS 75.4US CS 479613368.9Total US CSUS CEUS 0Grand 6301.3Table M7. Masters Degrees Awarded by Gender and Ethnicity, From 164 Departments Providing Breakdown DataCSMaleNonresident AlienAmer Indian orAlaska aleFemN/R%ofM*%ofF*Total8860052513651000100070.038 lack or AfricanAmerican1123941150010476125442931.8Native Hawaiian/Pac 634516,6863231513522867576542811941,473 36018,534WhiteMultiracial,not HispanicHispanic, any raceTotal Res &Ethnicity KnownResident, ethnicityunknownNot Reported (N/R)66226018692623Gender 4.6%46.1% 53.9%* % of M and % of F columns are the percent of that gender who are of the specified ethnicity, of those whose ethnicity is
2019 Taulbee Survey Total Undergrad CS Enrollment Rises Again, but with Fewer New Majors; Doctoral Degree Production Recovers From Last Year's Dip By Stuart Zweben and Betsy Bizot CRA gathers survey data during the fall. Responses received by February 7, 2020 are included in the analysis. The period covered by the data varies from table to table.