Transcription
ENSO: Recent Evolution,Current Status and PredictionsUpdate prepared by:Climate Prediction Center / NCEP6 June 2022
OutlineSummaryRecent Evolution and Current ConditionsOceanic Niño Index (ONI)Pacific SST OutlookU.S. Seasonal Precipitation and Temperature OutlooksSummary
SummaryENSO Alert System Status: La Niña AdvisoryLa Niña is present.*Equatorial sea surface temperatures (SSTs) are below average across most ofthe Pacific Ocean.The tropical Pacific atmosphere is consistent with La Niña.Though La Niña is favored to continue, the odds for La Niña decrease into thelate Northern Hemisphere summer (58% chance in August-October 2022)before slightly increasing through the Northern Hemisphere fall and earlywinter 2022 (61% chance).** Note: These statements are updated once a month (2nd Thursday of each month) in associationwith the ENSO Diagnostics Discussion, which can be found by clicking here.
Recent Evolution ofEquatorial Pacific SSTDepartures (oC)Recently, below-average SSTs haveweakened across most of theequatorial Pacific Ocean.
Niño Region SSTDepartures (oC) RecentEvolutionThe latest weeklySST departures are:Niño 4Niño 3.4Niño 3Niño 1 2-0.7ºC-0.9ºC-0.8ºC-0.6ºC
SST Departures (oC) in the Tropical Pacific During the LastFour WeeksIn the last four weeks, equatorial SSTs were below average across most of thePacific Ocean.2630
Global SST Departures (oC) During the Last Four WeeksDuring the last four weeks, equatorial SSTs were below average across most of the Pacific Ocean.Equatorial SSTs were above average near Indonesia, in the western Atlantic Ocean, and in thecentral Indian Ocean.3026
Weekly SST Departuresduring the Last FourWeeksDuring the last 4 weeks, negative SSTanomalies have weakened across most of theequatorial Pacific Ocean.
Change in Weekly SST Departures over the Last FourWeeksDuring the last four weeks, mostly positive changes in SST anomalies were observedacross the equatorial Pacific Ocean.
Upper-Ocean Conditions inthe Equatorial PacificThe basin-wide equatorial upper ocean (0-300 m)heat content is greatest prior to and during theearly stages of a Pacific warm (El Niño) episode(compare top 2 panels), and least prior to andduring the early stages of a cold (La Niña)episode.The slope of the oceanic thermocline is least(greatest) during warm (cold) episodes.Recent values of the upper-ocean heatanomalies (below average) and thermoclineslope index (above average) reflect La Niña.The monthly thermocline slope index represents thedifference in anomalous depth of the 20ºC isothermbetween the western Pacific (160ºE-150ºW) and theeastern Pacific (90º-140ºW).
Central and Eastern Pacific Upper-Ocean (0-300 m)Weekly Average Temperature AnomaliesFrom mid-March to early July 2021, subsurface temperature was above average. Negativetemperature anomalies returned in July 2021 and persisted through mid -January 2022.During February through mid-March, subsurface temperature anomalies decreased. Sincethen, negative anomalies have gradually weakened and are now near zero.
Sub-Surface Temperature Departures in the EquatorialPacificDuring the last two months, negative subsurfacetemperature anomalies have persisted in the centraland eastern equatorial Pacific Ocean.Most recent pentad analysisNegative subsurface temperature anomaliesprevailed near the surface across most of theequatorial Pacific Ocean. Positive anomalies wereobserved in the western and central Pacific,remaining at depth.
Tropical OLR and WindAnomalies During the Last30 DaysPositive OLR anomalies (suppressed convectionand precipitation) were located over the centraland western Pacific Ocean. Negative OLRanomalies (enhanced convection andprecipitation) were observed over parts ofIndonesia.Low-level (850-hPa) easterly wind anomalieswere evident over the east-central equatorialPacific Ocean.Upper-level (200-hPa) westerly windanomalies were observed over most of theequatorial Pacific, along with an anomalouscyclonic couplet over the east-central tropicalPacific Ocean.CC
Intraseasonal VariabilityIntraseasonal variability in the atmosphere (wind and pressure), which is often relatedto the Madden-Julian Oscillation (MJO), can significantly impact surface and subsurfaceconditions across the Pacific Ocean.Related to this activity:Significant weakening of the low-level easterly winds usually initiates an eastwardpropagating oceanic Kelvin wave.
Weekly Heat ContentEvolution in the EquatorialPacificSignificant equatorial oceanic Kelvin wave activity(dashed and dotted lines) has been presentthroughout the period shown.In July 2021, September 2021, and November2021 negative subsurface temperature anomaliesshifted eastward associated with three upwellingKelvin waves. From mid-December 2021 throughFebruary 2022, a downwelling Kelvin wave shiftedeastward.Since February 2022, an upwelling Kelvin wave hasshifted eastward into the eastern Pacific Ocean,and below-average subsurface temperatures havepersisted in the eastern Pacific.Equatorial oceanic Kelvin waves havealternating warm and cold phases. The warmphase is indicated by dashed lines. Downwelling and warming occur in the leadingportion of a Kelvin wave, and up-welling andcooling occur in the trailing portion.
Low-level (850-hPa)Zonal (east-west) WindAnomalies (m s-1)At times, the Madden Julian-Oscillation(MJO) has contributed to the eastwardpropagation of low-level wind anomalies.Since the beginning of the period,easterly wind anomalies have generallydominated over the central and eastcentral Pacific, except for breaks duringlate December-to-January 2022, lateMarch 2022, mid-May 2022, and earlyJune 2022.Westerly Wind Anomalies (orange/red shading)Easterly Wind Anomalies (blue shading)
Upper-level (200-hPa)Velocity PotentialAnomaliesDuring most of the period, anomalousdivergence (green shading) generallyremained over Indonesia or the westernPacific, while anomalous convergence(brown shading) persisted over theeastern Pacific Ocean.Unfavorable for precipitation (brown shading)Favorable for precipitation (green shading)Note: Eastward propagation is not necessarily indicative of the Madden-Julian Oscillation (MJO).
Outgoing LongwaveRadiation (OLR) AnomaliesSince late July 2021, positive OLRanomalies were evident over the westernand/or central Pacific Ocean.Negative OLR anomalies were evidentover Indonesia from early November 2021through early January 2022, duringFebruary to early March 2022, from midMarch to early April 2022, and during thefirst half of May 2022.Drier-than-average Conditions (orange/red shading)Wetter-than-average Conditions (blue shading)
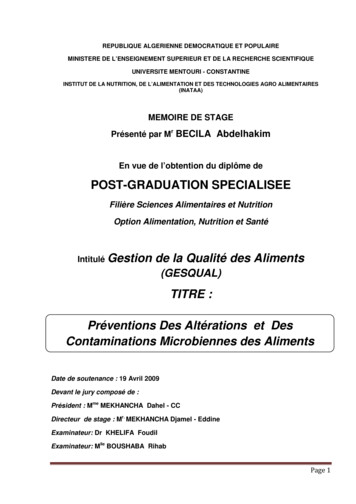
Oceanic Niño Index (ONI)The ONI is based on SST departures from average in the Niño 3.4 region, and is aprincipal measure for monitoring, assessing, and predicting ENSO.Defined as the three-month running-mean SST departures in the Niño 3.4 region.Departures are based on a set of improved homogeneous historical SST analyses(Extended Reconstructed SST – ERSST.v5). The SST reconstruction methodology isdescribed in Huang et al., 2017, J. Climate, vol. 30, 8179-8205.)It is one index that helps to place current events into a historical perspective.Note: a different SST dataset is used for weekly SST monitoring (slides #4-9) and isusing OISSTv2.1 (Huang et al., 2021).
NOAA Operational Definitions for El Niño and La NiñaEl Niño: characterized by a positive ONI greater than or equal to 0.5ºC.La Niña: characterized by a negative ONI less than or equal to -0.5ºC.By historical standards, to be classified as a full-fledged El Niño or La Niña episode,these thresholds must be exceeded for a period of at least 5 consecutive overlapping3-month seasons.CPC considers El Niño or La Niña conditions to occur when the monthly Niño3.4 OISSTdepartures meet or exceed /- 0.5ºC along with consistent atmospheric features. Theseanomalies must also be forecasted to persist for 3 consecutive months.
ONI (ºC): Evolutionsince 1950The most recent ONI value(March – May 2022) is -1.1ºC.El NiñoNeutralLa Niña
Historical El Niño and La Niña Episodes Based on theONI computed using ERSST.v5Recent Pacific warm (red) and cold (blue) periods based on a threshold of /- 0.5 ºC for the OceanicNino Index (ONI) [3 month running mean of ERSST.v5 SST anomalies in the Nino 3.4 region (5N-5S, 120-170W)].For historical purposes, periods of below and above normal SSTs are colored in blue and red when thethreshold is met for a minimum of 5 consecutive over-lapping seasons.The ONI is one measure of the El Niño-Southern Oscillation, and other indices can confirm whetherfeatures consistent with a coupled ocean-atmosphere phenomenon accompanied these periods. The completetable going back to DJF 1950 can be found 0-1.02022-1.0-0.9-1.0-1.1
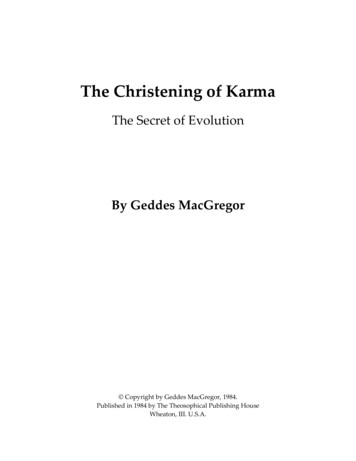
CPC/IRI Probabilistic ENSO OutlookUpdated: 12 May 2022Though La Niña is favored to continue, the odds for La Niña decrease into the lateNorthern Hemisphere summer (58% chance in August-October 2022) before slightlyincreasing through the Northern Hemisphere fall and early winter 2022 (61% chance).
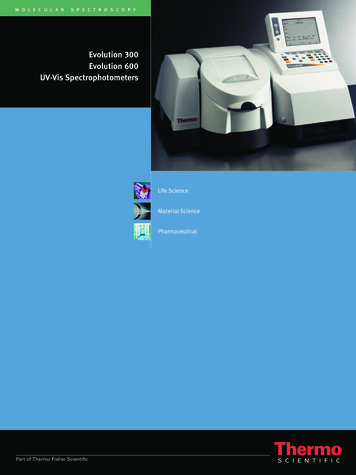
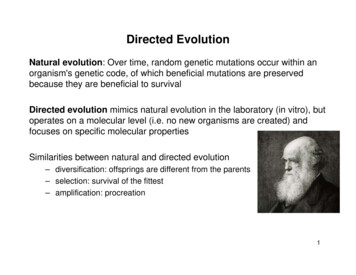
IRI/CPC Pacific Niño3.4 SST Model OutlookLa Niña is expected to weaken,but persist through the NorthernHemisphere summer and intoearly winter 2022-23.Figure provided by the International ResearchInstitute (IRI) for Climate and Society(updated 19 May 2022).
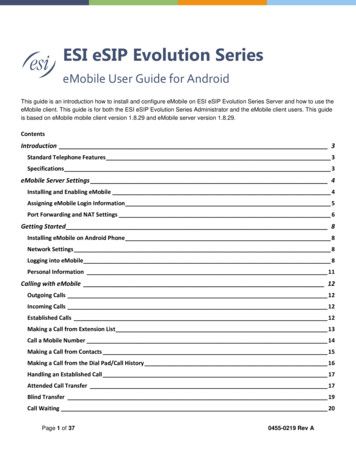
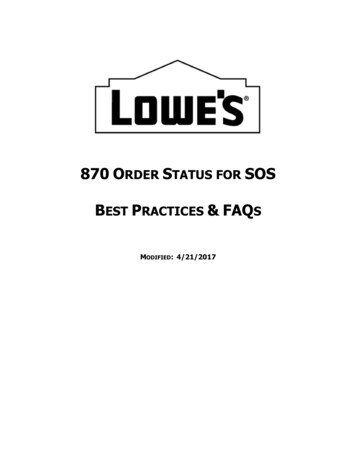
SST Outlook: NCEP CFS.v2 Forecast (PDF corrected)Issued: 6 June 2022The CFS.v2 ensemble mean (black dashed line) indicates a transition to ENSOneutral during the Northern Hemisphere summer, with borderline La Niñaconditions favored during the fall and winter.
Atmospheric anomalies overthe North Pacific and NorthAmerica During the Last 60DaysSince early April, below-average heights andtemperatures were observed over thenorthwestern and north-central U.S., whileabove-average heights and temperature mostlyprevailed over the southern and/or eastern U.S.1 of 3
Atmospheric anomalies overthe North Pacific and NorthAmerica During the Last 60DaysSince early April, below-average heights andtemperatures were observed over thenorthwestern and north-central U.S., whileabove-average heights and temperature mostlyprevailed over the southern and/or eastern U.S.2 of 3
Atmospheric anomalies overthe North Pacific and NorthAmerica During the Last 60DaysSince early April, below-average heights andtemperatures were observed over thenorthwestern and north-central U.S., whileabove-average heights and temperature mostlyprevailed over the southern and/or eastern U.S.3 of 3
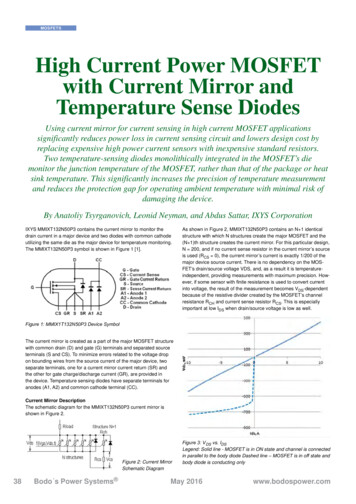
U.S. Temperature and Precipitation Departures Duringthe Last 30 DaysEnd Date: 4 June 2022Percent of Average PrecipitationTemperature Departures(degree C)1 of 2
U.S. Temperature and Precipitation Departures Duringthe Last 90 DaysEnd Date: 4 June 2022Percent of Average PrecipitationTemperature Departures(degree C)2 of 2
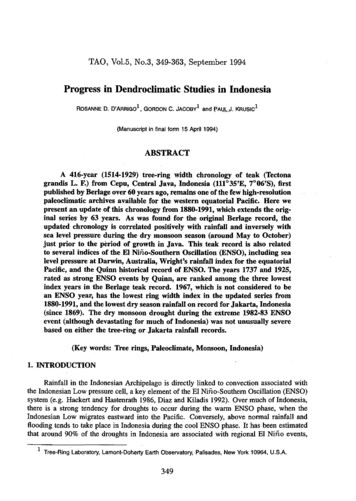
U. S. Seasonal OutlooksJune – August 2022The seasonal outlooks combine the effects of long-term trends, soil moisture,and, when appropriate, ENSO.PrecipitationTemperature
SummaryENSO Alert System Status: La Niña AdvisoryLa Niña is present.*Equatorial sea surface temperatures (SSTs) are below average across most ofthe Pacific Ocean.The tropical Pacific atmosphere is consistent with La Niña.Though La Niña is favored to continue, the odds for La Niña decrease into thelate Northern Hemisphere summer (58% chance in August-October 2022)before slightly increasing through the Northern Hemisphere fall and earlywinter 2022 (61% chance).** Note: These statements are updated once a month (2nd Thursday of each month) in associationwith the ENSO Diagnostics Discussion, which can be found by clicking here.
Sub-Surface Temperature Departures in the Equatorial Pacific Most recent pentad analysis During the last two months, negative subsurface temperature anomalies have persisted in the central