Transcription
Cold roll and anneal of Cu: metallography, microscopy, hardnessEman Mousa AlhajjiNorth Carolina State UniversityDepartment of Materials Science and EngineeringMSE 255 Lab Report203ADavid Ho2/5/2016AbstractThe hardness of moderately high purity copper (99.95%) was measured using the Rockwellhardness tester. The effect of cold-working on the hardness of copper and the effect of annealingat different times and temperatures on the hardness of copper were identified. Hardness of copperincreases with increasing of cold working. The most suitable annealing temperatures with whichto restore the ductile properties of copper was determined to be 350 C, based on microstructuralchanges. These changes which occur during cold rolling and annealing were observed using theCarl Zeiss optical microscope.1
I.IntroductionCopper was the first metal to be used by humans. It was found free in streams and used tomake jewelry. Copper is a soft, ductile metal and not useful for tools or weapons. However, theancients discovered that by beating the copper with stone tools they could make it harder andstrong, but less tough. This is what is scientifically called cold working, referring to the fact thatthe deformation takes place at a temperature well below the melting point, usually close to roomtemperature, or strain hardening.Strain hardening (Callister)1 is the process by which a metal becomes stronger as it isdeformed past its elastic limit, resulting in plastic deformation. Although changes in mechanicalproperties such as tensile strength and ductility are the most noticeable result of permanentdeformation, other physical and chemical properties are also affected; e.g., electrical resistivityincreases and the resistance to corrosion changes. In fact, strain hardening play a key role inengineering metals since their most mechanical properties change as a function of the amount ofstrain hardening.Strain hardening is considered to be a strengthening process, since it increases the tensileand yield strength. Strain hardening is explained by the increase in dislocation density (number ofdislocations per cm2) which occurs when the metal is deformed. The presence of dislocationsstrains the atomic lattice by slightly displacing atoms from their equilibrium positions. This latticestrain acts to reduce the mobility of the dislocations. The reduced dislocation mobility translatesinto an increase in the stress required to move the dislocations and, hence, an increase in thestrength of the metal (Callister).1 Permanent deformation is usually expressed quantitatively as2
percent cold work (percent reduction in cross sectional area, or in the case of cold rolling, inreduction of thickness):%CW t0 tf 100t0(1)where t0 is the original specimen thickness and tf is the final specimen thickness.However, there are limits to the degree to which metals can be shaped by this process.Repeated cold working makes the metal tougher and more brittle, eventually resulting in fracturewhen struck. It is often necessary to anneal a metal at regular intervals during the forming processin order to restore ductility and allow for further cold working. The term “annealing”, used looselyfor several types of heat treatments applied to any variety of different material systems, is generallyassociated with some kind of stress relief. The annealing of strain hardened metals has threedistinct stages (Callister) 1: Recovery, Recrystallization and Grain Growth.II.Experimental ProcedureSpecimens were made from moderately high purity copper (99.95%) and were in a fullyrecrystallized condition with large, equiaxed, strain free grains.A. Cold rollingUsing a micrometer, the thickness of the Cu bars were measured. The initial hardness of thebars were determined using the Wilson Rockwell Hardness Tester on the F scale, Model # 3JR.The thickness required for 2%, 5%, 10%, 20%, 40% and 60% cold working was calculated usingequation 1. After each reduction using Vigor RM 1000- rolling machine, the hardness measuredusing the Rockwell Hardness Tester as well.3
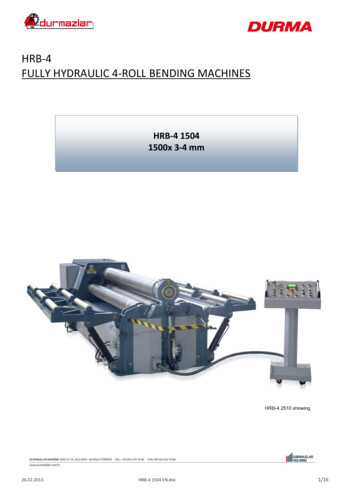
B. AnnealingThree annealing furnaces were pre-heated and held at constant temperature, one each at 270,310 and 350 C. The treatment started by placing one 60% cold worked Cu sample into each ofthe furnaces, called “fluidized sand baths”, Tecam Fluidized Bath SBS-4. Then the samples wereremoved from the bath at each of the following cumulative time intervals: 2, 5, 10, and 20 minutes.Upon removal from the furnaces, immediately each sample was quenched in cold water to stop theannealing process. Finally, the hardness of the samples was measured using the Rockwell HardnessTester.C. Metallography of Annealed Samples60% cold worked samples annealed for 20 minutes at one of each of the three temperatures andtemperature was sectioned and mounted 600 Grit - Grinding Station, polished using 6 microndiamond polishing wheel and then1 micron alumina polishing wheel , and etched. These sampleswere examined with the Carl Zeiss optical microscope. The etchant used was 60 mL NH4OH 30mL H2O2 (3%). Using the shared digital images, the effects of cold working on grain shape,orientation, and hardness, were examined as well as the effects of annealing and recrystallizationon grain size and shape.III.ResultsThe hardness of the three Cu samples was found to increase with increasing cold working.This trend is shown in Figure 1. The relationship of temperature versus pressure is roughlylogarithmic. Good agreement is absorbed between the harnesses of the three samples of copper.4
Also included in the Appendix are the values of hardness measured for copper after coldworking, and the standard deviation.Figure 1. Hardness as a function of actual % cold work.The hardness of annealed copper tends to decrease as it is hold at a constant temperaturefor a period of time, as demonstrated in Figure 2.5
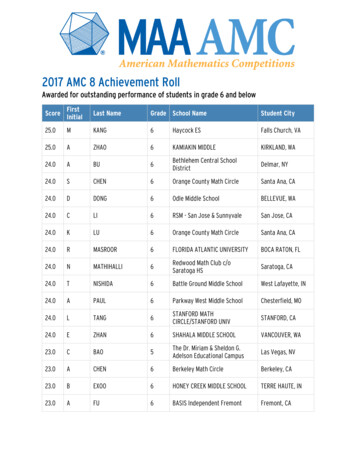
Hardness of Annealed Copper120Hardness, HRF10020, 82.180310 C 350 C 60270 C Linear (310 C )4020, 36.1Linear (350 C )Linear (270 C )2000510152025Time, minFigure 2. Hardness of copper versus annealing time as a family of three curves for differenttemperatures: 270 C , 310 C and 350 C .The slopes of hardness measured varies with different temperatures. When copper is holdat 350 C, the hardness decreases from 89.4 to 82.1 DPH. At 310 C, the hardness decreases from89.9 to 36.1 DPH. At, 270 C, the hardness decreases from 90.9 to 62.2 DPH. The collected datashows that the annealed copper at 310 C has a dramatic change in hardness after 10 minutes oftreatment, while the sample annealed at 350 C has the lowest affected hardness. The hardness ofthe Cu sample annealed at 270 C lies in between the other two. Specific values can be found inTable 2 in the appendix.6
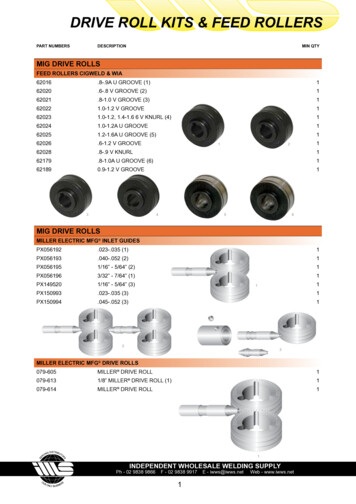
abcdFigure 3. Microstructural changes during annealing coldworked copper (a): showing 60%coldworked copper, (b): annealed coldworked copper for five minutes at atemperature of 270 C ., (c): annealed coldworked copper for five minutes at atemperature of 310 C ., and (d): annealed coldworked copper for five minutes at atemperature of 350 C .The microstructural changes in 60% coldworked copper shows a sharp increase in dislocationsdensity as seen in (a). After copper has been strain hardened, both (b, c) show some stress relief.Annealing, or more specifically recrystallization, is observed as in Figure 3. (d), where there are7
still high dislocation densities in the grain; new strain-free grains nucleate and grow to replace thestrained grains.IV. DiscussionThe curve of hardness as a function of actual % cold work shown in figure 1follows theaccepted trend for metals, given the fact that Aluminum, silver and gold have the same crystalstructure as copper and exhibit the same characteristics. 2, 3 Hardness of copper increases withincreasing cold work. Other important mechanical properties such as tensile strength and yieldstrength increase with the increase of cold working, while ductility, toughness and impact strengthdecrease. Elastic modulus neither increases nor decreases with the increase of cold working.2However, the three curves of hardness at the different temperatures of cold worked copperversus annealing do not follow the trends of other metals. Many studies have shown that the effectof temperature is much greater on restoring mechanical properties than the effect of time on theprocess of annealing metals. 1, 3 several errors could explain the differences: precision errors inannealing time; errors in hardness measurements and imprecision in labeling each sample. Thebias errors might arise from the variations of temperatures as they were not held constant. Giventhat the temperature ranges are large, the calibration curves may not be as precise.Nevertheless, the microstructures in figure. 3 indicate that the samples (b) and (c) aretransferring from the recovery stage to recrystallization, where there is some dislocation motionand a reduction in the overall number of dislocations. Some physical properties such as electricalconductivity revert to values close to their pre-cold worked values. Mechanical properties,however, are not significantly altered, although residual stresses can be relieved. 1 Furthermore,the pre-cold worked condition of the metal is restored by this annealing treatment and the property8
changes are the reverse of strain hardening. After copper has been strain hardened, annealing, ormore specifically recrystallization, will returned it to a soft and ductile condition. 3 Based on themetallographic results and hardness data, full recrystallization has occurred at 350 C. Duringrecrystallization, where the large cold worked grains are gradually replaced by a fine network ofstrain-free grains. 1, 3 The results observed in the experiment agrees with theoretical values. Theeffect of the temperature necessary for recrystallization to occur is a function of the compositionof the metal and the amount of cold work; the higher the purity or greater the amount of cold work,the lower will be the recrystallization temperature. Literature confirms the experimental result tobe accurate by stating that the recrystallization temperature for most metals is generally betweenone third and one half of the melting temperature. 2 The melting temperature for copper is 1080 C, and one third of that is 360 C, which is very close to the experimental value. 4V.ConclusionsOverall, the experiment succeeded in showing that hardness of moderately high puritycopper (99.95%) increases as cold working increases, using the Rockwell hardness tester. Fromthe hardness tests, it is asserted that annealing beyond the recovery stage has an effect onhardness. Other mechanical properties are restored as well one the material is fully recrystallized.The effect of cold-working on the hardness of copper and the effect of annealing at differenttimes ranging from 5 to 20 minutes and three constant temperatures (270, 30 and 350 C) on thehardness of copper were measured with and observed with. Differences existed in theexperimental graphs of hardness of copper versus annealing time and the theoretical trends.These differences, however, can be accounted for by experimental error. Instead, accurate results9
were derived from microstructural examination. The most suitable annealing temperature withwhich to restore the ductile properties of copper was determined to be 350 C. Microstructuralchanges which occur during cold rolling and annealing were observed using the Carl Zeissoptical microscope. Further experiments of cold rolling and annealing of copper should includefurther analysis of the grain growth and copper alloys in the strain hardening process.References1W.D. Callister Jr., Materials Science and Engineering: An Introduction, Seventh Edition(Wiley, New York, 2007).2L. Reynolds, Cold roll and anneal of Cu, MSE 255 experiment description, 2016.3W.D. Jia, K. T. Ramesh, and E. Ma, Appl. Phys. Lett. 81, 2002.4J.R. Dives, Concise Metals Engineering Data Book, (ASM International, Ohio, 1997).10
AppendixTable.1: Hardness measurements of copper after cold workingPercentCold workHardness, DPHThe Standard Deviation0% Table. 2: Hardness of Annealed Copper at Different TemperaturesTime310 C 350 C 270 C 2 min89.589.490.95 min89.689.490.710 min45.790.389.520 min36.182.162.211
05.02.2016 · Cold roll and anneal of Cu: metallography, microscopy, hardness Eman Mousa Alhajji North Carolina State University Department of Materials Science and Engineering MSE 255 Lab Report 203 A David Ho 2/5/2016 Abstract The hardness of moderately high purity copper (99.95%) was measured using the Rockwell hardness tester. The effect of cold-working on the hardness of copper