Transcription
LIFE SCIENCESSCHOOL-BASEDASSESSMENTEXEMPLARS – CAPSGRADE 12TEACHER GUIDE
LIFE SCIENCESSCHOOL-BASED ASSESSMENTEXEMPLARS – CAPSGRADE 12TEACHER GUIDELIFE SCIENCES SCHOOL-BASED ASSESSMENT EXEMPLARS – 1CAPS GRADE 12 TEACHER GUIDE
TABLE OF CONTENTSContents1.Introduction32.Aims of the project33.Programme of formal assessment in Life Sciences43.1Practical tasks53.2Research Project53.3Assignment63.4Tests and Examinations64.Scope of the project75.Quality assurance process followed76.Assessment tasks86.1Practical Task 1 – Surveying human characteristics86.2Practical Task 2 – Simulating natural selection106.3Assignment 1 – Response to the environment136.4Assignment 2 – Reproduction206.5Test – Nucleic acids and meiosis25Marking guidelines307.1Practical Task 1 – Surveying human characteristics307.2Practical Task 2 – Simulating natural selection327.3Assignment 1 – Response to the environment347.4Assignment 2 – Reproduction417.5Test – Nucleic acids and meiosis487.2LIFE SCIENCES SCHOOL-BASED ASSESSMENT EXEMPLARS –CAPS GRADE 12 TEACHER GUIDE
1.IntroductionAssessment is a continuous planned process of identifying, gathering and interpreting information about the performanceof learners, using various forms of assessment. It involves four steps: generating and collecting evidence of achievement,evaluating this evidence, recording the findings and using this information to understand and assist in the learners’development to improve the process of learning and teaching. Assessment should be both informal (Assessment forLearning) and formal (Assessment of Learning). In both cases regular feedback should be provided to learners toenhance the learning experience.School-based assessment (SBA) forms part of the formal assessment component. It is a purposive collection of learners’work that tells the story of the learners’ efforts, progress or achievement in attaining knowledge (content, concepts andskills) in the subject. The advantages of school-based assessment can be summarised as follows: It provides a more balanced and trustworthy assessment system, increasing the range and diversity of assessmenttasks. It improves the reliability of assessment because judgements are based on many observations of the learner overan extended period of time. It empowers teachers to become part of the assessment process and enhances collaboration and sharing ofexpertise within and across schools. It has a professional development function, building up practical skills in teacher assessment which can then betransferred to other areas of the curriculum.School-based assessment forms part of a year-long formal Programme of Assessment in each grade and subject. Theassessment tasks should be carefully designed to cover the content of the subject as well as the range of skills andcognitive levels that have been identified in specific aims. Tests, practical tasks, assignments and projects make up theSBA component in Life Sciences.Teachers should ensure learners understand the assessment criteria and have extensive experience using it for self- andpeer assessment in informal situations before conducting a planned formal assessment activity. Teachers should alsohave used these criteria for informal assessment and teaching purposes before they conduct any formal assessment sothat learners are familiar with the criteria and the assessment process.2.Aims of the projectThrough this publication it is envisaged that TEACHER capacity will be increased in respect of each of the following: Differentiating among the nature of the different types of assessment tasks (assignments, projects, practicaltasks, tests and examinations) Developing assessment tasks that are balanced in terms of cognitive levels, topics and skills Developing a marking guideline that: Is appropriate to the task Clearly shows mark allocation and distribution Includes alternative answersDeveloping tasks that contain a variety of question typesThrough this publication it is also envisaged that LEARNERS will benefit by: Developing an understanding of the differences amongst the nature of the various types of assessment tasks Being exposed to assessment tasks that are of the same standard as those that they are exposed to during thecourse of the yearLIFE SCIENCES SCHOOL-BASED ASSESSMENT EXEMPLARS – 3CAPS GRADE 12 TEACHER GUIDE
3.Programme of formal assessment in Life Sciences This includes all assessment tasks that make up the formal programme of assessment for the year. Formal assessment tasks are marked and recorded by the teacher for promotion and certification purposes. All tasks must be subjected to pre- and post-moderation to ensure that appropriate standards are maintained. The table that follows shows the number and types of assessment tasks required in the Grade 12 year.Formal, recorded, school-based assessmentContent PracticalTwo written examination papers (2½ hours 2½ hours)Three tests 3 practical tasks(minimum of 50 marks each) Practical tasks must cover therange of skills under SA 2. Marks per practical task should bebetween 20 and 40.One June examination(2½ hours, 150 marks) Trial (Preliminary) examinationOne trial examination (2 x 2½ hours, 150 markseach) One project/assignment(can be done in any termbut recorded in Term 3: 100marks)1 trial (preliminary)examination – 2 x 2½ hours, 150 marks eachThis examination must test: Knowledge of content, concepts and skills across alltopics Knowledge of practical work as well as some of the skillsrelated to practical work All work completed in Terms 1, 2 and 3 as well as theGrade 11 topic (Human impact on the environment) thatis assessable in Grade 12School-based assessment (during the year)Term 1Term 2Term 3 and Term 4 One test One test One test One practical task Onepracticaltask One practical task 1 project orassignment 33⅓%Juneexam33⅓%33⅓%Convert to 50%50%SBA Total: 100NOTE: The SBA mark must be converted to 25% and the external examination counts 75% of the final mark.A description of the requirements for each of the different types of assessment tasks follows below.4LIFE SCIENCES SCHOOL-BASED ASSESSMENT EXEMPLARS –CAPS GRADE 12 TEACHER GUIDE
Practical tasks3.1When designing the practical tasks, the Life Sciences teacher must ensure that:All 7 skills under Specific Aim 2 listed below are covered over the three practical tasks: 1.Follow instructions2.Handle equipment or apparatus3.Make observations4.Record information or data5.Measure accurately6.Interpret information7.Design/Plan an investigation At least ONE of the practical tasks includes manipulation of apparatus and/or collection of data. Any ONE practical task assesses at least 3 of the 7 skills and must include skill 6 and/or 7. 20–40 marks are allocated to a practical task.Research Project3.2At least ONE of the tasks across Grades 10–12 must be a research project.When designing the research project, the Life Sciences teacher must ensure that it: Is a long-term task (at least 3 weeks of non-contact time) Has a maximum mark of 100 covers Specific Aims 1, 2 and 3 Is recorded in Term 3 even if it is given and assessed in Term 1 or Term 2 Is an investigative task Focuses on accessing knowledge through literature research as well as through primary sources such as people Includes sub-skills such as: Formulating investigative questions and hypotheses Gathering information from a variety of sources Manipulating and processing information Analysing information Identifying patterns Evaluating data Drawing valid conclusions Communicating findingsLIFE SCIENCES SCHOOL-BASED ASSESSMENT EXEMPLARS – 5CAPS GRADE 12 TEACHER GUIDE
Assignment3.3At least ONE of the tasks across Grades 10–12 must be an assignment.When designing an assignment, the Life Sciences teacher must ensure that it: Is a short-term task (1½-2 hours under controlled conditions) Has a maximum mark of 100 Covers Specific Aims 1, 2 and 3 Is completed at school and not at home Is recorded in Term 3 even if it is given and assessed in Term 1 or Term 2 Covers a variety of topics Includes as many as possible of the following:3.4 Analysing and interpreting data Making drawings Plotting graphs Drawing tables Performing calculations Justifying conclusionsTests and ExaminationsWhen designing the tests as well as the mid-year and trial examinations, the Life Sciences teacher must ensure that: The test is a minimum of 50 marks. The test in Term 1 covers all work done in that term. The tests in Term 2 and Term 3 cover at least half of the work covered in the respective terms. The mid-year examinations cover work completed in Term 1 and Term 2. The trial examinations cover all work completed in Terms 1, 2 and 3, and must include the section on ‘HumanImpact’ from Grade 11. Mainly Specific Aims 1 and 3 are covered. Specific Aim 2 (knowledge and understanding of investigations and practical work) is also included, but in asmaller proportion compared to Specific Aims 1 and 3. Tests and examinations are balanced in terms of cognitive levels and topic weightings. In this regard weightinggrids must be used. Tests and examinations are analysed diagnostically and appropriate remedial and intervention strategies areinstituted. Tests and examinations follow the external examination in its design, rigour and format.6LIFE SCIENCES SCHOOL-BASED ASSESSMENT EXEMPLARS –CAPS GRADE 12 TEACHER GUIDE
4.Scope of the projectThis publication includes the following: Requirements for the Grade 12 Programme of Assessment for the Life Sciences CAPS curriculum A description of the various types of assessment tasks (assignment, project, practical task and test) Exemplar assessment tasks (assignment, practical task and test) Marking Guidelines for each assessment taskThe following exemplars together with their marking guidelines have been included in this publication:5.Type of assessmenttask included in thispublicationNumber includedin this publicationNumber required inthe Grade 12 yearTerm in which assessment task isrequiredAssignment21Term 3Practical task23Term 1, Term 2, Term 3 or 4Test13Term 1, Term 2, Term 3 or 4Quality assurance process followedA team of experts comprised of teachers and subject advisors from provinces was appointed by the DBE to developand compile assessment tasks. They were required to extract excellent examples of learner tasks from their respectiveschools and districts. The panel of experts spent a period of four days at the DBE, developing tasks based on guidelinesand policies. Moderation and quality assurance of the tasks were undertaken by national and provincial examiners andmoderators. The assessment tasks were further refined by the national internal moderators to ensure that they were inline with the CAPS document.LIFE SCIENCES SCHOOL-BASED ASSESSMENT EXEMPLARS – 7CAPS GRADE 12 TEACHER GUIDE
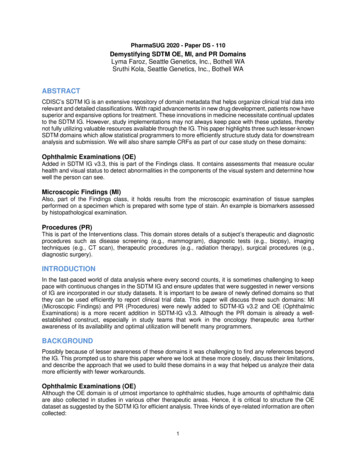
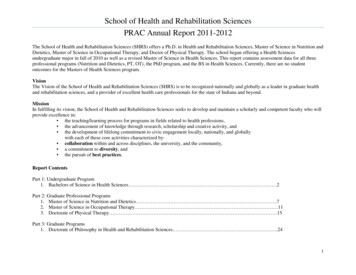
6.Assessment tasksPractical Task 1 – Surveying human characteristics6.1TopicGeneticsSpecific aim(s)SA 2Type of activityIndividualMarks30Duration90 minutesTaskConduct a survey of the occurrence/frequency of dominant and recessive phenotypes for each of three traits/characteristics (as shown in the pictures below) among the learners in your school. This task must be done individually. This practical must be completed at school.Background informationMany characteristics in humans are controlled by one gene with two alleles, one dominant and one recessive. Threeexamples are shown rNon-rollerStraight thumbBent (hitchhiker’s) essiveMethod1.Select 20 learners that will form part of your sample.2.For every learner selected, record the phenotype for each characteristic.3.Record the information for each learner in a table. At the end of the table, include the percentage of learnersdisplaying each phenotype for each of the three characteristics.4.Answer the questions set.8LIFE SCIENCES SCHOOL-BASED ASSESSMENT EXEMPLARS –CAPS GRADE 12 TEACHER GUIDE
Questions1.List any FOUR planning steps for this investigation.2.In terms of the investigation about the type of earlobe (free or attached), name the following:2.1The dependent variable2.2The independent variable(4)(1)(1)3.Formulate a hypothesis for the frequency of tongue-rollers as compared to non-rollers in yourschool.(3)4.Construct a table to show the results obtained in this investigation.(4)5.According to the results obtained, would you accept or reject the hypothesis formulated inQUESTION 3?(1)6.State TWO ways in which you could make the results of this investigation more reliable.(2)7.Using the same system of axes, draw a bar graph to represent the percentage of learners displayingeach phenotype for each of the three characteristics.(8)8.Use the symbols R (tongue-roller) and r (non-roller) to represent the phenotypes and genotypes ofoffspring resulting from a cross between two heterozygous individuals.(6)[30]LIFE SCIENCES SCHOOL-BASED ASSESSMENT EXEMPLARS – 9CAPS GRADE 12 TEACHER GUIDE
Practical Task 2 – Simulating natural selection6.2TopicEvolutionSpecific aim(s) SA 2Type of activity Pair/ IndividualMarksDuration3060 minutesTaskSimulate ‘natural selection’ using a paper model. This task must be done in pairs but the questions must be answered individually. This practical must be completed at school.Background informationA simulation allows one to demonstrate something that might sometimes be dangerous or that might sometimes requirea lot of time, quickly and in a simple and safe way, using models.The different parts that comprise the paper model in this task represent different components in nature. The sheet ofnewspaper and the sheet of white paper represent two different environmental conditions. The circles cut from whitepaper and from newspaper represent the different appearances/phenotypes of different individuals of the same species.AimYou are required to investigate the survival of the organisms with the two different phenotypes under differentenvironmental conditions.Materials required A sheet of white paper (preferably A3 size) to use as background A sheet of newspaper (cut to A3 size) to use as background Forceps/tweezers Clock with a second hand/stopwatch Scissors 30 x 2 cm diameter circles cut from another sheet of newspaper 30 x 2 cm diameter circles cut from another sheet of white paper Ruler10LIFE SCIENCES SCHOOL-BASED ASSESSMENT EXEMPLARS –CAPS GRADE 12 TEACHER GUIDE
Method1.Place the sheet of white paper on the table.2.Spread 30 white paper circles and 30 newspaper circles randomly over the surface of the white paper.3.Ask your partner to use a pair of forceps/tweezers to pick up as many circles as he/she can in a period of 15seconds.4.Count the number of each type of circle that has been picked up. Record this in the table provided.5.Now repeat steps 1–4 using the sheet of newspaper instead of the sheet of white paper.Questions12.3. Formulate a hypothesis for the above investigation when using the sheet of white paper asbackground.(3)For this investigation, name:2.1 The dependent variable(1)2.2 The independent variable(1)2.3 Any TWO fixed variables(2)Copy and record your results in the following table:DIFFERENTBACKGROUNDSSTARTING POPULATIONWhite papercirclesNewspapercirclesWhite paper3030Newspaper3030NUMBER OF CIRCLESPICKED UP ON DIFFERENTBACKGROUNDSWhite papercirclesNewspaper circles(2)(8)4.Draw a bar graph on the same system of axes to represent the results of yourinvestigation.5.Explain the difference in results obtained for the two types of circles when using the sheet of whitepaper.(3)6.State ONE way in which you could improve the reliability of the results.(1)LIFE SCIENCES SCHOOL-BASED ASSESSMENT EXEMPLARS – 11CAPS GRADE 12 TEACHER GUIDE
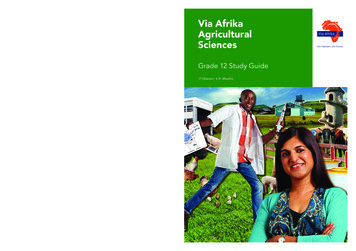
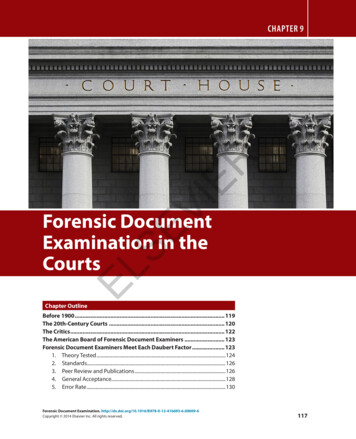
7.State a conclusion for the above investigation when the newspaper was used as a background.(3)8.Based on the results obtained, will you accept or reject the hypothesis you formulated in QUESTION1?(1)9.Explain how this investigation and the results of this investigation simulate natural selection as itoccurs in the peppered moth. Use the picture below to help you make a comparison.(5)[30]12LIFE SCIENCES SCHOOL-BASED ASSESSMENT EXEMPLARS –CAPS GRADE 12 TEACHER GUIDE
Assignment 1 – Response to the environment6.3TopicResponse to the environmentSpecific aim(s)SA 1, SA 2, SA 3Type of activityIndividualMarks100Duration90 minutesInstructions and information1.Answer ALL questions.2.Number the answers correctly according to the numbering system used in this question paper.3.Draw diagrams and flow charts ONLY when requested to do so.4.This assignment is to be done under controlled conditions and must be handed in at the end of the session.NOTE: If it is not possible to schedule a single 90-minute session for this assignment, then SECTION A can bedone on one day in a 45-minute session and SECTION B the following day in another 45-minute session.LIFE SCIENCES SCHOOL-BASED ASSESSMENT EXEMPLARS – 13CAPS GRADE 12 TEACHER GUIDE
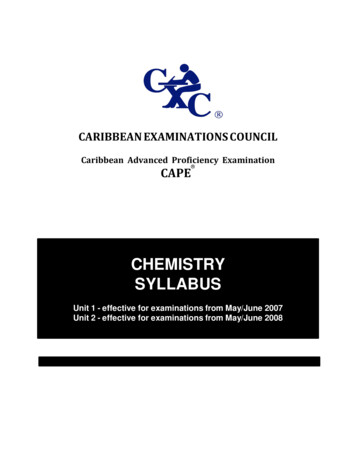
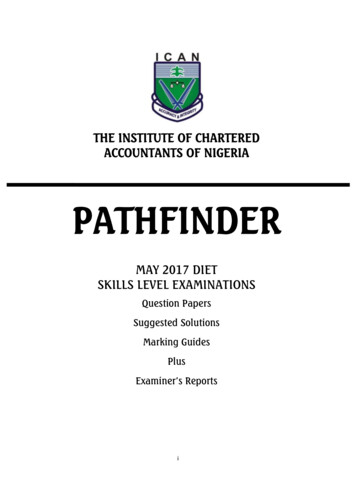
SECTION AQUESTION 1An investigation was conducted to study apical dominance in bean plants. Four groups of plants were used. Thediagram below illustrates the process.The results are shown in the table below.Group 1Group 2Group 3Group 4Treatment givenUntreatedApical meristemremovedApical meristem removedand auxin applied to thecut tipApical meristem intact but a barrierto the movement of substanceswas placed under the tipResponse totreatment givenGrowth of apical meristembut not of lateral budsGrowth of lateralbudsNo growth of lateral budsGrowth of lateral buds1.1For this investigation, state the:1.1.1Independent variable(1)1.1.2Dependent variable(1)1.1.3Any TWO fixed variables(2)1.2Formulate a possible hypothesis for the above investigation.(3)1.3Explain the difference in results for Groups 3 and 4.(4)1.4Do the results allow you to accept or reject the hypothesis you formulated in QUESTION 1.2?(1)[12]14LIFE SCIENCES SCHOOL-BASED ASSESSMENT EXEMPLARS –CAPS GRADE 12 TEACHER GUIDE
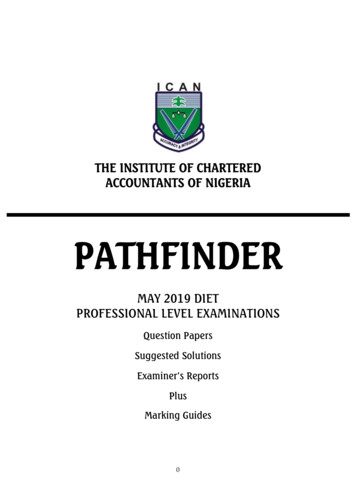
QUESTION 2The diagrams below show some stages in an investigation involving germinating bean seeds, kept in an evenly warm,damp environment.2.1What physical stimulus leads to the response above?(1)2.2Using the information in the diagram and your own knowledge, describe how the tip of the root growsin the direction that it does after two days.(6)2.3State TWO functions (other than growth movements and apical dominance) of the hormoneresponsible for the growth movement illustrated above.(2)2.4Will the same results be obtained if the investigation is carried out in a dark cupboard?(1)2.5Explain your answer to QUESTION 2.4.(2)2.6Explain why the cotton wool was kept moist.(2)[14]LIFE SCIENCES SCHOOL-BASED ASSESSMENT EXEMPLARS – 15CAPS GRADE 12 TEACHER GUIDE
QUESTION 3Read the passage below and answer the questions that follow.DIABETES MELLITUSDiabetes mellitus is a disorder relating to the role of insulin. There are two forms of the condition: insulin-dependentdiabetes (IDDM) and a non-insulin dependent form (NIDDM).IDDM accounts for about 15% of patients and usually develops before the age of 20. The condition arises when thebody’s immune system starts to attack the specific pancreas cells that make insulin. These patients can be treatedwith insulin injections.NIDDM occurs in older people. They have normal and even above normal levels of insulin, but the cells that wouldnormally respond become less sensitive to insulin. Therapy in this case involves correct diet and regular exercise.One method used to determine if a person is diabetic is an oral glucose tolerance test. This involves giving the patienta drink containing 75 g glucose in 300 cm3 water after fasting (no food for 24 hours). Blood glucose is tested regularlyfor at least two hours. If the readings are above 200 mg/100 ml up to two hours later, the patient is diagnosed as beingdiabetic.The normal plasma glucose level is 100 mg/100 ml. The glucose tolerance test was conducted for three adults and theplasma glucose level (mg/100 ml) was recorded for two hours at 30-minute intervals. The results are shown below.Time (minutes)0306090120Plasma glucose levelsAdult 1851251008580(mg/100 ml)Adult 2130215250260240Adult 31002101801701603.1State how the glucose tolerance response test above is used to decide if a person is suffering fromdiabetes.3.2Adult 1 is not diabetic.(2)3.2.1 Describe the changes expected in insulin secretion in Adult 1 during the period 30 minutes to90 minutes after the glucose drink.(2)3.2.2 Explain your answer to QUESTION 3.2.1.(2)3.3Draw two line graphs on the same set of axes to show the glucose tolerance of Adults 1 and 2.(9)3.4What was the percentage increase in glucose level when the glucose was at its maximum in Adult2? Show all working.(3)3.5Write down the plasma glucose level of the three adults after two hours as a ratio in simple wholenumbers. Show all working.(2)3.6Suggest, with reasons, what would happen to insulin secretion for Adult 2:3.6.1 If the condition was IDDM(2)3.6.2 If the condition was NIDDM(2)[24]TOTAL SECTION A:16LIFE SCIENCES SCHOOL-BASED ASSESSMENT EXEMPLARS –50CAPS GRADE 12 TEACHER GUIDE
SECTION BQUESTION 4Read the passage and information below and answer the questions that follow.STIMULUS AND RESPONSEThe eagle and the rabbit are dependent for their survival on their nervous system response rate. Their eye, ear andskin sensors send messages along sensory neurons to the central nervous system. The message is transferred byinterneurons to provide a response along motor neurons demanding that the muscles move quickly.Two learners conducted an investigation in the following way to determine which sense organ sends the messagefastest to the brain: the eye, the ear or the skin (sight, hearing, or touch):1.Vusi held a meter stick between his thumb and index finger just above the 100 cm mark, while Mary placed herthumb and forefinger at the 0 mark on both sides of the stick with just the thumb touching it.2.As Vusi dropped the meter stick Mary attempted to catch it by closing her thumb and forefinger. The distance onthe meter stick that the stick fell before Mary caught it was recorded and the procedure was repeated three times.3.They repeated the investigation to determine hearing and skin responses. For the hearing response, Mary wasblindfolded and reacted to Vusi shouting ‘DROP’ when he let go of the stick. For the skin response, Mary wasblindfolded again. Vusi tapped Mary’s free hand when he let go of the stick.The results they obtained are shown in the following table:Trial numberDistance on meter stick (cm)SightHearingTouch12510236832692,3X9Average distance (cm)4.1Name the path that is described in the passage.4.2In relation to this path, what term is used to describe each of the following in terms of the role theyplay?4.3(2)4.2.1The muscles(1)4.2.2Skin sensors(1)Why should you advise the two learners to repeat the procedure more than three times for eachinvestigation?LIFE SCIENCES SCHOOL-BASED ASSESSMENT EXEMPLARS – 17(2)CAPS GRADE 12 TEACHER GUIDE
4.4Identify the following in their investigation:4.4.1 The dependent variable(1)4.4.2 The independent variable(1)4.5Calculate the average distance that the meter stick fell when doing the ‘hearing’ investigation. Showall working.(3)4.6Study the graph below showing how the distance on the meter stick can be converted to reactiontime in milliseconds.500450400350300Use the reaction time over distance conversion graph to determine:4.6.1 The actual reaction time if the meter stick dropped 9 centimetres(2)4.6.2 The distance the ruler will drop for a reaction time of 400 milliseconds(2)[15]QUESTION 5The graph shows the speed of a nerve impulse along neurons with different diameters, measured in micrometres(μm).18LIFE SCIENCES SCHOOL-BASED ASSESSMENT EXEMPLARS –CAPS GRADE 12 TEACHER GUIDE
5.1Describe the relationship between the diameter of a neuron and the speed of an impulse travellingalong the neuron.(2)5.2Use the graph to estimate how fast an impulse would travel along a neuron with a diameter of 5μm.(2)5.3Name the functional gap found between two neurons across which impulses aretransmitted.(1)5.4Explain the significance of the myelin sheath that covers the neurons.(2)5.5Draw a diagram to illustrate the structure of a motor neuron. Indicate the direction of the impulseby means of an arrow in the diagram.(7)[14]QUESTION 6A person sitting in a darkened room covers one eye. A dim electric bulb, positioned at varying distances from theperson, is switched on at one-minute intervals for a period of 9 seconds. During this period the diameter of the pupil ofthe eye is measured. The results obtained are shown in the table below. Study the table and answer the questions thatfollow.Time interval123456789Diameter of pupil (mm)2455873166.1Name the structure in the eye that controls the size of the pupil.6.2Between which TWO time intervals did the following changes in the diameter of the pupil occur?(1)6.2.1Smallest increase(2)6.2.2Biggest decrease(2)6.3State why the size of the pupil changes from interval 8 to interval 9.(2)6.4Describe how the size of the pupil changes from interval 8 to interval 9.(4)6.5Why is the response in QUESTION 6.3 referred to as a ‘reflex’?(1)6.6What is the significance of this reflex?(1)6.7At which time interval was the bulb the furthest from the eye?(1)6.8Explain your answer to QUESTION 6.7.(2)6.9State TWO ways in which the investigator could ensure that the results of this investigation arereliable.(2)6.10State THREE things that must be kept constant in this investigation to ensure that it is valid.(3)[21]LIFE SCIENCES SCHOOL-BASED ASSESSMENT EXEMPLARS – 19TOTAL SECTION B:50GRAND TOTAL:100CAPS GRADE 12 TEACHER GUIDE
Assignment 2 – Reproduction6.4TopicReproductionSpecific aim(s)SA 1, SA 2, SA 3 Type of activityMarks100DurationIndividual90 minutesInstructions and information1.Answer ALL questions.2.Number the answers correctly according to the numbering system used in this question paper.3.Draw diagrams and flow charts ONLY when requested to do so.4.This assignment is to be done under controlled conditions and must be handed in at the end of the session.NOTE: If it is not possible to schedule a single 90-minute session for this assignment, then SECTION A can bedone on one day in a 45-minute session and SECTION B the following day in another 45-minute session.20LIFE SCIENCES SCHOOL-BASED ASSESSMENT EXEMPLARS –CAPS GRADE 12 TEACHER GUIDE
SECTION AQUESTION 1Read the text below and then answer the questions that follow.REPRODUCTIVE STRATEGIES OF THE BULLFROGMost amphibians spend at least part of their lives in moist surroundings, and their fragile, jelly-like eggs are usuallylaid in water.In mating and feeding, amphibians are active at night. The courtship call of the bullfrog attracts females for mating.During mating, the female bullfrog deposits as many as 10 000 eggs into the water and the male simultaneouslyreleases sperm. Fertilisation occurs externally.The eggs of most species of bullfrog hatch into tadpoles in 3–5 days. Tadpoles breathe through gills and metamorphoseinto air-breathing adults with lungs. Laying eggs in water prevents drying out and makes it easier for the frog spermto reach the eggs.Amphibian eggs appear as small black spots in a gelatinous mass and receive little or no parental protection. Largenumbers of eggs are produced because many are eaten and changes in the environmental moisture cause many todehydrate and die. Nearby plant matter shelters the hatching tadpoles.1.1State the type of fertilisation (external or internal) that occurs in bullfrogs and describe how it occurs.(3)1.2State whether reproduction in bullfrogs is viviparous, oviparous or ovoviviparous.(1)1.3Explain your answer to QUESTION 1.2.(2)1.4Describe TWO characteristics of a frog’s egg.(2)1.5Give TWO reasons suggested in the article for bullfrog eggs to be laid in water.(2)1.6Frog eggs are vulnerable to predators, since there is little or no parental protection.Explain THREE strategies that ensure a good survival rate of tadpoles.(6)[16]LIFE SCIENCES SCHOOL-BASED ASSESSMENT EXEMPLARS – 21CAPS GRADE 12 TEACHER GUIDE
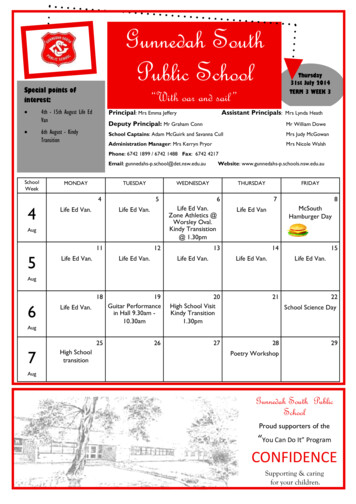
QUESTION 2The electron micrograph below is that of the human sperm. Study the micrograph and answer the questions that follow.2.1Draw a labelled line diagram of the human sperm represented in the electron micrograph.(6)2.2Use the scale line provided to calculate the width of the sperm at its widest point.(4)2.3Explain THREE ways in which the sperm is structurally suited for its role in fertilisation.(6)[16]QUESTION 3Records of human fertility for the period 1941 to 1990 have shown changes in the sperm counts of normal men. Thetable below summarises the changing percentages of men with high or low sperm counts over a period of 50 years.3.1TIME PERIODMEN WITH HIGH SPERM COUNTS (%)MEN WITH LOW SPERM COUNTS –198021141981–19901518During which time period was there:3.1.1The highest percentage of men with low sperm counts?(1)3.1.2The lowest percentage of men with high sperm counts?(1)3.1.3The greatest difference between men with high sperm counts and men with lowspermcounts?(1)3.2Describe the trend for men with low sperm counts, and compare it with those with high sperm countsover the period of 50 years.(2)3.3Calculate the percentage increase in men with low sperm counts from 1971 to 1990.(2)3.4Suggest TWO reasons for the trend described in QUESTION 3.2.(2)[9]22LIFE SCIENCES SCHOOL-BASED ASSESSMENT EXEMPLARS –CAPS GRADE 12 TEACHER GUIDE
QUESTION 4The table below shows the results of a survey on the use of contraceptives by a sample of women in a rural area.CONTRACEPTIVENUMBER OF WOMENSterilisation34Pill38Condom22Rhythm method30None76TOTAL200[9]Draw a pie chart to show the results of the survey. Show all working.TOTAL SECTION A:50SECTION BQUESTION 5The diagram below shows the changes in the ovary, uterus and level of hormones during a 28-day menstru
LIFE SCIENCES SCHOOL-BASED ASSESSMENT EXEMPLARS - 2 CAPS GRADE 12 TEACHER GUIDE TABLE OF CONTENTS Contents 1. Introduction 3 2. Aims of the project 3 3. Programme of formal assessment in Life Sciences 4 3.1 Practical tasks 5 3.2 Research Project 5 3.3 Assignment 6 3.4 Tests and Examinations 6 4. Scope of the project 7 5.