Transcription
Paper SAS235-2017The REPORT Procedure and ODS Destination for Microsoft Excel: TheSmarter, Faster Way to Create First-Rate Excel ReportsJane Eslinger, SAS Institute Inc.ABSTRACTDoes your job require you to create reports in Microsoft Excel on a quarterly, monthly, or even weeklybasis? Are you creating all or part of these reports by hand, referencing another sheet containing rows androws and rows of data? If so, stop! There is a better way!The new ODS destination for Excel enables you to create native Excel files (XLSX) directly from SAS. Nowyou can include just the data you need, create great-looking tabular output, and do it all in a fraction of thetime!This paper shows you how to use PROC REPORT to create polished tables that contain formulas, coloredcells, and other customized formatting. Also presented in the paper are the destination options used tocreate various workbook structures, such as multiple tables per worksheet. Using these techniques toautomate the creation of your Excel reports will save you hours of time and frustration, enabling you topursue other endeavors.INTRODUCTIONNo matter which industry you work in, no matter if your company is big or small, reports in Microsoft Excelare probably a fundamental part of your business life. Microsoft Excel reports seem to be universal andaccepted by everyone. Unfortunately, though, many of those reports are still created manually, consumingvast amounts of analysts’ time. Well, it is time to change that! You already have SAS software, so why notuse it to create those Excel reports for you? You can create a SAS program to generate each weekly,monthly, and quarterly report, and then spend your time on more important tasks. This paper is going toshow you how to do just that. The effort you make now in learning about the ODS destination for Excel willbenefit you later.You will learn about ODS destination for Excel options that can be used to create the desired workbookstructure. These options include such things as tab names, tab color, specifying the cell in which the reportstarts, and specifying the scale to use when printing. All of those options are important to the final look andfeel of the report, which, to the consumer of the report, can be just as important as the numbers.The examples in this paper focus on creating tabular output with the REPORT procedure. Though theODS destination for Excel is also capable of supporting graphical output, this paper concentrates on tablescontaining the numbers from your analyses. PROC REPORT provides the capability to mimic the tablescreated manually in Excel.Important features of tables include formulas, colors, and customized formatting. Headers and rows of textalso play an important role in conveying the information that is inside of the report. Each of these topics iscovered through PROC REPORT examples in this paper.As you read and work through the examples in this paper, please be aware that the ODS destination forExcel did not become production until the third maintenance release of SAS 9.4 (SAS 9.4 TS1M3). TheODS EXCEL statement was available in 9.4 TS1M1; however, it is best if you use SAS 9.4 TS1M3 or later,especially when creating production-level jobs.INVEST TIME IN LEARNING THE ODS DESTINATION FOR EXCELYour time is valuable, so you want to create Excel reports as quickly as possible and move on to moreinteresting or pressing tasks. However, you might wonder if PROC REPORT and the ODS destination forExcel can create what you need. This is an understandable concern. SAS is really good at creatingreports, but you need to determine whether it can create your report.1
The best way to determine whether you can mimic your current manual reports is to explore the optionsand suboptions available within the ODS destination. These options control the printing, display, andstructural components of each workbook. They play an integral role in producing a high-quality Excelreport that not only conveys numbers but is also easy to navigate.ODS EXCEL STATEMENT OPTIONS FOR DOCUMENT PROPERTIESFirst things first. The ODS EXCEL statement has options just like all other ODS statements. A number ofoptions in the ODS EXCEL statement are used to control the document properties. Depending on yourbusiness requirements, you might need to use any or all of these options. These options include: AUTHOR CATEGORY COMMENTS KEYWORDS STATUS TITLEThe values for these options must be set in the ODS EXCEL statement that also contains the FILE option. In other words, they must be set when document creation is started.Note: A few options in the ODS EXCEL statement control graphical output: TITLE NOGTITLE,GFOOTNOTE NOGFOOTNOTE, DPI, and IMAGE DPI. However, this paper is about tabular output, soplease see the SAS 9.4 Output Delivery System: User's Guide, ODS EXCEL Statement for anexplanation of these options.ODS EXCEL STATEMENT OPTIONS OPTIONThe most important option in the ODS EXCEL statement is called, lamentably, OPTIONS. It enables youto specify a suboptions list that provides greater control over the structure of your Excel workbook andworksheets. You will find the OPTIONS option is the one you need to use the most, so spend some timelearning about its uses.The OPTIONS option is immediately followed by an open parenthesis, unlike other options that arefollowed by an equal sign. Within the parentheses, you list the suboptions that you would like to apply tothe worksheet. The value of each suboption must be enclosed in quotation marks. You can use eithersingle or double quotation marks. It is a little confusing, but once you start to use the ODS EXCELstatement regularly, you will become more comfortable with the syntax and the difference betweenOPTIONS for the ODS statement and suboptions that go in parentheses.The suboptions within OPTIONS parentheses can be toggled on and off during the creation of thedocument, depending on your needs. The suboptions are specific to each individual worksheet. However,once set, the value of a suboption is retained for all subsequent worksheets until it is changed.The SAS 9.4 TS1M3 documentation lists approximately 45 suboptions! Roughly half of these controlvarious printing aspects of the worksheet. The other half control the visual parts that you notice whenviewing the report on the screen. Forty-five suboptions is too many to list in this paper, and too many tofocus on. Consequently, only the most important and commonly used suboptions are demonstrated here.One suboption is important to mention specifically because it can be confusing. This is the GRIDLINESsuboption. The GRIDLINES suboption does not affect what you see on the screen when you are viewingthe report—it affects only printed output. The “Gray Lines and Borders” section of this paper covers how toinclude or exclude the standard light gray lines that you see when you open Microsoft Excel. It alsodemonstrates how to outline the table and cells with more pronounced borders.You might be familiar with the suboption DOC from other ODS tagsets. The DOC suboption is notavailable in the ODS destination for Excel. You do not get an error if you include it, but information is not2
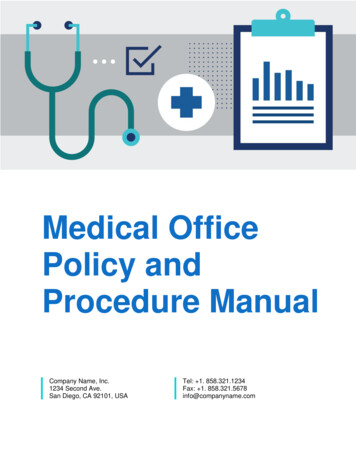
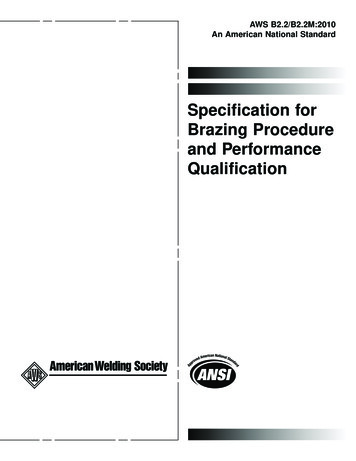
written to the log. All information about options and suboptions for the Excel destination is contained in theODS Excel Statement documentation mentioned above.Suboptions That Control Worksheet FeaturesSome worksheet features need to be set no matter what type of output the worksheet will contain. Thissection discusses the suboptions that are used to control worksheet features.Example 1, below, includes these suboptions: EMBEDDED TITLES places the title(s) as part of the worksheet. EMBEDDED FOOTNOTES places the footnote(s) as part of the worksheet. TAB COLOR changes the background color of the tab name. START AT identifies the cell in which to place the first column’s header; in SAS 9.4 TS1M3, this mustbe listed as two numbers in the form column, row. FROZEN HEADERS specifies header rows that should remain static when scrolling up and down.Example 1:ods excel file 'example1.xlsx' options(embedded titles 'yes'embedded footnotes 'yes' tab color 'purple' start at '2,4'frozen headers 'yes');title 'This title will appear in the worksheet';footnote 'This footnote will appear in the worksheet';proc report data sashelp.class;run;ods excel close;Output 1. Results for Example 13
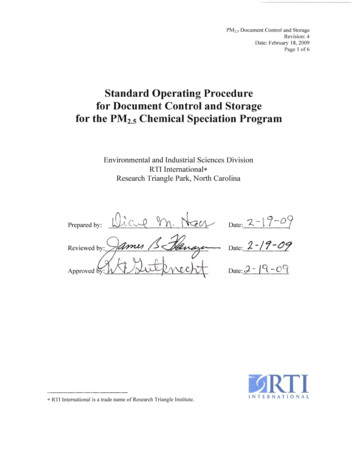
In Output 1, the output starts at cell B4, the result of using the START AT suboption. Since theEMBEDDED TITLES suboption is used, this means that the titles are placed within the document, in cellB4. One row is skipped between the titles and the table. The table begins on row 6.Notice the line under row 6. This is a visual indicator of the scrolling capabilities from usingFROZEN HEADERS. When you scroll farther down the screen, the first six rows remain static.The ODS destination for Excel also has a suboption called FROZEN ROWHEADERS, which specifiesthat a column should remain static when you scroll left and right. When FROZEN ROWHEADERS is setto YES, which column is frozen depends on the procedure. For example, PROC PRINT has an OBScolumn, which is considered a row header and is therefore frozen when the FROZEN ROWHEADERSsuboption is used. PROC REPORT does not have a column designated as a row header. Currently, it isnot possible to designate a column generated by PROC REPORT as a row header. For PROC REPORT,you have to specify a number value in the FROZEN ROWHEADERS suboption to freeze a column.Also, notice that the title and footnote wrap. In Output 1, above, the title and footnote are confined to thewidth of the table. You can alter this behavior using the TITLE FOOTNOTE NOBREAK suboption. Settingthis option to YES, as shown below in Example 2, prevents the title and footnote from wrapping bymerging as many cells as necessary to hold the title/footnote.Example 2:ods excel file 'example2.xlsx' options(embedded titles 'yes'embedded footnotes 'yes' tab color 'purple' start at '2,4'frozen headers 'yes' title footnote nobreak 'yes');Output 2. Results for Example 2 Using TITLE FOOTNOTE NOBREAK4
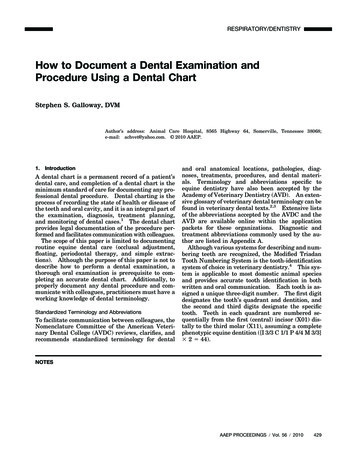
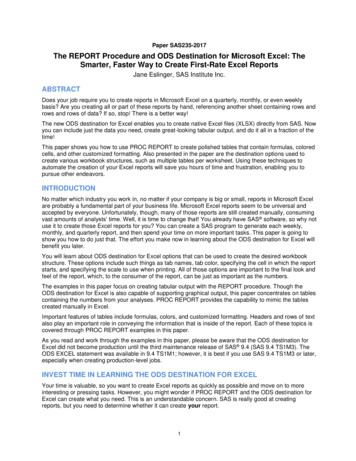
Suboptions That Control Table FeaturesThe previous section discussed suboptions that control the worksheet features. This section discussessuboptions that control table features. Frequently used suboptions that provide this control are listed belowand demonstrated in Example 3. HIDDEN ROWS hides specific rows in the worksheet. AUTOFILTER turns on Excel filtering capability; can be applied to all columns or a subset of columns. ABSOLUTE COLUMN WIDTH specifies the column width; one width can be listed for all columns, ora width can be listed for multiple columns. Cannot be overwritten by style attributes within theprocedure. ABSOLUTE ROW HEIGHT specifies the row height; one width can be listed for all rows, or a heightcan be listed for multiple rows.Example 3:ods excel file 'example3.xlsx' options(hidden rows '6' autofilter '1-3'absolute column width '16' absolute row height '25');proc report data sashelp.cars;run;ods excel close;Output 3. Results for Example 3Immediately you can see the difference in the table between Output 3 and Output 1. All of the columns arethe same width, and each row is tall enough to provide visual separation between the data values.The ABSOLUTE COLUMN WIDTH suboption plays a key role in the look of this table. It is one of the lastfeatures applied to the column. It always wins. This means that if you set a column width within theprocedure, ABSOLUTE COLUMN WIDTH will override it. This suboption is good to use when you wantthe column to be a consistent size no matter how many characters are in the data field. Without thissetting, the width of the column depends on the data values or a width specification within the procedure.Note: The value specified by ABSOLUTE COLUMN WIDTH is not the pixel value you see when manuallywidening a column. It is the value shown by right-clicking the column and selecting Column Width.The drop-down arrows in the first three column headers were created with the AUTOFILTER suboption. Aperson reviewing the report can use these filters to subset the report without having to change the data orrerun the report.ABSOLUTE ROW HEIGHT sets the same height, 25, for all rows in the table, including the header row.5
In Output 3, above, notice that you cannot see row 6. The row is still present, but you cannot see itbecause the HIDDEN ROWS suboption was used. The HIDDEN ROWS suboption is especially helpfulfor rows created by the BREAK statement. PROC REPORT cannot conditionally execute or print a rowgenerated by a BREAK statement; this means that the BREAK statement will sometimes have the samevalues as the detail row above it because the grouping had only one subgrouping value. TheHIDDEN ROWS suboption enables you to suppress that repetitive row.Suboptions That Affect the Number of Worksheets CreatedSo far, we have discussed suboptions that affect worksheet features and some of the table’s structuralfeatures like column widths. You might have noticed that those sections focused on just one table on oneworksheet. Chances are, though, the reports you create by hand contain multiple worksheets. They mightalso contain multiple tables per worksheet.The default behavior for the destination is to place each table it its own worksheet. Please be aware thatthe distinction between table and procedure is very important, especially for PROC REPORT. By default,PROC REPORT creates just one table, so the output from the procedure creates just one worksheet.However, using the BREAK statement with the PAGE option generates multiple tables. Each one of thesetables is written to its own worksheet.The code in Example 4 uses the PAGE option with the break variable SEX. The result, shown in Output 4,is a workbook with two worksheets.Example 4:ODS excel file 'example4.xlsx';proc report data sashelp.class;column sex name age height weight;define sex / group;break after sex / page;run;ods excel close;
The REPORT Procedure and ODS Destination for Microsoft Excel: The Smarter, Faster Way to Create First-Rate Excel Reports Jane Eslinger, SAS Institute Inc. ABSTRACT Does your job require you to create reports in Microsoft Excel on a quarterly, monthly, or even weekly basis? Are you creating all or part of these reports by hand, referencing another sheet containing rows and rows and rows of data .File Size: 1MBPage Count: 20